

Atrophy related neuroimaging biomarkers for neurological and cognitive function in Wilson disease
- PMID: 40598398
- PMCID: PMC12217823
- DOI: 10.1186/s42466-025-00401-3
Atrophy related neuroimaging biomarkers for neurological and cognitive function in Wilson disease
Abstract
Background: Although brain atrophy is a prevalent finding in Wilson disease (WD), its role as a contributing factor to clinical symptoms, especially cognitive decline, remains unclear. The objective of this study was to investigate different neuroimaging biomarkers related to grey matter atrophy and their relationship with neurological and cognitive impairment in WD.
Methods: In this study, 30 WD patients and 30 age- and sex-matched healthy controls were enrolled prospectively and underwent structural magnetic resonance imaging (MRI). Regional atrophy was evaluated using established linear radiological measurements and the automated workflow volumetric estimation of gross atrophy and brain age longitudinally (veganbagel) for age- and sex-specific estimations of regional brain volume changes. Brain Age Gap Estimate (BrainAGE), defined as the discrepancy between machine learning predicted brain age from structural MRI and chronological age, was assessed using an established model. Atrophy markers and clinical scores were compared between 19 WD patients with a neurological phenotype (neuro-WD), 11 WD patients with a hepatic phenotype (hep-WD), and a healthy control group using Welch's ANOVA or Kruskal-Wallis test. Correlations between atrophy markers and neurological and neuropsychological scores were investigated using Spearman's correlation coefficients.
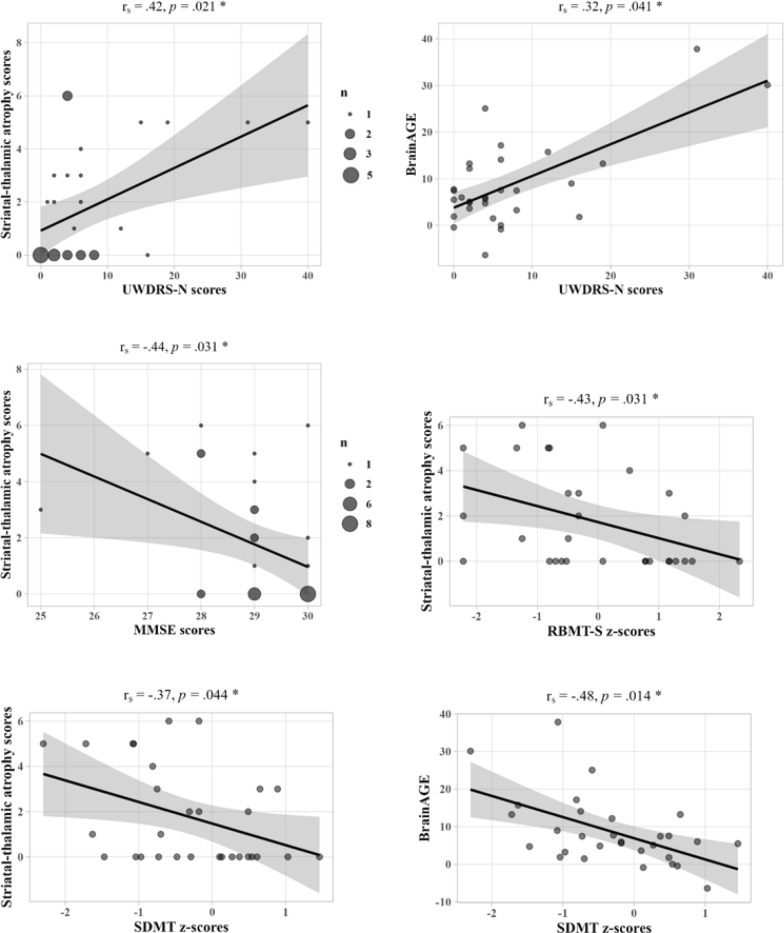
Results: Patients with neuro-WD demonstrated increased third ventricle width and bicaudate index, along with significant striatal-thalamic atrophy patterns that correlated with global cognitive function, mental processing speed, and verbal memory. Median BrainAGE was significantly higher in patients with neuro-WD (8.97 years, interquartile range [IQR] = 5.62-15.73) compared to those with hep-WD (4.72 years, IQR = 0.00-5.48) and healthy controls (0.46 years, IQR = - 4.11-4.24). Striatal-thalamic atrophy and BrainAGE were significantly correlated with neurological symptom severity.
Conclusions: Our findings indicate advanced predicted brain age and substantial striatal-thalamic atrophy patterns in patients with neuro-WD, which serve as promising neuroimaging biomarkers for neurological and cognitive functions in treated, chronic WD.
Keywords: BrainAGE; Atrophy; Cognition; Magnetic resonance imaging; Wilson disease.
© 2025. The Author(s).
Conflict of interest statement
Declarations. Ethics approval and consent to participate: This study was part of a larger observational imaging study on neurodegenerative diseases (DRKS00034050; retrospectively registered February 10th, 2025) and has been approved by the ethics committee of the Medical Faculty at the Heinrich-Heine University Düsseldorf, Germany (IRB00001579), under the study number 2019-470_4. It has been performed in accordance with the Declaration of Helsinki. All subjects provided written informed consent prior to participation. Consent for publication: Not applicable. Competing interests: CJH received honoraria and travel support from Alexion Pharma Germany GmbH, Orphalan SA, and Univar Solutions B.V. He received speaker fees from AbbVie and Abbott. The remaining authors declare that they have no competing interests.
Figures


References
-
- Ala, A., Walker, A. P., Ashkan, K., Dooley, J. S., & Schilsky, M. L. (2007). Wilson’s disease. The Lancet,369(9559), 397–408. 10.1016/s0140-6736(07)60196-2 - PubMed
-
- Portala, K., Levander, S., Westermark, K., Ekselius, L., & von Knorring, L. (2001). Pattern of neuropsychological deficits in patients with treated Wilson’s disease. European Archives of Psychiatry and Clinical Neuroscience,251(6), 262–268. 10.1007/pl00007543 - PubMed
-
- Rathbun, J. K. (1996). Neuropsychological aspects of Wilson’s disease. International Journal of Neuroscience,85(3–4), 221–229. 10.3109/00207459608986684 - PubMed
-
- Frota, N. A. F., Barbosa, E. R., Porto, C. S., Lucato, L. T., Buchpiguel, C. A., & Caramelli, P. (2013). Cognitive impairment and magnetic resonance imaging correlations in Wilson’s disease. Acta Neurologica Scandinavica,127(6), 391–398. 10.1111/ane.12037 - PubMed
-
- Wenisch, E., de Tassigny, A., Trocello, J., Beretti, J., Girardot-Tinant, N., & Woimant, F. (2013). Cognitive profile in Wilson’s disease: A case series of 31 patients. Revue Neurologique,169(12), 944–949. 10.1016/j.neurol.2013.06.002 - PubMed
LinkOut - more resources
Full Text Sources
Miscellaneous