

Machine learning for detection of diffusion abnormalities-related respiratory changes among normal, overweight, and obese individuals based on BMI and pulmonary ventilation parameters: an observational study
- PMID: 40598421
- PMCID: PMC12220551
- DOI: 10.1186/s12911-025-03064-x
Machine learning for detection of diffusion abnormalities-related respiratory changes among normal, overweight, and obese individuals based on BMI and pulmonary ventilation parameters: an observational study
Abstract
Background: The integration of machine learning (ML) algorithms enables the detection of diffusion abnormalities-related respiratory changes in individuals with normal body mass index (BMI), overweight, and obesity based on BMI and pulmonary ventilation parameters. We evaluated the effectiveness of various supervised ML algorithms and identified the optimal configurations for these applications.
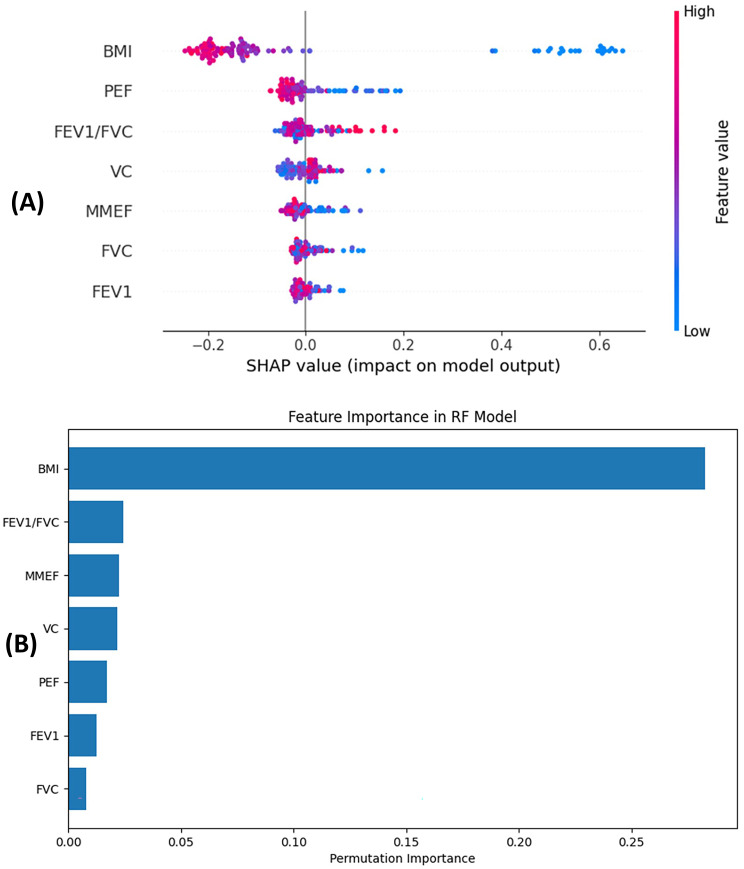
Methods: We conducted a retrospective analysis of data from 440 individuals who underwent pulmonary function tests between January 1, 2021, and April 1, 2024. This cohort consisted of 287 individuals with normal diffusion capacity (DN) and 153 with diffusion abnormalities (DA). We employed statistical comparisons (e.g., independent samples t-test and Chi-square test) to analyze demographic characteristics and spirometry results. Piecewise regression evaluated the correlation between BMI and carbon monoxide diffusing capacity (DLCO). Pulmonary ventilation parameters included forced vital capacity (FVC), forced expiratory volume in one second (FEV1), FEV1/FVC, peak expiratory flow (PEF), maximum mid-expiratory flow (MMEF) and vital capacity (VC). We applied several supervised ML algorithms and feature selection strategies to distinguish between DN and DA, including Support Vector Machine (SVM), Random Forest (RF), Adaptive Boosting (AdaBoost), Naive Bayes (BAYES), K-Nearest Neighbors (KNN), SelectKBest, Recursive Feature Elimination with Cross-Validation (RFECV), and SelectFromModel. Additionally, we performed feature importance analysis using shapley additive explanations (SHAP) and permutation importance to evaluate the contribution of individual parameters to the classification process.
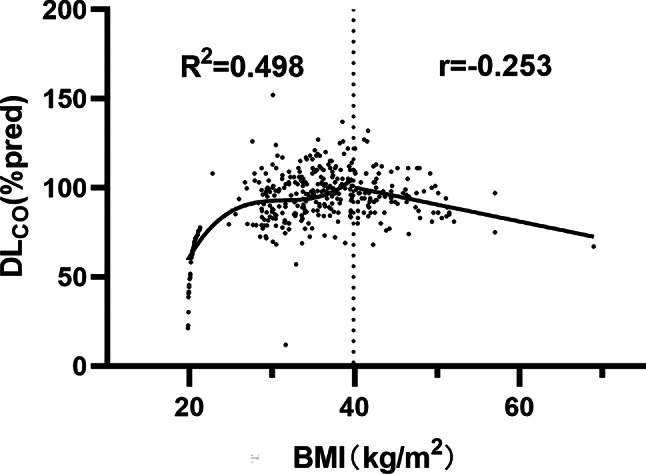
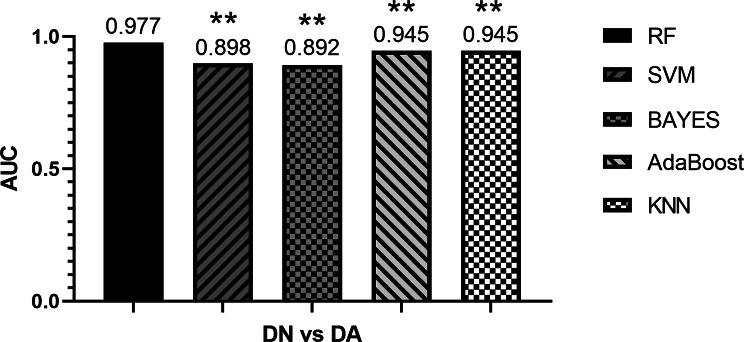
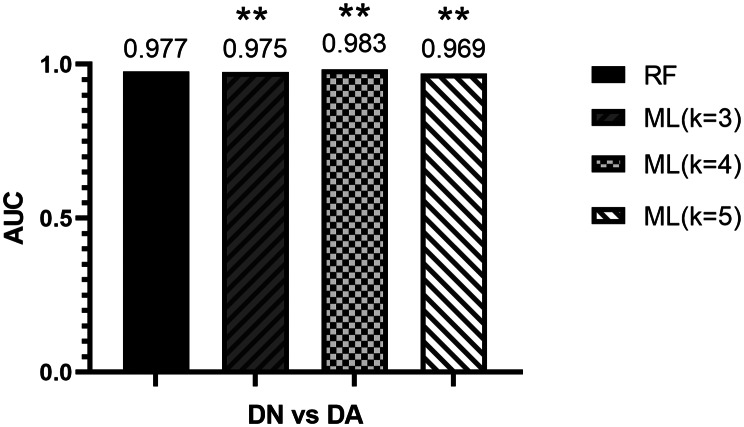
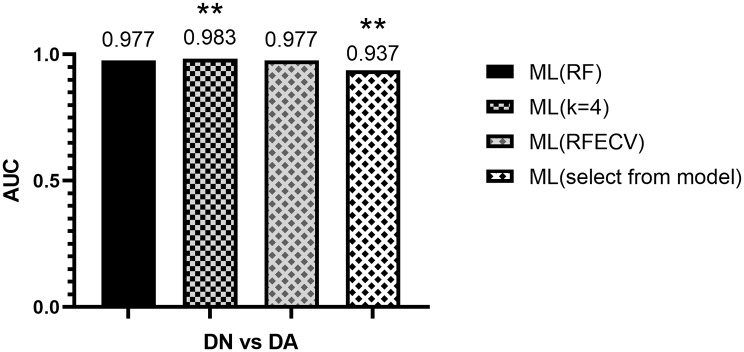
Results: Our findings revealed that individuals in the DA group demonstrated lower PEF and DLCO than their DN counterparts. BMI displayed a cubic relationship with DLCO for 18.5 kg/m² < BMI < 40 kg/m² (R² = 0.498, P < 0.01), and a linear negative correlation for BMI ≥ 40 kg/m² (r = -0.253, P < 0.05). Notably, the RF algorithm emerged as the most effective diagnostic tool for distinguishing between DN and DA, achieving an area under the curve (AUC) of 0.983, considerably outpacing other algorithms like BAYES, SVM, AdaBoost, and KNN (P < 0.01). Applying various feature selection strategies identified optimal parameters (BMI, FEV1/FVC, and VC) in subsequent experiments, which aligned with the results from feature importance analysis and pulmonary physiology. While feature selection enhanced KNN's diagnostic accuracy, it had a minimal impact on BAYES's performance.
Conclusion: The results indicate that for individuals with a BMI between 18.5 kg/m² and 40 kg/m², diffusion capacity improves with increasing BMI. Conversely, diffusion capacity decreases for those with a BMI of 40 kg/m² or higher. This study underscores the potential of combining BMI and pulmonary ventilation parameters with ML algorithms as a practical approach to diagnosing diffusion abnormalities across normal-weight, overweight, and obese categories, particularly in contexts utilizing portable spirometers.
Trial registration: Not applicable.
Keywords: Body mass index; Diffusing capacity; Machine learning.
© 2025. The Author(s).
Conflict of interest statement
Declarations. Ethics approval and consent to participate: This study conformed to the Declaration of Helsinki and was approved by the Ethics Committee of West China Hospital, Sichuan University, China. The study received ethical approval with a waiver of patient informed consent. Consent for publication: Not applicable. Competing interests: The authors declare no competing interests.
Figures
Similar articles
-
Hormonal contraceptives for contraception in overweight or obese women.Cochrane Database Syst Rev. 2016 Aug 18;2016(8):CD008452. doi: 10.1002/14651858.CD008452.pub4. Cochrane Database Syst Rev. 2016. PMID: 27537097 Free PMC article.
-
Machine learning for accurate detection of small airway dysfunction-related respiratory changes: an observational study.Respir Res. 2024 Jul 24;25(1):286. doi: 10.1186/s12931-024-02911-1. Respir Res. 2024. PMID: 39048993 Free PMC article.
-
Construction and validation of HBV-ACLF bacterial infection diagnosis model based on machine learning.BMC Infect Dis. 2025 Jul 1;25(1):847. doi: 10.1186/s12879-025-11199-5. BMC Infect Dis. 2025. PMID: 40596896 Free PMC article.
-
Optimized feature selection and advanced machine learning for stroke risk prediction in revascularized coronary artery disease patients.BMC Med Inform Decis Mak. 2025 Jul 24;25(1):276. doi: 10.1186/s12911-025-03116-2. BMC Med Inform Decis Mak. 2025. PMID: 40707947 Free PMC article.
-
Weight loss interventions for chronic asthma.Cochrane Database Syst Rev. 2012 Jul 11;2012(7):CD009339. doi: 10.1002/14651858.CD009339.pub2. Cochrane Database Syst Rev. 2012. PMID: 22786526 Free PMC article.
References
-
- Apovian CM. Obesity: definition, comorbidities, causes, and burden. Am J Manag Care. 2016;22(7 Suppl):s176–85. https://www.ajmc.com/view/obesity-definition-comorbidities-causes-burden. - PubMed
-
- Porro S, Genchi VA, Cignarelli A, et al. Dysmetabolic adipose tissue in obesity: morphological and functional characteristics of adipose stem cells and mature adipocytes in healthy and unhealthy obese subjects. J Endocrinol Invest. 2021;44(5):921–41. 10.1007/s40618-020-01446-84. - PubMed
-
- Jones RL, Nzekwu MM. The effects of body mass index on lung volumes. Chest. 2006;130(3):827–33. 10.1378/chest.130.3.827. - PubMed
Publication types
MeSH terms
Grants and funding
LinkOut - more resources
Full Text Sources
Medical
Miscellaneous
