Comparative Study
. 2025 Jul 1;23(1):709.
doi: 10.1186/s12967-025-06662-5.

Comparative analysis of statistical and deep learning-based multi-omics integration for breast cancer subtype classification

Affiliations
Comparative Study

Comparative analysis of statistical and deep learning-based multi-omics integration for breast cancer subtype classification

Mahmoud M Omran et al. J Transl Med. .

Abstract

Background: Breast cancer (BC) is a critical cause of cancer-related death globally. The heterogeneity of BC subtypes poses challenges in understanding molecular mechanisms, early diagnosis, and disease management. Recent studies suggest that integrating multi-omics layers can significantly enhance BC subtype identification. However, evaluating different multi-omics integration methods for BC subtyping remains ambiguous.

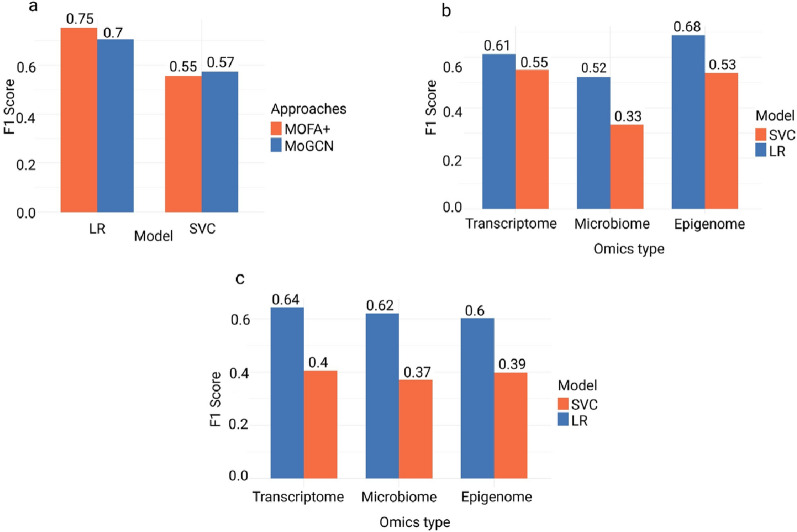
Methods: In this study, we conducted a multi-omics integration analysis on 960 BC patient samples, incorporating three omics layers: Host transcriptomics, epigenomics, and shotgun microbiome. We compared two integration approaches the statistical-based approach (MOFA+) and a deep learning-based approach (MOGCN) for this integration. We evaluated both methods using complementary evaluation criteria. First, we assessed the ability of selected features to discriminate between BC subtypes using both linear and nonlinear classification models. Second, we analyzed the biological relevance of the selected features to key BC pathways, focusing on transcriptomics-driven insights.

Results: Our results showed that MOFA+ outperformed MOGCN in feature selection, achieving the highest F1 score (0.75) in the nonlinear classification model, with MOFA+ also identifying 121 relevant pathways compared to 100 from MOGCN. Notably, one of the key pathways Fc gamma R-mediated phagocytosis and the SNARE pathway was implicated, offering insights into immune responses and tumor progression.

Conclusion: These findings suggest that MOFA+ is a more effective unsupervised tool for feature selection in BC subtyping. Our study underscores the potential of multi-omics integration to improve BC subtype prediction and provides critical insights for advancing personalized medicine in BC.

Keywords: Breast cancer; F1 score; Fc gamma R-mediated phagocytosis; MOFA+; MoGCN; Multi-omics integration; Network analysis; Personalized Medicine; SNARE pathway.


Conflict of interest statement

Declarations. Ethics approval and consent to participate: Ethical approval and consent to participate were waived since we used only publicly available data and materials in this study. Consent for publication: No consent. Competing interests: The authors declare that they have no competing interests.

Figures

Fig. 1
Fig. 1
A graphical overview of the study framework. Host transcriptomics, epigenomics, and shotgun Microbiome data from 960 BC patients were obtained from TCGA through cBioPortal. These multi-omics data were integrated through two different approaches: the statistical based multi-omics Factor analysis (MOFA+) and the deep learning based multi-omics integration represented by a graph convolutional network (MoGCN). The features selected from both approaches were used to build linear (Support vector classifier (SVC) and nonlinear (Logistic Regression (LR)) machine learning models to assess the ability of the selected features to classify BC data according to subtype. Transcriptomic features from both approaches were also used to build a network analysis using OmicsNet and identify pathway enrichment related to BC subtypes
Fig. 2
Fig. 2
MOFA+ and MoGCN analysis of BC data. a This illustration outlines the sequential steps of the MOFA+ analysis. Starting with multi-omics data loading, the MOFA+ reduce BC multi-omics into 15 latent factors. During this process, the contribution of each factor to variance explanation is evaluated. The layers of the multi-omics dataset and a summary are shown on the left, followed by the total variance explained by each modality in the middle, and the proportion of variance explained by individual factors on the right. b tSNE plot illustrates the ability of MOFA+ model to classify BC data according to subtype. c tSNE plot illustrates the ability of MoGCN model to classify BC data according to subtype. d The bar plot represents the clustering ability of each model, as measured by the Chi and the DBI. The MOFA+ model achieved a higher Chi of 42.42 compared to 15.80 for MoGCN, indicating better-defined clusters. Conversely, the DBI was slightly lower for MOFA+ (3.25) than for MoGCN (3.25), suggesting marginally better cluster separation in MoGCN
Fig. 3
Fig. 3
Machine learning models assessment. a The bar plot illustrates the F1 score for the SVC and LR for the combined selected features by features selected by the statistical-based (MOFA+) and deep learning-based (MoGCN) approaches. b The F1 scores for the individual omics features selected by MOFA+ are shown for both the linear model SVC and non-linear model LR, used in the classification of breast cancer data according to subtypes. c illustrate the F1 score for the MoGCN selected features by the individual omics also
Fig. 4
Fig. 4
The statistical-based and deep learning-based transcriptome features selected network analysis. a The network shows the gene-to-protein interaction across MOFA transcriptome selected features. The network contains 1578 nodes, 2255 edges, and 90 seeds. b The network of MoGCN transcriptome features shows also gene to protein interactions, where the network contains 870 nodes, 1087 edges, and 60 seeds. In both networks the gray color represents genes, and the pink color represents proteins
Fig. 5
Fig. 5
Network comparative analysis and pathway tracking analysis. a Upset plot comparing the node size of each network from different approaches. The statistical-based approach has the largest node size 1332 with 214 overlapping nodes between the two networks. b Radar plot shows the similarity between the networks on both node and edge levels based on the distances between them, the node distance is highlighted in green and the edge distance is highlighted in Pink. c Significant pathways (FDR < 0.05) uncovered by each method were compared to each other and represented by the Venn diagram. dg Four pathway categories were further tracked for a better understanding of how far each method can see inside the pathway, including d Cancer-related Pathways, e Signal Transduction Pathways, f Immune System and Inflammation Pathways, and g Cellular Processes and Metabolism

References

    1. Aguilar DL, et al. Towards an interpretable autoencoder: a decision-tree-based autoencoder and its application in anomaly detection. IEEE Trans Dependable Secure Comput. 2023;20(2):1048–59. 10.1109/TDSC.2022.3148331.
    1. Argelaguet R et al. Multi-Omics factor analysis disentangles heterogeneity in blood cancer. BioRxiv. 2017. p. 217554.
    1. Argelaguet R et al. Multi‐Omics Factor Analysis—a framework for unsupervised integration of multi‐omics data sets. Mol Syst Biol. 2018;14(6). 10.15252/msb.20178124. - PMC - PubMed
    1. Argelaguet R, et al. MOFA+: a statistical framework for comprehensive integration of multi-modal single-cell data. Genome Biol. 2020;21(1):111. 10.1186/s13059-020-02015-1. - PMC - PubMed
    1. Bascol K et al. Unsupervised interpretable pattern discovery in time series using autoencoders. 2016. p. 427–38. 10.1007/978-3-319-49055-7_38.

Publication types

Grants and funding

LinkOut - more resources