. 2025 Jul 1;18(1):249.
doi: 10.1186/s13071-025-06863-3.

Role of mast cell-derived exosomes in exacerbating neuronal injury of experimental cerebral malaria

Affiliations

Role of mast cell-derived exosomes in exacerbating neuronal injury of experimental cerebral malaria

Qianru Wang et al. Parasit Vectors. .

Abstract

Background: Cerebral malaria (CM), a fatal neurological complication of Plasmodium falciparum infection, is partially driven by neuronal injury. Emerging evidence highlights exosomes as vital mediators of mast cell-neuron interactions in neurological disease progression. While mast cells and their exosomes were previously shown to exacerbate experimental cerebral malaria (ECM) severity, the specific role of mast cell-derived exosomes in CM-associated neuronal injury remains unclear.

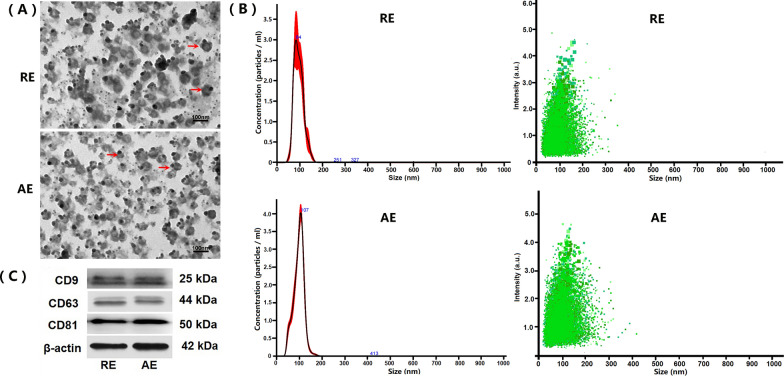
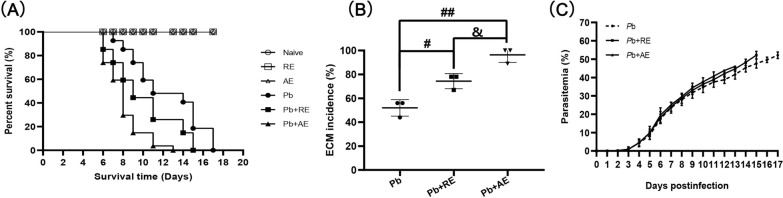
Methods: Exosomes were isolated from resting and lipopolysaccharide (LPS)-activated P815 mast cells (denoted as RE and AE, respectively) and characterized. These exosomes were administered to ECM mice and Plasmodium berghei ANKA (PbA)-infected red blood cell (iRBC)-stimulated neuronal HT-22 cells to investigate their functional impact and mechanisms.

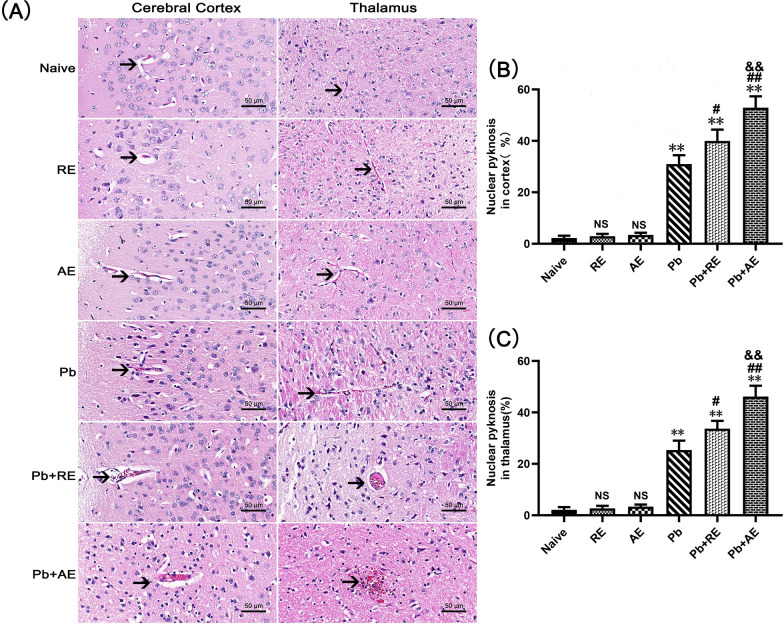
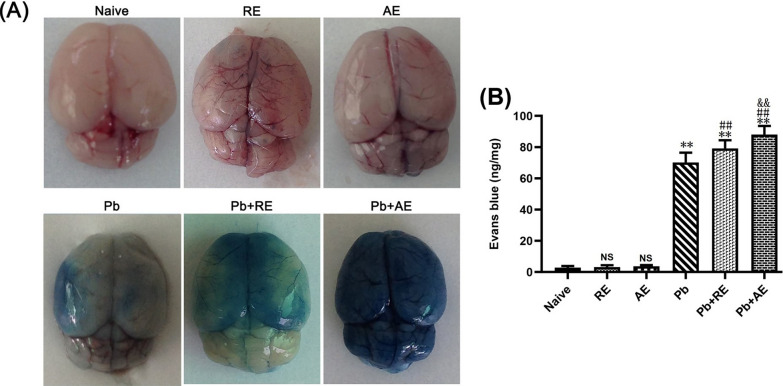
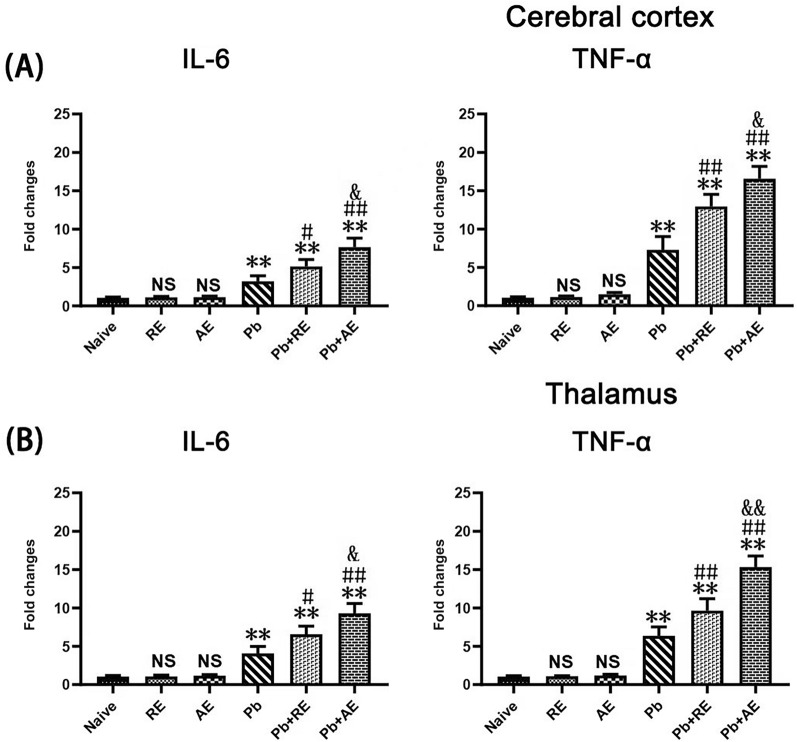
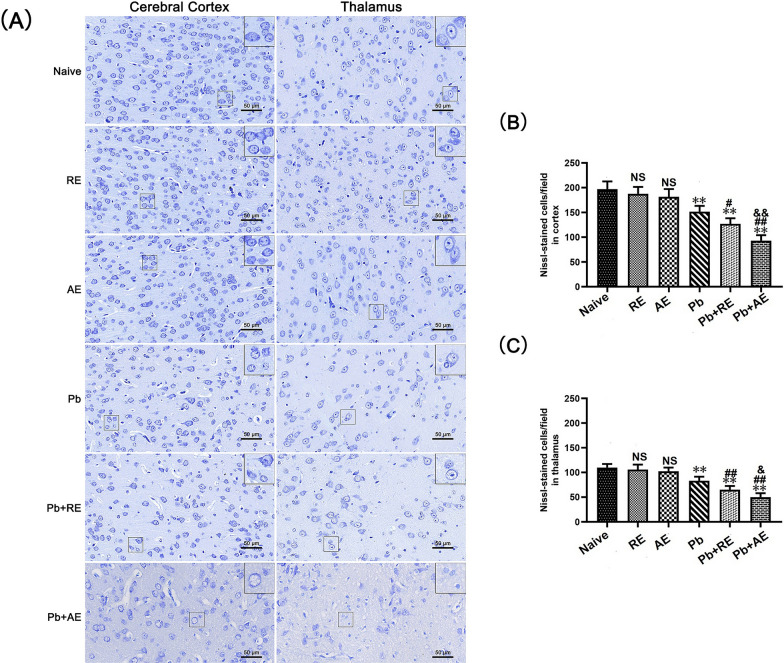
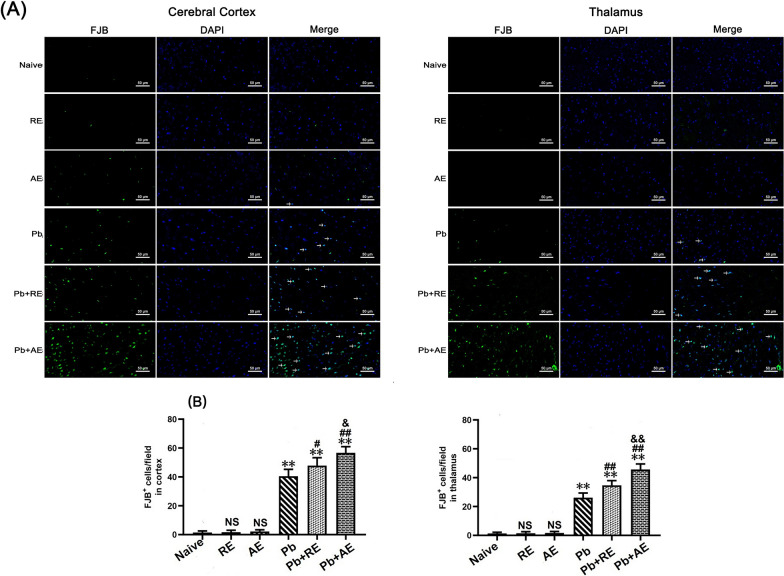
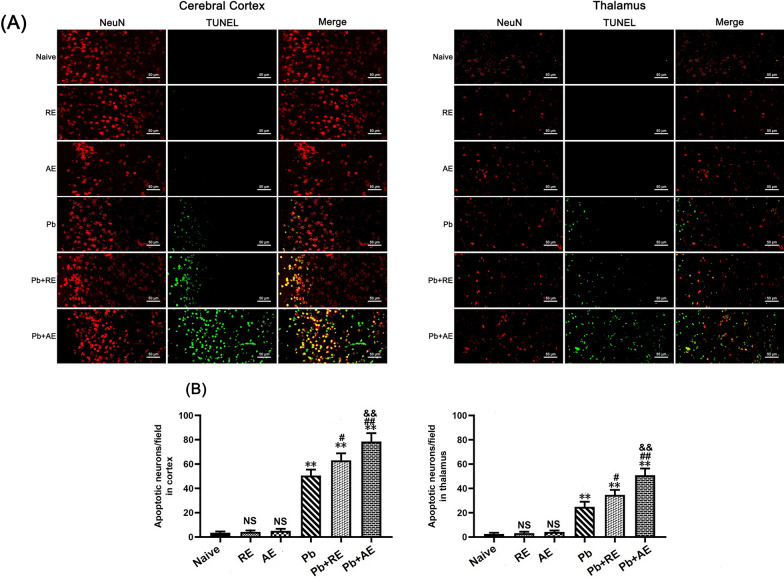
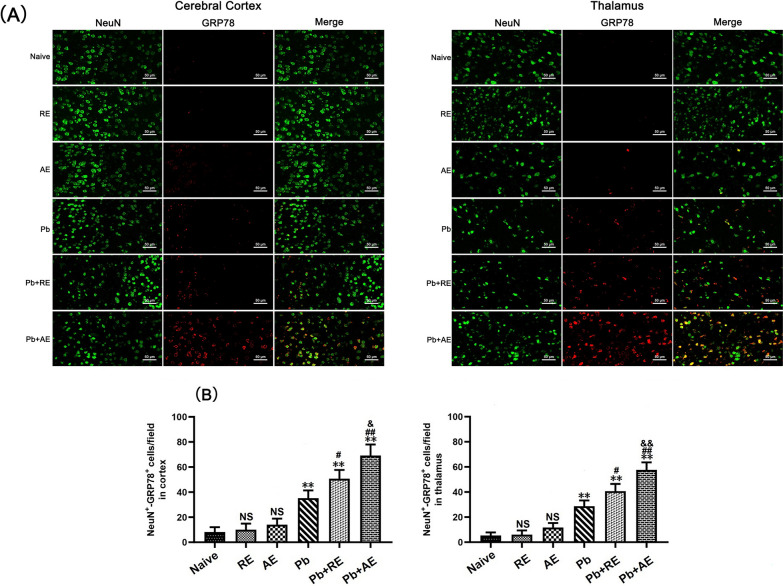
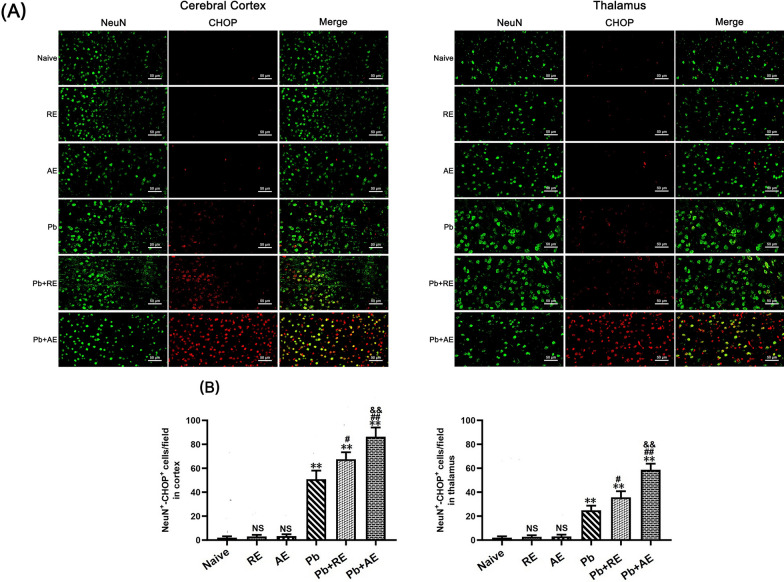
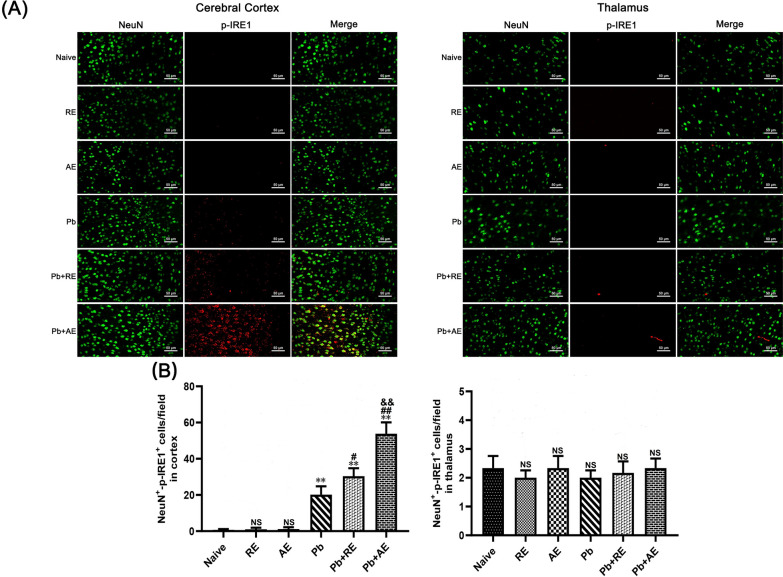
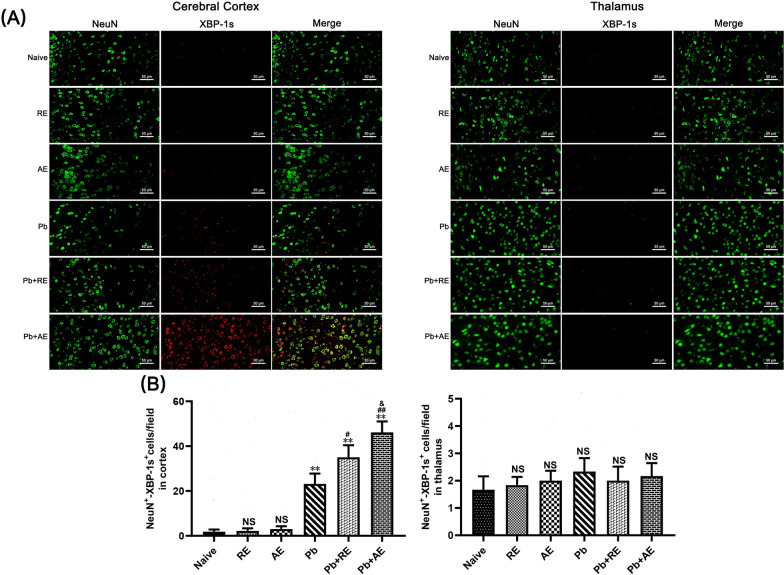
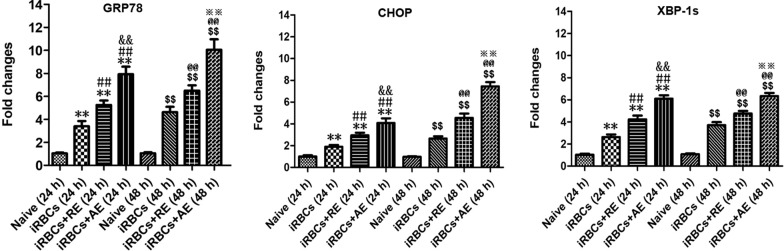
Results: Both RE and AE exhibited spherical morphology (20-100 nm diameter) and expressed exosomal markers (CD9, CD63, and CD81). Compared to infected controls, RE and AE treatments significantly reduced survival time, increased ECM incidence, and exacerbated brain pathology, blood-brain barrier disruption, neuronal injury, and apoptosis. Furthermore, RE and AE administration elevated messenger RNA (mRNA) levels of pro-inflammatory cytokines (interleukin [IL]-6, tumor necrosis factor alpha [TNF-α], and IL-1β) and increased numbers of neurons expressing endoplasmic reticulum (ER) stress markers (GRP78, CHOP, p-IRE1, XBP-1). Notably, AE treatment induced higher morbidity/mortality rates, more severe neuronal injury, and greater ER stress marker expression than RE. In vitro, RE-treated iRBC-stimulated neuronal HT-22 cells showed higher GRP78, CHOP, and XBP-1 mRNA levels than AE-treated cells. MicroRNA (miRNA) sequencing revealed three downregulated miRNAs (miR-330-3p, miR-185-5p, and miR-379-5p) and six upregulated miRNAs (miR-155-5p, miR-423-3p, miR-187-3p, miR-29c-3p, miR-188-5p, miR-192-5p) in AE versus RE, all previously implicated in targeting GRP78, CHOP, or XBP-1.

Conclusions: Mast cell-derived exosomes, particularly those from activated cells (AE), exacerbated ECM neuronal injury through partial activation of ER stress pathways.

Keywords: Cerebral malaria; Endoplasmic reticulum stress; Exosomes; Mast cells; Neuron.


Conflict of interest statement

Declarations. Ethics approval and consent to participate: All animal procedures were reviewed and approved by the Animal Ethics Committee of Guangdong Pharmaceutical University (No. gdpulac2023001). Consent for publication: Not applicable. Competing interests: The authors declare no competing interests.

Figures

Fig. 1
Fig. 1
Characterization of resting and LPS-activated P815 mast cell-derived exosomes (designated as RE and AE, respectively). Exosomes were isolated from culture supernatants of resting and LPS-activated P815 mast cells, and then characterized by transmission electron microscopy (TEM), nanoparticle tracking analysis (NTA), and western blotting. A Representative TEM images showing disk-shaped structures of RE and AE. Red arrows indicate typical exosomal vesicles. Scale bar = 100 nm. B NTA analysis indicating the size distribution (nm) and particle concentration (particles/ml) on RE (2.51 ± 0.14 × 1011 particles/ml) and AE (6.17 ± 0.22 × 1011 particles/ml), respectively. C Western blotting analysis confirming positive expression of exosomal markers (CD9, CD63 and CD81) in both RE and AE
Fig. 2
Fig. 2
Effects of RE and AE on the changes in survival time, ECM incidence, and parasitemia in the Plasmodium berghei ANKA (PbA)-infected mice. A, B Survival time and ECM incidence in the C57BL/6 mice (Naive, RE, AE: n = 4/group; Pb, Pb+RE, Pb+AE: n = 9/group) were monitored daily over 17 days across three independent experiments. C Parasitemia progression from day 3 post-infection was quantified via Giemsa-stained thin blood smears (tail vein), presented as iRBC percentage (iRBCs/total RBCs × 100%). Survival curves were analyzed by log-rank test; parasitemia dynamics were assessed by a time series analysis test. The experiment was independently repeated three times. #P < 0.05 and ##P < 0.01 vs. the PbA-infected ECM mice (Pb group). &P < 0.05 and &&P < 0.01 vs. the RE-treated ECM mice (Pb+RE group)
Fig. 3
Fig. 3
Effects of RE and AE on the brain histopathological changes in the ECM mice. A Representative images of histopathological changes by H&E staining in cerebral cortex (left) and thalamus (right) in uninfected mice from Naïve, RE, and AE groups, and ECM mice from the Pb, Pb+RE, and Pb+AE groups using a Leica DM2500B microscope at ×400 magnification. Arrows indicate typical blood vessels. B, C Quantification of pyknotic nuclei in cerebral cortex and thalamus was analyzed from mice in six groups by counting 20 non-overlapping fields/section (n = 6 mice/group) by two blinded investigators. Data are presented as mean percentage of pyknotic nuclei ± SD, and analyzed by unpaired Student’s t-tests between two groups. *P < 0.05 and **P < 0.01 vs. the uninfected control mice (Naïve group); #P < 0.05 and ##P < 0.01 vs. the PbA-infected ECM mice (Pb group). &P < 0.05 and &&P < 0.01 vs. the RE-treated ECM mice (Pb+RE group). NS: non-significant, P > 0.05, relative to Naïve mice
Fig. 4
Fig. 4
Effects of RE and AE on the changes in BBB integrity in the ECM mice. Evans blue (EB) dye was i.v. injected into uninfected mice from the Naïve, RE, and AE groups, and ECM from the Pb, Pb+RE, and Pb+AE groups. A Representative whole-brain photographs of EB extravasation in mice from six groups. B Quantification of EB extravasation in brain tissue of mice (n = 6/group, pooled from three independent experiments) was calculated from a standard curve (620 nm) and normalized to brain weight—ng (EB dye)/mg (brain weight). Data are presented as mean ± SD, and were analyzed by unpaired Student’s t-tests between two groups
Fig. 5
Fig. 5
Effects of RE and AE on the changes in neuroinflammation response in the ECM mice. (A, B) Total RNA was extracted from cerebral cortex (Upper) and thalamus (Lower) at uninfected mice from Naïve (n = 6), RE (n = 6), and AE (n = 6) groups, and ECM from Pb (n = 6), Pb+RE (n = 6), and Pb+AE (n = 6) groups. The mRNA levels of IL-6, TNF-α,and IL-1β were determined using qPCR and 2−ΔΔCT methods with β-actin as the endogenous reference gene. Independent-samples t-tests were conducted to assess differences between two groups. Data were presented as mean ± SD.* P < 0.05 and ** P < 0.01 vs. the uninfected control mice (Naïve group); # P < 0.05 and ## P < 0.01 vs. the PbA-infectedECM mice (Pb group). & P < 0.05 and && P < 0.01 vs. the RE-treated ECM mice (Pb+RE group). NS = non-significant,P > 0.05, relative to Naïve mice.
Fig. 6
Fig. 6
Effects of RE and AE on the changes in number of Nissl-stained cells in the ECM mice. A Representative Nissl-stained micrographs of cerebral cortex (left) and thalamus (right) in uninfected mice from the Naïve, RE, and AE groups, and ECM mice from the Pb, Pb+RE, and Pb+AE groups using a Leica DM2500B microscope at ×400 magnification. Square insets show Nissl-stained cells at a higher magnification (×1000). B, C Quantification of intact Nissl+ cells in cerebral cortex (B) and thalamus (C) were analyzed from mice in six groups by counting 20 non-overlapping fields/section (n = 6 mice/group). Independent-samples t-tests were conducted to assess differences between two groups. Data are presented as mean ± SD. *P < 0.05 and **P < 0.01 vs. the uninfected control mice (Naïve group); #P < 0.05 and ##P < 0.01 vs. the PbA-infected ECM mice (Pb group). &P < 0.05 and &&P < 0.01 vs. the RE-treated ECM mice (Pb+RE group). NS: non-significant, P > 0.05, relative to Naïve mice
Fig.7
Fig.7
Effects of RE and AE on the changes in number of FJB-stained neurons in the ECM mice. (A) Representative fluorescent micrographs of FJB-stained neurons of cerebral cortex (Left) and thalamus (Right) at uninfected mice from Naïve, RE, and AE groups, and ECM mice from Pb, Pb+RE, and Pb+AE groups. Positive dual FJB+-DAPI+ stained cells were illustrated by green fluorescence (arrows) and captured by a Zeiss LSM780 confocal microscope at 400 × magnification. (B) Quantification of intact FJB+ cells in cerebral cortex (Left) and thalamus (Right) were analyzed from mice at six groups by accounting 20 non-overlapping fields/section (n = 6 mice/group). Independent-samples t-tests were conducted to assess differences between two groups. Data were presented as mean± SD. *P < 0.05 and **P < 0.01 vs the uninfected control mice (Naïve group); #P < 0.05 and ##P < 0.01 vs. the PbA-infected ECM mice (Pb group). &P <0.05 and &&P < 0.01 vs. the RE-treated ECM mice (Pb+RE group). NS = non-significant,P > 0.05, relative to Naïvemice
Fig. 8
Fig. 8
Effects of RE and AE on the changes in number of dual immunofluorescence staining TUNEL+-NeuN+ neurons in the ECM mice. A Representative dual immunofluorescence micrographs of TUNEL+-NeuN+ neurons in the cerebral cortex (left) and thalamus (right) in uninfected mice from Naïve, RE, and AE groups, and ECM mice from Pb, Pb+RE, and Pb+AE groups. Positive dual TUNEL+-NeuN+ stained cells were illustrated by yellow fluorescence and captured by a Zeiss LSM780 confocal microscope at ×400 magnification. B Quantification of TUNEL+-NeuN+ neurons in cerebral cortex and thalamus was analyzed from mice in six groups by counting 20 non-overlapping fields/section (n = 6 mice/group). Independent-samples t-tests were conducted to assess differences between two groups. Data are presented as mean ± SD. *P < 0.05 and **P < 0.01 vs. the uninfected control mice (Naïve group); #P < 0.05 and ##P < 0.01 vs. the PbA-infected ECM mice (Pb group). &P < 0.05 and &&P < 0.01 vs. the RE-treated ECM mice (Pb+RE group). NS: non-significant, P > 0.05, relative to Naïve mice
Fig. 9
Fig. 9
Effects of RE and AE on the changes in number of dual immunofluorescence NeuN+-GRP78+ neurons in the ECM mice. A Representative dual immunofluorescence micrographs of NeuN+-GRP78+ neurons in the cerebral cortex (left) and thalamus (right) in uninfected mice from Naïve, RE, and AE groups, and ECM mice from Pb, Pb+RE, and Pb+AE groups. Positive dual TUNEL+-NeuN+ stained cells were illustrated by yellow fluorescence and captured by a Zeiss LSM780 confocal microscope at ×400 magnification. B Quantification of NeuN+-GRP78+ neurons in cerebral cortex and thalamus was analyzed from mice in six groups by counting 20 non-overlapping fields/section (n = 6 mice/group). Independent-samples t-tests were conducted to assess differences between two groups. Data are presented as mean ± SD. *P < 0.05 and **P < 0.01 vs. the uninfected control mice (Naïve group); #P < 0.05 and ##P < 0.01 vs. the PbA-infected ECM mice (Pb group). &P < 0.05 and &&P < 0.01 vs. the RE-treated ECM mice (Pb+RE group). NS: non-significant, P > 0.05, relative to Naïve mice
Fig. 10
Fig. 10
Effects of RE and AE on the changes in number of dual immunofluorescence NeuN+-CHOP+ neurons in the ECM mice. A Representative dual immunofluorescence micrographs of NeuN+-CHOP+ neurons in the cerebral cortex (left) and thalamus (right) in uninfected mice from Naïve, RE, and AE groups, and ECM mice from Pb, Pb+RE, and Pb+AE groups. Positive dual TUNEL+-NeuN+ stained cells were illustrated by yellow fluorescence and captured by a Zeiss LSM780 confocal microscope at ×400 magnification. B Quantification of NeuN+-CHOP+ neurons in cerebral cortex and thalamus was analyzed from mice in six groups by counting 20 non-overlapping fields/section (n = 6 mice/group). Independent-samples t-tests were conducted to assess differences between two groups. Data are presented as mean ± SD. *P < 0.05 and **P < 0.01 vs. the uninfected control mice (Naïve group); #P < 0.05 and ##P < 0.01 vs. the PbA-infected ECM mice (Pb group). &P < 0.05 and &&P < 0.01 vs. the RE-treated ECM mice (Pb+RE group). NS: non-significant, P > 0.05, relative to Naïve mice
Fig. 11
Fig. 11
Effects of RE and AE on the changes in number of dual immunofluorescence NeuN+-p-IRE1+ neurons in the ECM mice. A Representative dual immunofluorescence micrographs of NeuN+-p-IRE1+ neurons in the cerebral cortex (left) and thalamus (right) in uninfected mice from Naïve, RE, and AE groups, and ECM mice from Pb, Pb+RE, and Pb+AE groups. Positive dual TUNEL+-NeuN+ stained cells were illustrated by yellow fluorescence and captured by a Zeiss LSM780 confocal microscope at ×400 magnification. B Quantification of NeuN+-p-IRE1+ neurons in cerebral cortex and thalamus was analyzed from mice in six groups by counting 20 non-overlapping fields/section (n = 6 mice/group). Independent-samples t-tests were conducted to assess differences between two groups. Data are presented as mean ± SD. *P < 0.05 and **P < 0.01 vs. the uninfected control mice (Naïve group); #P < 0.05 and ##P < 0.01 vs. the PbA-infected ECM mice (Pb group). &P < 0.05 and &&P < 0.01 vs. the RE-treated ECM mice (Pb+RE group). NS: non-significant, P > 0.05, relative to Naïve mice
Fig. 12
Fig. 12
Effects of RE and AE on the changes in number of dual immunofluorescence NeuN+-XBP-1s+ neurons in the cerebral cortex of the ECM mice. A Representative dual immunofluorescence micrographs of NeuN+-XBP-1s+ neurons in the cerebral cortex (left) and thalamus (right) in uninfected mice from Naïve, RE, and AE groups, and ECM mice from Pb, Pb+RE, and Pb+AE groups. Positive dual TUNEL+-NeuN+ stained cells were illustrated by yellow fluorescence and captured by a Zeiss LSM780 confocal microscope at ×400 magnification. B Quantification of NeuN+-XBP-1s+ neurons in cerebral cortex and thalamus was analyzed from mice in six groups by counting 20 non-overlapping fields/section (n = 6 mice/group). Independent-samples t-tests were conducted to assess differences between two groups. Data are presented as mean ± SD. *P < 0.05 and **P < 0.01 vs. the uninfected control mice (Naïve group); #P < 0.05 and ##P < 0.01 vs. the PbA-infected ECM mice (Pb group). &P < 0.05 and &&P < 0.01 vs. the RE-treated ECM mice (Pb+RE group). NS: non-significant, P > 0.05, relative to Naïve mice
Fig. 13
Fig. 13
Effects of RE and AE on the changes in mRNA levels of ER stress-related factors (GRP78, CHOP, and XBP-1s) in the iRBC-stimulated neuronal HT-22 cells in vitro. The neuronal HT-22 cells were co-cultured with 5.0 × 106 iRBCs for 6 h, followed by the addition of 100 μl ice-cold PBS buffer without or with RE (100 µg/ml) and AE (100 µg/ml) for 24 h and 48 h, respectively. The mRNA levels of target genes (GRP78, CHOP, and XBP-1s) were calculated using SYBR Green qPCR Master Mix and analyzed using the 2−ΔΔCT method with β-actin as the endogenous reference gene. *P < 0.05 and **P < 0.01 vs. the Naive group for 24 h; #P < 0.05 and ##P < 0.01 vs. the iRBC-stimulated HT-22 cell group at 24 h; &P < 0.05 and &&P < 0.01 vs. the iRBC-stimulated HT-22 cells targeted with RE treatment at 24 h; $P < 0.05 and $$P < 0.01 vs. the Naive group for 48 h; @P < 0.05 and @@P < 0.01 vs. the iRBC-stimulated HT-22 cell group at 48 h; P < 0.05 and ※※P < 0.01 vs. the iRBC-stimulated HT-22 cells targeted with RE treatment at 48 h; All data were taken from four independent experiments, presented as mean ± SD, and analyzed using independent-samples t-tests between two groups

Similar articles

References

    1. WHO. World malaria report 2023. Geneva: World Health Organization; 2023.
    1. Datta D, Conroy A, Castelluccio P, Ssenkusu J, Park G, Opoka R, et al. Elevated cerebrospinal fluid tau protein concentrations on admission are associated with long-term neurologic and cognitive impairment in Ugandan children with cerebral malaria. Clin Infect Dis. 2020;70:1161–8. - PMC - PubMed
    1. Hadjilaou A, Brandi J, Riehn M, Friese MA, Jacobs T. Pathogenetic mechanisms and treatment targets in cerebral malaria. Nat Rev Neurol. 2023;19:688–709. - PubMed
    1. Trivedi S, Chakravarty A. Neurological complications of malaria. Curr Neurol Neurosci Rep. 2022;22:499–513. - PMC - PubMed
    1. Schiess N, Villabona-Rueda A, Cottier KE, Huether K, Chipeta J, Stins MF. Pathophysiology and neurologic sequelae of cerebral malaria. Malar J. 2020;19:266. - PMC - PubMed

MeSH terms

LinkOut - more resources