. 2025 Jun 20;53(12):gkaf621.
doi: 10.1093/nar/gkaf621.

Loss of DHX36/G4R1, a G4 resolvase, drives genome instability and regulates innate immune gene expression in cancer cells

Affiliations

Loss of DHX36/G4R1, a G4 resolvase, drives genome instability and regulates innate immune gene expression in cancer cells

Anna R Bartosik et al. Nucleic Acids Res. .

Abstract

G-quadruplexes (G4s) are four-stranded alternative secondary structures formed by guanine-rich nucleic acids and are prevalent across the human genome. G4s are enzymatically resolved by specialized helicases. Previous in vitro studies showed that DEAH-box helicase 36 (DHX36/G4R1/RHAU) has the highest specificity and affinity for G4 structures. Here, by mapping genome-wide DNA double-strand breaks (DSBs), we demonstrate that knockout of DHX36 helicase increases DSB enrichment at G4 sites and that the presence of the G4 motif is a significant mediator of genome instability at regulatory regions. The loss of DHX36 corresponds with the significant upregulation of NF-κB transcriptional programs, culminating in the production and secretion of proinflammatory cytokines. Loss of DHX36 expression results in the accumulation of cytoplasmic DNA fragments, an increase in the innate immune signaling stimulator of interferon response cGAMP interactor 1 (STING1) expression, and activation of genes involved in immune response pathways. Importantly, higher levels of DHX36 messenger RNA expression in human B-cell acute lymphoblastic leukemia correlate with improved overall survival relative to lower expression of DHX36, highlighting its critical role in preserving genome integrity at a cellular level and in the context of cancer.


Conflict of interest statement

None declared.

Figures

Graphical Abstract
Graphical Abstract
Figure 1.
Figure 1.
Depletion of DHX36 helicase results in an increased level of DSBs. (A) Venn diagram shows overlap among DNA DSB cluster sites in Jurkat WT, KO1, and KO2 cells. The total numbers of break cluster sites in each sample are shown. (B) Mean coverage of DSBs at merged break cluster sites (n = 33 304) is shown. (C) The DSB coverage at the merged break cluster sites and randomly shuffled control sites (n = 33 304) shows that the WT exhibited a high level of DSBs (compared to the randomly shuffled regions), and the DSBs were further increased upon loss of DHX36 helicase (**P< .01, ***P < .001, ****P ∼ 0, Wilcoxon signed-rank test). Box denotes 25th and 75th percentiles, the middle bar shows the median, and whiskers span from 5% to 95%. (D) Heatmaps demonstrate DSB coverage at the break cluster sites ordered by the DSB coverage of the WT. RPKM = reads per million per kilobase. (E) Break cluster sites (n = 33 304) mapped in WT and KO cells are preferentially enriched at TSSs (number of peaks assigned to each feature is shown). Genome annotations definitions: P = promoter, TSS = transcription start site, GB = gene body, TTS = transcription termination site, and IG = intergenic region.
Figure 2.
Figure 2.
DSB enrichment at the G4 consensus sites upon loss of DHX36 helicase. G4 consensus sites (n = 4880) are shared across different cell types and were detected in vivo by the structure-specific antibody BG4. (A) Venn diagram shows overlap between identified break cluster sites and G4 consensus sites. (B) DHX36 KO cells have significantly more DSBs mapped at G4 consensus sites, compared to the WT (****P ∼ 0, Wilcoxon signed-rank test). Break coverage at the randomly shuffled control G4 regions (n = 4880) was not statistically significant between the WT and KO cells (ns, Wilcoxon signed-rank test). (C) Heatmaps demonstrate DSB coverage over G4 consensus sites ordered by the DSB coverage of the WT. (D) G4 consensus sites are preferentially located at TSSs (number of peaks assigned to each feature is shown; P = promoter, GB = gene body, TTS = transcription termination site, IG = intergenic). (E) Boxplot shows quantification of break coverage at break cluster sites that contain G4 motif (G4+, n = 6834) and the rest of the sites (G4−, n = 26 470) (****P ∼ 0, Wilcoxon signed-rank test). (F) Mapped G4 motifs present in break cluster sites (n = 9013) showed significant enrichment in DSBs at the C-rich strand, compared to the G4 strand, and this enrichment is further exacerbated by DHX36 loss (***P < .001, ****P ∼ 0, Kruskal–Wallis, post-hoc Dunn’s test). RPKM = reads per kilobase per million. Box denotes 25th and 75th percentiles, middle bar shows the median, and whiskers span from 5% to 95%.
Figure 3.
Figure 3.
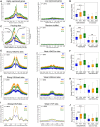
Enrichment of DSBs at transcription regulatory regions. (A) Cumulative, read-normalized, single-nucleotide resolution profiles of DSBs at highly expressed genes (top 10%, n = 2548, left) and at low-expressed genes (bottom 10%, n = 2543, right) in WT and DHX36 KO cells. Expression profile is based on the RNA-seq data from WT (n = 3). (B) Boxplot shows quantification of break coverage at ± 250 bp of TSSs of highly and lowly expressed genes (****P ∼ 0, Wilcoxon signed-rank test). (C) DSB profiles at RNA Pol II pausing sites (n = 7941, left) in WT and DHX36 KO cells and DNA secondary structure free energy folding (ΔG, kcal/mol). Cumulative DSB coverage at randomly shuffled RNA Pol II pausing sites (n = 7941, right). (D) Boxplot shows a significant enrichment of DSBs at RNA Pol II pause sites upon loss of DHX36 compared to WT (****P ∼ 0, ns = not significant, Wilcoxon signed-rank test). For boxplot break coverage regions spanning +300 bp and −100 bp from RNA Pol II pause site summits were used. (E) DSB profiles at strong H3K27ac sites (top 10%, n = 5947, left) and at weak H3K27ac sites (bottom 10%, n = 5947, right) in WT and DHX36 KO cells. (F) Boxplot shows quantification of break coverage at ± 500 bp of H3K27ac ChIP-seq summits (****P ∼ 0, Wilcoxon signed-rank test). (G) DSB profiles at strong H3K4me3 sites (top 10%, n = 2845, left) and at weak H3K4me3 sites (bottom 10%, n = 2845, right) in WT and DHX36 KO cells. (H) Boxplot shows quantification of break coverage at ± 500 bp of H3K4me3 ChIP-seq peaks (****P ∼ 0, Wilcoxon signed-rank test). (I) DSB profiles at strong CTCF-binding sites (top 10%, n = 6820, left) and at weak CTCF-binding sites (bottom 10%, n = 6820, right) in WT and DHX36 KO cell lines. (J) Boxplot shows quantification of break coverage at ± 150 bp of CTCF ChIP-seq peaks (****P ∼ 0, Wilcoxon signed-rank test).
Figure 4.
Figure 4.
Genome instability at G4-containing sites upon loss of DHX36 is dependent on functional activity of the sites. Boxplot shows quantification of break coverage at (A) TSSs ± 250 bp that contain a canonical G4 motif (G4+, n = 8628) and the remaining TSSs (G4−, n = 14 282); (B) H3K27ac sites that contain a canonical G4 motif (G4+, n = 15 352) and the rest of the sites (G4−, n = 44 121); (C) H3K4me3 sites that contain a canonical G4 motif (G4+, n = 12 216) and the rest of the sites (G4−, n = 16 236); and (D) CTCF-binding sites that contain a canonical G4 motif (G4+, n = 7106) and the rest of the sites (G4−, n = 61 097) (****P ∼ 0, Wilcoxon signed-rank test). (E) Break coverage at G4+ TSS sites binned by the gene expression in WT showed a transcription-dependent genome instability. Break coverage at G4+ H3K27ac (F), H3K4me3 (G), and CTCF-binding (H) sites binned by the respective macs2 significance score shows a correlation between DSB levels and the abundance of histone marks or CTCF binding strength (***P < .001, Kruskal–Wallis, post-hoc Dunn’s test). The strongest regulatory elements showed the highest levels of DSBs, particularly in DHX36 KO cells. RPKM = reads per kilobase per million. Box denotes 25th and 75th percentiles, middle bar shows the median, and whiskers span from 5% to 95%.
Figure 5.
Figure 5.
Depletion of DHX36 leads to the activation of genes involved in immune response in T-lymphoblastoid cells. (A) The gene expression difference between DHX36 KO1 versus WT and DHX36 KO2 versus WT showed a strong correlation (Pearson’s correlation r = 0.75, p ≅ 0). (B) Significantly upregulated genes in DHX36 KO1 (n = 686 total) and DHX36 KO2 (n = 583 total) show a large overlap, n = 423. (C) Expression profile shows the 401 genes in Module M2 that are upregulated in the DHX36 KO cells compared to the WT. (D) Genes in Module M2 show significant enrichment of immune cell activation-related biological processes. (E) Genes in M2 are enriched for targets of RelB and NOTCH1.
Figure 6.
Figure 6.
Loss of DHX36 leads to the activation of the NF-κB signaling pathway. (A) Western blot of p65 presence in the cytoplasm and nucleus shows that p65 is translocated to the nucleus upon loss of DHX36. Treatment of the WT cells with TNFα, known as NF-κB activator, was used as the positive control. (B) In DHX36 KO cells, the p65 level in the nucleus is significantly higher compared to WT cells (*P < .05, ***P < .001, Student’s t-test). (C) Differentially expressed genes upon DHX36 knock-out are enriched for the NF-κB target genes (n = 2141, 76%). (D) At the mRNA level, loss of DHX36 leads to a statistically significant upregulation of NF-κB target genes involved in activation of immune response, such as B2M,IL16,IL32, andTNFSF10 (*P < .05, **P < .01, Student’s t-test). (E) Luminex assay of supernatant-secreted cytokines shows that CCL1/I-309 and IL-16, two potent pro-inflammatory ligands, were produced and secreted in higher amounts in DHX36 KO cells compared to the WT. Two independent biological replicates were shown. (F) Immunofluorescence images of cytoplasmic dsDNA accumulation in Jurkat DHX36 KO2 cells, relative to WT cells. Cells were stained using DAPI and an anti-dsDNA antibody. Scale bar, 10 μm. (G) Significantly higher level of STING protein upon loss of DHX36 (FC = fold change, *P < .05, **P < .01, Student’s t-test, n = 3 each); protein level was normalized to the loading control and the WT signal. (H) At the mRNA level, loss of DHX36 leads to the upregulation of the STING1 gene as shown by RT-qPCR (**P < .01, Student’s t-test, n = 3 each).
Figure 7.
Figure 7.
Better outcomes for B-ALL patients with high expression of DHX36. (A) Low expression of DHX36 correlates with high expression of STING1 in B-ALL patients (**P < .01, Wilcoxon signed-rank test). (B) Lower DHX36 expression leads to worse survival in pediatric B-ALL based on a KM test (***P < .001, log-rank test). This difference remains significant in a Cox proportional hazards model after accounting for age at diagnosis and gender, which are known to affect survival in B-ALL. (C) Higher DHX36 expression correlates with higher NKT cell enrichment (**P < .01, Wilcoxon signed-rank test). (D) ALL patients with low DHX36 expression exhibit higher GSVA single-sample enrichment scores for genes in the M2 module identified in Fig. 5, which includes genes upregulated in DHX36 knockout Jurkat cells relative to WT and is enriched for targets of RelB and NOTCH1 (****P < .0001, Wilcoxon signed-rank test).

Update of

References

    1. Mendoza O, Bourdoncle A, Boulé J-B et al. G-quadruplexes and helicases. Nucleic Acids Res. 2016; 44:1989–2006. 10.1093/nar/gkw079. - DOI - PMC - PubMed
    1. Carvalho J, Mergny J-L, Salgado GF et al. G-quadruplex, friend or foe: the role of the G-quartet in anticancer strategies. Trends Mol Med. 2020; 26:848–61. 10.1016/j.molmed.2020.05.002. - DOI - PubMed
    1. Varshney D, Spiegel J, Zyner K et al. The regulation and functions of DNA and RNA G-quadruplexes. Nat Rev Mol Cell Biol. 2020; 21:459–74. 10.1038/s41580-020-0236-x. - DOI - PMC - PubMed
    1. Spiegel J, Adhikari S, Balasubramanian S The structure and function of DNA G-quadruplexes. Trends Chem. 2020; 2:123–36. 10.1016/j.trechm.2019.07.002. - DOI - PMC - PubMed
    1. Chambers VS, Marsico G, Boutell JM et al. High-throughput sequencing of DNA G-quadruplex structures in the human genome. Nat Biotechnol. 2015; 33:877–81. 10.1038/nbt.3295. - DOI - PubMed