. 2025 Jun 20;53(12):gkaf521.
doi: 10.1093/nar/gkaf521.

DnaB and DciA: mechanisms of helicase loading and translocation on ssDNA

Affiliations

DnaB and DciA: mechanisms of helicase loading and translocation on ssDNA

Nicholas Gao et al. Nucleic Acids Res. .

Abstract

Replicative helicases are assembled on chromosomes by helicase loaders before the initiation of DNA replication. Here, we investigate the mechanisms employed by the bacterial Vibrio cholerae (Vc) DnaB replicative helicase and the DciA helicase loader. Structural analysis of the ATPγS form of the VcDnaB-ssDNA complex reveals a configuration distinct from that observed with GDP•AlF4. With ATPγS, the amino-terminal domain (NTD) tier, previously found as an open spiral in the GDP•AlF4 complex, adopts a closed planar arrangement. Furthermore, the DnaB subunit at the top of the carboxy-terminal domain (CTD) spiral is displaced by approximately 25 Å between the two forms. We suggest that remodeling the NTD layer between closed planar and open spiral configurations, along with the migration of two distinct CTDs to the top of the DnaB spiral, repeated three times, mediates hand-over-hand translocation. Biochemical analysis indicates that VcDciA utilizes its Lasso domain to interact with DnaB near its Docking-Helix Linker-Helix interface. Up to three copies of VcDciA bind to VcDnaB, suppressing its ATPase activity during loading onto physiological DNA substrates. Our data suggest that DciA loads DnaB onto DNA using the ring-opening mechanism.


Conflict of interest statement

The authors have no financial or non-financial conflicts of interest.

Figures

Graphical Abstract
Graphical Abstract
Figure 1.
Figure 1.
Initiation of DNA Replication in Vibrio cholerae. The primary (A) and secondary chromosomes (B) in Vibrio cholerae initiate replication via related but distinct mechanisms. Multiple copies of the replication initiator protein (OriC-I: VcDnaA; OriC-II: VcRctB) recognize sites on dsDNA (OriC-I: orange, OriC-II: purple) and oligomerize into a protein-DNA ensemble. Assembly of the initiator-origin DNA complex promotes the melting of an A-T-rich segment at the origin, termed the DNA unwinding element (DUE, OriC-I: cyan, OriC-II: green). The melted DUE segment provides the sites for the VcDciA loader to load the VcDnaB replicative helicase.
Figure 2.
Figure 2.
The VcDnaB–ssDNA–ATPγS complex and its interactions with nucleotide and ssDNA. The VcDnaB-ssDNA-ATPγS is drawn in a ribbon representation (A) or a schematic using a design language wherein the NTDs are depicted as a mushroom shape and the CTDs as spheres (B). In panels A and B, ssDNA, colored magenta, is depicted in both cartoon and stick representations. The breach in the CTD layer is between chain A (light orange) and chain B (deep teal); other DnaB subunits are colored in alternating shades of gray. The Docking Helix (DH) and the Linker Helix (LH) are depicted as cylinders and ribbons colored orange and red, respectively. The primary sequence of VcDnaB is depicted as a bar, with the salient domain boundaries indicated. (C) Close-up of the ATP catalytic center at the interface between each pair of DnaB CTDs. ATP is depicted in the stick representation. The six DnaB CTD pairs, depicted here as spheres, are superimposed on the subunit (colored in gray) that harbors the Walker A and B motifs (not indicated). For clarity, only a portion of the superimposed CTD is shown as a ribbon; the gray sphere shows the full extent of the superimposed CTD. Spheres corresponding to the CTDs excluded from the superposition are colored in purple (chain F), cyan (chains B:E), and orange (chain A). The β-hairpin arginine fingers from all six non-superimposed CTDs are shown in the ribbon format. Although excluded from the superposition, the β-hairpin four corresponding to four chains (chains B–E, cyan) superimpose closely. In contrast, chains F (purple) and A (orange) are found ∼3 and ∼19 Å, respectively. (D) Schematic representation of the VcDnaB–ssDNA interface. The DnaB CTDs are represented as spheres, labeled by the chain, and colored in shades of yellow/orange, except for chain A, which is colored gray. The ssDNA is depicted in a cartoon and stick representation, colored purple. Additional details on the VcDnaB–ssDNA complex can be found in Supplementary Figs S7, S11, and Supplementary Table S4.
Figure 3.
Figure 3.
Nucleotide-dependent conformational differences in the VcDnaB–ssDNA–ATPγS and BstGDP•AlF4 complexes. The two complexes are superimposed in all panels, as described in the main text. For clarity, the two entities have been translated with respect to each other, allowing each to be visible. (A) Ribbon representation of both complexes. VcDnaB NTD components chain F and E in the closed planar and triangular configuration are colored in pale cyan. Bst-DnaB NTD components chain A and F in the open spiral configuration are colored in red. VcDnaB chain A is colored orange. 4ESV chain B is colored deep teal. The ssDNA in the Vc and Bst complexes is depicted in both cartoon and stick representations, colored purple and yellow, respectively. All other chains of DnaB are colored in light gray (Vc) and dark gray (Bst). The breaches in the NTD and CTD layers are indicated. Chains corresponding to the N-terminal domain (NTD) and C-terminal domain (CTD) components are labeled. (B) The depiction is identical to that in panel A, except that the NTD and CTD layers are represented using the sphere and mushroom-like shape design language. (C) The exact representation as panel A, except that only the CTD layer is shown. (D) Identical depiction as panel C except that the DnaB CTD layers are depicted as spheres. (E) The exact representation as panel A, except that only the NTD layer is shown. (F) Identical depiction as panel E except that the DnaB NTD layers are depicted using mushroom-like shapes.
Figure 4.
Figure 4.
Although highly conserved, certain DnaB helicase orthologs feature distinct oligomeric states. (A) Deconvolved nMS spectra of replicative helicases from V. cholerae (Vc), E. coli (Ec), and B. subtilis (Bsu) with and without Mg•ATP. Unlike the B. subtilis ortholog, which is monomeric (with or without ATP), V. cholerae and E. coli DnaB are hexamers. Each measurement was performed with a monomeric protein concentration of 10 μM. The BsuDnaC sample refers to the DnaB family helicase in B. subtilis. (B) Close-up of panel A peaks corresponding to the hexameric VcDnaB complex. The average mass difference between adjacent peaks is 444 ± 20 Da; this value more closely matches the mass of ADP (Mass = 427 Da) than ATP (Mass = 507 Da). As such, we suggest that ATP hydrolysis has occurred, resulting in distinct Mg•ADP-occupied states. The numbers in panels A and B refer to the oligomeric state of VcDnaB (A, blue) and of Mg-ADP molecules bound to VcDnaB (B, red). A list of mass assignments of the various nucleotide-bound peaks in panels A and B appears in Supplementary Table S5.
Figure 5.
Figure 5.
Up to three copies of VcDciA bind to isolated hexameric VcDnaB and VcDnaB complexed to replication origin-derived ssDNA. Deconvolved nMS spectra of 10 μM VcDnaB (measured as the monomer) without and with 7 μM full-length VcDciA (A) and in the absence or presence of 3 μM origin-derived ssDNA (O4-Vc-F) (B). The number of VcDciA molecules observed bound to VcDnaB is indicated in blue (A) or red (B). The expected masses include DnaB6 = 311.5 kDa, DciA = 18.4 kDa, and ssDNA = 32.5 kDa. The broad peak (*) is from an unknown low-level protein contaminant introduced during or after buffer exchange for this sample. All samples were exchanged into 10 μM ATP, 500 μM magnesium acetate, 500 mM ammonium acetate, and 0.01% Tween-20 before nMS analysis.
Figure 6.
Figure 6.
The VcDciA loader Binds Tightly to VcDnaB helicase. (A) The primary sequence of VcDciA is arranged as a bar, and the locations of the KH and Lasso domains are indicated. The table summarizes the NiNTA ‘pull-down’ experiments, wherein the green ‘yes’ and red ‘no’ indicate that the pull-down assay was scored to report binding or no binding, respectively (Supplementary Fig. S15). (B) The dissociation constants (KD) between DnaB and DciA were evaluated through single-cycle kinetic analyses via SPR. On and off rates of full-length DnaB at incremental concentrations (3.7, 11.1, 33.3, 100, and 300 nM) were measured by immobilizing cognate C-term His-tagged full-length VcDciA (C; KD = 0.59 nM; Chi2 = 4.33; Rmax= 312.3) on the SPR sensor chip. A schematic of the SPR experiment accompanies the raw (red) and fitted (gray) SPR curves. The experimental data were analyzed as described in the “Materials and methods” section. The same approach was applied to measure KDs for the KH and Lasso constructs (Supplementary Fig. S17). (C) The KD values emerging from the SPR analysis are summarized for the Vc system in tabular form.
Figure 7.
Figure 7.
The full-length DciA loader suppresses VcDnaB’s ATPase activity. (A) ATPase rate of 200 nM wild type (teal) and E259A mutant VcDnaB (orange). The points represent the measured rates; the height of the bar represents the average of the measured points; the vertical bracket visually represents one standard deviation. Each experiment in panel A was performed two times in triplicate. (A) The effect of titrating VcDciA (0–6400 nM, log scale) on the residual ATPase activity of VcDnaB (200 nM) is plotted. For each experiment, the residual activity is the quotient of the ATPase rate of a particular DciA concentration and the rate for 0 nM DciA. The blue points represent seven experiments with different batches of VcDnaB and VcDciA measured in triplicate on various days. The light-orange line represents the non-linear fit of the residual activity points (Sigmoidal, 4PL, X is log (concentration) model in Prism. The dotted lines represent the 95% confidence interval. The fit encompassed 210 points, yielding an R² value of 0.91 and resulting in an IC50 value of 25.56 nM (95% CI, 23.74–26.94 nM). Parallel analysis with the KH domain on four different batches revealed a 16-fold higher IC50 of 442.5 nM (R² = 0.9693; 95% CI: 380.5–520.0 nM). The Lasso domain was not found to inhibit; however, we observed activation of DnaB’s ATPase at very high Lasso concentrations. The inset table summarizes the IC50 results. Control measurements with the E259A VcDnaB Walker B mutant exhibited no ATPase activity (panel B, orange).
Figure 8.
Figure 8.
VcDnaB is loaded onto a physiological DNA bubble substrate by the full-length VcDciA loader. Helicase loading was measured using a DNA substrate that mimics unwound DNA at a replication origin, as is diagrammed in the schematic above. (A) Loading of full-length VcDnaB by full-length VcDciA. Loading is read out by measuring fluorescence (in RFU) over 45 min at 570 nm from a DNA substrate after it had been unwound by DciA-loaded DnaB; loading relieves the quenching to provide a signal. Data were taken by titrating VcDciA-FL (0.11–6400 nM) against VcDnaB (200 nM). Each labeled curve represents the average of six independent measurements taken from different batches of proteins on different days. The lack of loading activity in the curve that omits VcDciA (red curve) implies that DnaB’s self-threading activity has been suppressed with the replication-origin mimicking DNA bubble substrate. The standard deviation of each point is plotted in light gray. (B) Same as Panel A except that VcDnaB is omitted. Envisioned as a control, this measurement teaches that VcDciA appears to have the capacity to unwind bubble DNA on its own. (C) Point-by-point subtraction of the curves in panels A and B estimates the bubble unwinding signal that arises solely from VcDnaB. The downward phase of the 6400 nM DciA curve after 16 min arises from unwinding rate differences between VcDnaB and VcDciA. These data suggest that VcDciA stimulates the loading of VcDnaB by ∼25-fold, within a range of 5–125 RFU. (D) The unwinding data in panel C is converted to a percentage unwound by dividing by the maximum RFU point and plotting the resulting values against VcDciA concentration. Parallel measurements reveal that the isolated VcDciA KH and Lasso domains (Supplementary Fig. S25A and B) exhibit little (less than 5%) to no loading activity.
Figure 9.
Figure 9.
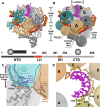
Model for Loading of DnaB by DciA and Translocation of DnaB on ssDNA. (A) The DnaA protein binds to the replication origin and promotes melting into a DNA bubble. (B) The hexameric closed planar DNA-free VcDnaB (PDB: 6T66 [12]) provides a ground-state model for the loading pathway. (C) Our data suggest that up to 3 DciA loaders (red) bind to VcDnaB; we suggest that DnaB adopts an open spiral configuration analogous to that seen with the DnaC/λP complexes [19, 43, 44, 48]. (D) Remodeling of this complex accompanies the entry of DnaA-generated ssDNA into the central chamber of DnaB. The current structures suggest that the D and E conformations are identical [19]. We suggest that DnaB populates the two states captured in the GDP•AlF4 (E) and ATPγS (F) conformations during translocation. The first translocation step (panel F to panel E) involves opening the NTD tier and the migration of a CTD in the ATPγS complex to its position in the GDP•AlF4 complex. The ATPγS-chain F NTD shifts (black arrow) in position to the location of the GDP•AlF4-chain A. Opening of the NTD layer is accompanied by upward migration by 25 Å of the cyan CTD chain A in the ATPγS complex (panel F, red arrow) to the position occupied by chain B in the GDP•AlF4 complex (panel E); this represents the first translocation step. In the second step (panel E to panel F), the GDP•AlF4-NTD layer (chain F) returns (blue arrow) to the ATPγS-closed planar configuration (chain E). This change is accompanied by a 25 Å upward migration of the orange CTD chain A in panel E to a new position (chain F) in panel F (green arrow). Repetition of these two steps around the DnaB enables each subunit to translocate. We suggest that the DciA-loaded DnaB-ssDNA complex, which resembles the GDP•AlF4 conformation, enters this cycle and then transitions to the ATPγS state. The DnaB models in panels B–F are colored in white except for certain blue and orange CTDs and NTDs that line the various breaches, except for the closed planar entity.

Update of

References

    1. Parker MW, Botchan MR, Berger JM Mechanisms and regulation of DNA replication initiation in eukaryotes. FEMS Microbiol Rev. 2017; 52:6804–16. 10.1080/10409238.2016.1274717. - DOI - PMC - PubMed
    1. Burgers PMJ, Kunkel TA Eukaryotic DNA replication fork. Annu Rev Biochem. 2017; 86:417–38. 10.1146/annurev-biochem-061516-044709. - DOI - PMC - PubMed
    1. Costa A, Diffley JFX The initiation of eukaryotic DNA replication. Annu Rev Biochem. 2022; 91:107–31. 10.1146/annurev-biochem-072321-110228. - DOI - PubMed
    1. O’Donnell M, Langston L, Stillman B Principles and concepts of DNA replication in bacteria, archaea, and eukarya. Cold Spring Harb Perspect Biol. 2013; 5:a010108–. - PMC - PubMed
    1. Greci MD, Bell SD Archaeal DNA replication. Annu Rev Microbiol. 2020; 74:65–80. 10.1146/annurev-micro-020518-115443. - DOI - PMC - PubMed

MeSH terms

LinkOut - more resources