. 2025 Jun 20;53(12):gkaf629.
doi: 10.1093/nar/gkaf629.

EBNA leader protein orchestrates chromatin architecture remodeling during Epstein-Barr virus-induced B cell transformation

Affiliations

EBNA leader protein orchestrates chromatin architecture remodeling during Epstein-Barr virus-induced B cell transformation

Davide Maestri et al. Nucleic Acids Res. .

Abstract

Epstein-Barr virus Nuclear Antigen Leader Protein (EBNA-LP) plays a pivotal role in the transformation of B cells by Epstein-Barr virus (EBV), functioning independently of EBNA2 to regulate chromatin architecture and gene expression. Our study reveals that EBNA-LP binds to chromatin regions distinct from EBNA2 and facilitates the formation of long-distance chromatin loops by interacting with the cellular factor YY1. This interaction reconfigures the three-dimensional structure of the host genome, enhancing the integrity of topologically associating domains (TADs) and promoting the interaction between enhancers and promoters within these domains. In EBV-infected B cells, EBNA-LP strengthens YY1-mediated chromatin loops within TADs, which helps maintain stable regulatory programs essential for B cell transformation. Notably, EBNA-LP is crucial for establishing EBV-induced enhancers, yet it is not required for their maintenance once formed. Additionally, our data suggest a compensatory increase in CTCF binding in the absence of EBNA-LP, leading to more promiscuous chromatin interactions between TADs and a reduced TAD insulation at their boundaries. These findings provide new insights into the molecular mechanisms by which EBV reshapes the host genome chromatin architecture to support B cell transformation and highlight potential therapeutic targets for disrupting EBV-driven oncogenesis.


Conflict of interest statement

None declared.

Figures

Graphical Abstract
Graphical Abstract
Figure 1.
Figure 1.
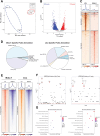
YY1 binding differs between latency types. (A) Principal Component Analysis (PCA) of YY1 ChIP-seq experiments in LCL (blue) and Mutu1 (red) cell lines. (B) Volcano plot of differentially bound regions on the human genome by YY1 between LCL and Mutu1 cell lines. (C) Heatmap showing the regions plotted as a volcano plot in B. (D) Annotation of the differentially bound regions of YY1. (E) Heatmaps showing the binding of YY1 and the active enhancer histone mark H3K27ac in Mutu1 (left) and LCL (right) cell lines. (F) HOMER TF-motif analysis of the differentially bound regions of YY1 in Mutu1 (left) and LCL (right) cell lines. (G) IPA of the differential YY1 peaks in Mutu1 (left) and LCL (right) cell lines.
Figure 2.
Figure 2.
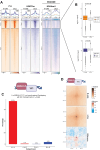
YY1 co-localizes with EBNA-LP and EBNA2 in LCLs. (A) Heatmaps for EBNA-LP (pink), EBNA2 (blue) and YY1 (orange) ChIP-seq experiments. Heatmaps clusters based on the ChIP-seq signal were obtained with deepTools. (B) YY1 signal in Mutu1 and LCL cell lines using the same clusters obtained in A. (C) IPA analysis of the EBNA-LP/YY1 co-bound regions. (D) HOMER motif analysis of the EBNA-LP/EBNA2/YY1 (top) and EBNA-LP/YY1 (bottom) co-bound regions.
Figure 3.
Figure 3.
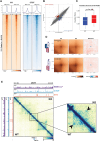
YY1 bridges enhancers and promoters together with EBNA-LP. (A) Pie charts representing the type of YY1-mediated interactions (E-E = enhancer-enhancer interactions, E-P = enhancer-promoter interactions, P-P = promoter-promoter interactions). (B) Pie charts showing the type of interactions listed in A per cluster type listed in Fig. 2A. (C) Average plots showing the ChIP-seq signal of EBNA-LP (purple) and EBNA2 (blue) on YY1 HiChIP interactions in LCLs. Left: representative cluster of EBNA-LP/EBNA2/YY1 interactions with EBNA2 on the left anchor. Middle: representative cluster of EBNA-LP/EBNA2/YY1 interactions with EBNA2 on the right anchor. Right: representative cluster of EBNA-LP/YY1 interactions. (D) UCSC Genome Browser views of EBNA-LP/EBNA2/YY1 interactions (top) and EBNA-LP/YY1 only interactions (bottom). (E) Schematic representation of YY1 HiChIP loops and YY1/EBNA-LP/EBNA2 interactions at loop anchors. Created in BioRender. Tempera, I. (2025) https://BioRender.com/vz4kxsr
Figure 4.
Figure 4.
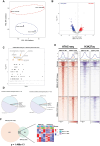
During EBV-driven transformation of B cells YY1-mediated interactions are strengthened and YY1 peaks gain more H3K27ac histone mark. (A) Heatmap showing YY1, H3K27ac and H3K4me1 CUT&RUN and ChIP-seq signals between B cells before EBV infection and after 28 days post infection. Clusters are the same as in Fig. 2A. (B) Boxplots showing the difference in YY1 and H3K27ac CUT&RUN signals and the respective P-value (calculated using Wilcoxon t test). (C) Barplot representing the percentage of EBNA-LP/YY1 co-bound regions overlapping with HiC compartments. HiC compartments were divided in A to A, A to B, B to A, and B to B based on HiC eigenvectors calculated with HOMER. (D) APA plots measuring the contact frequency ± 50Kb from EBNA-LP/YY1 co-bound loops in B cells (top square) and LCLs (middle square).
Figure 5.
Figure 5.
EBNA-LP KO determines global changes in YY1 and CTCF binding and in chromatin architecture. (A) Heatmaps showing YY1 ChIP-seq signal and CTCF CUT&RUN signal on YY1 peaks identified in EBNA-LP WT and KO cell lines. (B) Scatterplot of A/B HiC compartments obtained using HOMER in EBNA-LP WT and KO LCLs. Compartment switching from B to A (red) and A to B (blue) that pass the p-value < 0.05 filter are colored. (C) Boxplot representing the insulation score calculated on CTCF peaks between EBNA-LP WT (blue) and KO (red) cell lines with respective p-value (calculated using Wilcoxon t test). (D) APA plots showing contact frequency of EBNA-LP/EBNA2/YY1 (top) and EBNA-LP/YY1 only (bottom) co-bound regions. (E) HiC Knight-Ruiz-balanced matrices showing differences in contact frequency on chromosome 11 between EBNA-LP WT (bottom half) and KO (top half) LCLs. EBNA-LP (purple), CTCF (light blue) and YY1 (orange) WT (left) and KO (top) signals are plotted.
Figure 6.
Figure 6.
Chromatin accessibility is altered by EBNA-LP KO. (A) PCA analysis of ATAC-seq peaks between EBNA-LP WT (blue) and KO (red) cells. (B) Volcano plot showing differentially accessible regions of the chromatin between EBNA-LP WT and KO cell lines. (C) HOMER motif analysis of the differentially accessible regions. (D) Annotation of the differential ATAC-seq peaks. (E) Heatmaps showing ATAC-seq and H3K27ac ChIP-seq signals on the differential ATAC-seq peaks. (F) Venn diagram showing the overlap between ATAC-seq differential peaks and differentially expressed genes between EBNA-LP WT and KO cell lines. Of the overlapping genes the respective heatmaps showing the normalized read counts of both experiments are shown.
Figure 7.
Figure 7.
A global downregulation of gene expression is determined by EBNA-LP KO. (A) PCA analysis of the RNA-seq experiment between EBNA-LP WT and KO cell lines. (B) Volcano plot showing the differentially expressed genes in the two conditions. The top ten up- and downregulated genes are reported on top of their respective dot. (C) IPA analysis of the differentially expressed genes showing the top five up- and downregulated canonical pathways. (D) Scatterplot showing the up- and downregulated upstream regulators. The top ten for each condition are reported. (E) Average plots showing EBNA-LP (left, red = upregulated, blue = downregulated), YY1 (middle and right, orange = WT, dark orange = KO) ChIP-seq signals on up- and downregulated genes.
Figure 8.
Figure 8.
H3K27ac and RNA Pol II binding change upon B cell infection with an EBNA-LP Ko virus. (A) Heatmaps showing H3K27ac and RNA Pol II ChIP-seq signals in EBNA-LP WT and KO cell lines on YY1 peaks. Clusters are the same as in Fig. 2A. (B) Volcano plot representing differentially H3K27ac-rich regions between EBNA-LP WT and KO LCLs. (C) YY1 ChIP-seq signal on EBNA-LP/YY1-bound genomic regions (cluster 2 of the heatmap in (A)). (D) Violin plots showing H3K27ac (left) and RNA Pol II (right) coverage per replicate for all clusters in (A) with respective p-value (calculated using Wilcoxon t test). (E) UCSC Genome Browser view of one of the top ten downregulated genes, AMOTL1. (F) HOMER motif analysis on the differentially enriched regions for H3K27ac in EBNA-LP WT and KO LCLs. (G) Number of loops that originate from an SE in EBNA-LP WT and KO cell lines. (H) Violin plots representing H3K27ac signal in upregulated (left) and downregulated (right) SEs in EBNA-LP WT and KO cells per replicate. P-values are reported on top of the graphs and calculated using Wilcoxon t test.
Figure 9.
Figure 9.
The absence of EBNA-LP affects also EBV genome architecture and gene expression. (A) YY1 HiChIP iced-normalized matrices for the EBV genome in WT (top half) and KO (bottom half) showing the region of the viral genome between 100 Kb and ∼172 Kb. On the left side and on top of the matrices are represented EBNA2 (blue), EBNA-LP (purple), and YY1 (orange) ChIP-seq tracks. The bottom of the matrices indicated the loops originating from the YY1 ChIP-seq peak on the RPMS1 promoter. The color of the ribbons represents the log2 ratio of read depth normalized counts between EBNA-LP WT and KO LCLs. (B) Volcano plot showing differentially expressed viral genes (blue = downregulated, red = upregulated, grey = unchanged). (C) UCSC Genome Browser view of ATAC-seq (red), CTCF CUT&RUN (light blue), H3K27ac (light purple), RNA Pol II (dark purple), YY1 (orange), EBNA2 (blue), EBNA-LP (purple) ChIP-seq and RNA-seq (bottom four lines), and YY1 HiChIP tracks on the viral genome focused on the RPMS1 gene. (D) Average plots showing RNA Pol II (top) and YY1 (bottom) ChIP-seq signals on the RPMS1 promoter bbewteen EBNA-LP WT and KO cell lines.
Figure 10.
Figure 10.
EBNA-LP is essential in organizing the 3D structure of the genome in EBV-transformed cell lines. Schematic of working model for EBNA-LP KO. The KO of EBNA-LP induces a reduction in YY1 binding and increase in CTCF binding and global changes in transcription, chromatin accessibility and architecture. Created in BioRender. Tempera, I. (2025) https://BioRender.com/vz4kxsr.

Similar articles

References

    1. Cohen JI, Fauci AS, Varmus H et al. Epstein-Barr Virus: an important vaccine target for cancer prevention. Sci Transl Med. 2011; 3:107fs7. 10.1126/scitranslmed.3002878. - DOI - PMC - PubMed
    1. Price AM, Luftig MA To be or not IIb: a multi-step process for Epstein-Barr Virus latency establishment and consequences for B cell tumorigenesis. PLoS Pathog. 2015; 11:e1004656. 10.1371/journal.ppat.1004656. - DOI - PMC - PubMed
    1. Morgan SM, Tanizawa H, Caruso LB et al. The three-dimensional structure of Epstein-Barr virus genome varies by latency type and is regulated by PARP1 enzymatic activity. Nat Commun. 2022; 13:187. 10.1038/s41467-021-27894-1. - DOI - PMC - PubMed
    1. Maestri D, Napoletani G, Kossenkov A et al. The three-dimensional structure of the EBV genome plays a crucial role in regulating viral gene expression in EBVaGC. Nucleic Acids Res. 2023; 51:12092–110. 10.1093/nar/gkad936. - DOI - PMC - PubMed
    1. Caruso LB, Maestri D, Tempera I Three-dimensional chromatin structure of the EBV genome: a crucial factor in viral infection. Viruses. 2023; 15:1088. 10.3390/v15051088. - DOI - PMC - PubMed

MeSH terms

LinkOut - more resources