. 2025 Dec;17(1):2526134.
doi: 10.1080/19490976.2025.2526134. Epub 2025 Jul 2.

The accessory type III secretion system effectors collectively shape intestinal inflammatory infection outcomes

Affiliations

The accessory type III secretion system effectors collectively shape intestinal inflammatory infection outcomes

Priyanka Biswas et al. Gut Microbes. 2025 Dec.

Abstract

Injection of effectors via a type III secretion system (T3SS) is an infection strategy shared by various Gram-negative bacterial pathogens, many infecting mucosal surfaces. While individual T3SS effectors are well characterized, their network-level organization and the distinction between core and accessory effectors remain incompletely understood. Here, by systematically dissecting the T3SS effector network of the enteric mouse pathogen Citrobacter rodentium (CR) we identified a subset of 12 accessory effectors that, while dispensable for colonization, significantly alter infection outcomes. A strain lacking the accessory effectors (CRM12) remained virulent in susceptible mouse hosts yet resulted in reduced epithelial barrier damage, inflammation, and immune cell infiltration in resistant mice. Deep proteomic analysis specifically targeting CR-attached colonic epithelial cells revealed that, despite lacking 39% of its effector repertoire, infection with CRM12 results in similar changes to global protein expression as seen in mice infected with the wild-type strain, though key regulators of barrier integrity were differentially expressed. Using a host with impaired barrier repair (Il22- /- mice), we confirmed that accessory effectors collectively shape infection outcomes without significantly impacting virulence. This study refines the concept of core and accessory effectors, providing a basis for further studies into effector-driven host adaptation.

Keywords: Citrobacter rodentium; Type III secretion system effectors; barrier disruption; gut infection; mucosal immune responses.


Conflict of interest statement

No potential conflict of interest was reported by the author(s).

Figures

Figure 1.
Figure 1.
Generation of minimal effector networks. (a) a schematic illustrating construction of the effector networks using sequential effector deletion. (b) a schematic depicting infection of C57BL/6 mice with CRWT or isogenic mutants. At 8 dpi, infection outcomes were assessed by quantification of CFUs/gof, fecal LCN2 and CCH. (c) CFUs/GoF of the CRi17 and CRP20 intermediates. Results show median from biological replicates (n ≥ 4 mice per group). (d and e) pictorial representations of the effectors deleted in each round of sequential deletion; gray boxes represent CRi9, white and black boxes represent that network mutant shedding above or below the threshold, respectively. (f) Temporal fecal bacterial shedding in mice infected with CRWT, CRP20, and CRi17. Lines represent the mean bacterial load with each point representing geometric mean ± geometric S.D. from biological replicates (N ≥ 2). (g) Fecal CRWT shedding 8 days after reinfection of mice pre-infected with CRWT, CRi17 or CRP20. Shown are geometric mean of biological replicates (N ≥ 2). Each data point represents a single mouse. In c, f, and g, limit of detection (LoD) and the colonization threshold are indicated by dotted black lines. For c, statistical significance was determined by nonparametric Kruskal-Wallis test. For F, area under curve was calculated, and statistical significance was determined by one-way ANOVA with Tukey’s multiple comparison test. For g, statistical significance was determined by one-way ANOVA with Tukey’s multiple comparison test. *p < 0.05; **p < 0.01; ***p < 0.001; ****p < 0.0001; ns, not significant. Refer to Table S2 for the exact number of mice used for experimental groups.
Figure 2.
Figure 2.
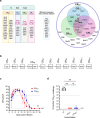
Identification of the accessory effectors. (a) Table (left) and Venn diagram (right) representing effectors present in the CRWT, CR14, CRP20, and CRi17 networks. The essential effectors are shown at the top of the table and center of the Venn diagram. The common effectors EspF, NleG8 and EspM2 are shown in pink. Effectors missing from CR14, CRP20, and CRi17 networks are listed in the light blue box. (b) Pictorial representation of the rounds of sequential deletion toward the generation of CRM12. (c) Temporal fecal bacterial shedding of mice infected with CRWT or CRM12. Lines represent the mean bacterial load with each point representing geometric mean ± geometric S.D. from biological replicates (N = 3). (d) Fecal CRWT shedding 8 days after reinfection of mice pre-infected with CRWT or CRM12. Shown are geometric mean of biological replicates (N ≥ 2). Each data point represents a single mouse. In C and D, LoD and the colonization threshold are indicated by dotted black lines. For C, area under curve was calculated, and statistical significance was determined by two-tailed unpaired t-test. For D, statistical significance was determined by one-way ANOVA with Tukey’s multiple comparison test. **p < 0.01; ns, not significant. Refer to Table S2 for the exact number of mice used for experimental groups.
Figure 3.
Figure 3.
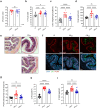
CRM12 is virulent in C3H/HeN mice. C3H/HeN mice were infected with either CRWT or CRM12. (a) Temporal weight loss of mice infected with the indicated strains and UI control and (b) Probability of survival. Data represents mean ± SEM from biological replicates (N = 3). (c) Temporal fecal bacterial shedding. Results show geometric mean ± geometric S.D. from biological replicates (N ≥ 3). The colonization threshold and LoD CFUs/GoF are indicated by dotted lines. (d) Fecal water content at 8 dpi (N = 3). (e) Representative images of distal colons from mice harvested at humane endpoint and UI controls (N ≥ 2). (f) Colon length. (g) Colon weight-to-length ratio. (H) Representative hematoxylin and eosin (H&E)-stained colon sections, and (I) crypt-length measurements (scale bars, 200 μm). For d, f, g and i, each data point represents a single mouse, and results show mean ± S.D. from biological replicates (N ≥ 2). For A and C, area under curve was calculated, and statistical significance was determined by one-way ANOVA with Tukey’s multiple comparison test (for a) two-tailed unpaired t-test (for c). Statistical significance was determined by log-rank (Mantel-Cox) test (for B); and by one-way ANOVA with Tukey’s multiple comparison test (for d, f, g and i). *p < 0.05; **p < 0.01; ***p < 0.001; ****p < 0.0001; ns, not significant. Refer to Table S2 for the exact number of mice used for experimental groups.
Figure 4.
Figure 4.
CRM12 induces mild tissue damage in C57BL/6 mice. C57BL/6 mice infected with CRWT or CRM12, and UI controls, were harvested at 8 dpi. (a) Tissue-associated CR (CFUs/cm colon). Results show geometric mean ± geometric S.D. from biological replicates (N = 4). LoD is indicated by dotted black line. (b) Fecal water content. (c) colon weight-to-length ratio. (d) Crypt length measurements and (E) representative H&E-stained colon sections (scale bars, 200 μm) (N = 4). In d, each dot represents the mean per mouse. (f) Representative immunostaining images of colonic sections, and (g) quantification of PCNA staining as a percentage of total crypt length (N = 4). Each dot represents the mean per mouse; CR (green), DAPI (blue), PCNA (red) (scale bars, 100 μm). Fecal (H) LCN2 and (I) S100A8 levels. For a-d, g-i, each data point represents a single mouse, and results show mean ± S.D. from biological replicates (N = 4). Statistical significance was determined by a two-tailed unpaired t-test for A, and one-way ANOVA with Tukey’s multiple comparison test for b-d, and g-i. *p < 0.05; ***p < 0.001; ****p < 0.0001; ns, not significant. Refer to Table S2 for the exact number of mice used for experimental groups.
Figure 5.
Figure 5.
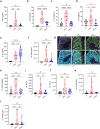
CRM12 triggers lower inflammation in C57BL/6 mice. C57BL/6 mice infected with CRWT, or CRM12, and UI controls were harvested at 8 dpi. Mucosal secretion of (a–e) IFN-γ, IL-22, IL-17A, IL-1β, and IL-18 cytokines in colonic explant cultures. Results show mean ± S.D. from biological replicates (N = 4). Total numbers of (f) neutrophils, (h) macrophages, (i) pDcs, (j) cDcs, (k) monocytes, and (l) iMonocytes per 200 μl of colon homogenate. Results show mean ± S.D. from biological replicates (N = 3). (g) Representative immunostaining images of colonic sections showing neutrophil influx to the colonic mucosa (N = 4). The intestinal epithelial cells express E-cadherin (green) and are DAPI+ (blue), whereas neutrophils are Ly6Ghi (violet) and DAPI+, but E-cadherin (scale bars, 50 μm). The upper panel is a merged image of E-cadherin and Ly6G and the lower panel shows merged images of all three channels (DAPI, E-cadherin, and Ly6G). For A-F, and H-L, each data point represents a single mouse; statistical significance was determined by one-way ANOVA with Tukey’s multiple comparison test. *p < 0.05; **p < 0.01; ***p < 0.001; ****p < 0.0001; ns, not significant. Refer to Table S2 for the exact number of mice used for experimental groups.
Figure 6.
Figure 6.
CRM12 triggers lower epithelial barrier disruption in infected IECs. (a) A schematic illustrating sample preparation leading to proteomics analyses of EpCAM+/CR+ IECs (Bb) PCA of mouse proteins in EpCAM+/CR+ isolated from UI mice and mice infected with CRWT and CRM12 (N = 3). (c) Hierarchical clustering (one minus cosine similarity) of relative abundance of 4197 proteins significantly changing with CRWT and/or CRM12 infection compared to UI. (d) Volcano plot (Log2FC of CRWT vs CRM12) showing significantly (y-axis), and differentially (x-axis) regulated proteins between CRWT and CRM12 infection. (e) Heatmap of selected proteins involved in regulation of barrier integrity. (f) Intestinal permeability was measured at 8 dpi by determining FITC-dextran levels in the serum (N = 4). (g) Representative immunostaining images of colonic sections from N = 4 biological repeats showing epithelial barrier disruption. The intestinal epithelial cells express E-cadherin (green) and are DAPI+ (blue), (scale bars, 100 μm). Panels show E-cadherin and zoomed-in E-cadherin inset, DAPI staining, and merged images of E-cadherin and DAPI, respectively. White arrows indicate erosion of colonic epithelial layer in the E-cadherin staining channel. Extraintestinal dissemination of CRWT or CRM12 to (H) liver, and (I) spleen (N = 2). LoD is indicated by a dotted black line. For F, H and I, each data point represents a single mouse, results show mean ± S.D. from biological replicates. Statistical significance was determined by one-way ANOVA with Tukey’s multiple comparison test for F, and by nonparametric Mann-Whitney test for H and I. **p < 0.01; ***p < 0.001; ns, not significant. Refer to Table S2 for the exact number of mice used for experimental groups.
Figure 7.
Figure 7.
CRM12 infection results in mortality of mice with impaired barrier repair. C57BL/6 Il22-/- mice were infected with either CRWT or CRM12. (a) Temporal weight loss of infected mice and UI control. Data represents mean ± SEM from biological replicates (N = 2). (b) Probability of survival. (c) Temporal fecal bacterial shedding. Results show geometric mean ± geometric S.D. from biological replicates (N = 2). The colonization threshold and LoD are indicated by dotted black lines. (d) Fecal water content at 7 dpi. (e) Representative images of distal colons from mice harvested at humane endpoint and of UI controls (N = 2). (f) Colon length. (g) Colon weight-to-length ratio. (h) Representative H&E-stained colon sections, and (I) crypt-length measurements (scale bars, 200 μm). Each dot represents the mean per mouse. For D, F, G and I, each data point represents a single mouse, and results show mean ± S.D. from biological replicates (N ≥ 2). For a and c, area under curve was calculated, and statistical significance was determined by one-way ANOVA with Tukey’s multiple comparison test (for A) two-tailed unpaired t-test (for c). Statistical significance was determined by log-rank (Mantel-Cox) test (for B); and by one-way ANOVA with Tukey’s multiple comparison test (for D, F, G and I). *p < 0.05; ***p < 0.001; ****p < 0.0001; ns, not significant. Refer to Table S2 for the exact number of mice used for experimental groups.

Similar articles

References

    1. Deng W, Marshall NC, Rowland JL, McCoy JM, Worrall LJ, Santos AS, Strynadka NCJ, Finlay BB.. Assembly, structure, function and regulation of type III secretion systems. Nat Rev Microbiol. 2017;15(6):323–23. doi: 10.1038/nrmicro.2017.20. - DOI - PubMed
    1. Puhar A, Sansonetti PJ.. Type III secretion system. Curr Biol CB. 2014;24(17):R784–R791. doi: 10.1016/j.cub.2014.07.016. - DOI - PubMed
    1. Pinaud L, Sansonetti PJ, Phalipon A. Host cell targeting by enteropathogenic bacteria T3SS effectors. Trends Microbiol. 2018;26(4):266–283. doi: 10.1016/j.tim.2018.01.010. - DOI - PubMed
    1. Jennings E, Thurston TLM, Holden DW. Salmonella SPI-2 type III secretion system effectors: molecular mechanisms and physiological consequences. Cell Host & Microbe. 2017;22(2):217–231. doi: 10.1016/j.chom.2017.07.009. - DOI - PubMed
    1. Johnson R, Mylona E, Frankel G. Typhoidal Salmonella: distinctive virulence factors and pathogenesis. Cellular Microbiol. 2018;20(9):e12939. doi: 10.1111/cmi.12939. - DOI - PubMed

MeSH terms

LinkOut - more resources