[Preprint]. 2025 Apr 26:2025.04.23.650240.
doi: 10.1101/2025.04.23.650240.

Specialized parallel pathways for adaptive control of visual object pursuit

Affiliations

Specialized parallel pathways for adaptive control of visual object pursuit

Matthew F Collie et al. bioRxiv. .

Abstract

To pursue an unpredictably moving visual object, the brain must generate motor commands that continuously steer the object to the midline of the visual field via feedback. Behavior implies that visual pursuit relies on a feedback loop with flexible gain, but the mechanisms of this "adaptive control" are not well-understood. Here we show that adaptive control in the Drosophila pursuit system involves two parallel feedback loops. One serves to steer the object coarsely toward the midline; the properties of this pathway are relatively constant. The other functions to steer the object precisely to the midline, and its properties are flexible: gain increases when the object is moving away from the midline, when the pursuer is running fast, and during arousal. Genetically suppressing this flexible pathway decreases pursuit performance in aroused males. Our findings show how biological feedback systems can implement adaptive control to drive vigorous error correction while avoiding instability.

Keywords: AOTU019; AOTU025; DNa02; direction selectivity; feedback control; gain scheduling; in vivo electrophysiology; object motion; steering.


Conflict of interest statement

Declaration of interests The authors declare no competing interests.

Figures

Figure 1:
Figure 1:. Visual space is divided into overlapping parallel AOTU pathways.
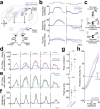
a, Schematic of male (“pursuer”) and female (“leader”) during pursuit. Deviation of the female from the male’s visual midline (0°) defines an angular error signal (θ), which drives a corrective turn to reduce the discrepancy between current output and the setpoint. b, Proposed feedback control model of visual object pursuit in Drosophila. LC10a cells detect a moving visual object and influence steering descending neurons (DNs) largely via AOTU019 and AOTU025. c, Total number of LC10a input synapses and output synapses per identified steering-related DN (averaged across hemispheres), shown for all AOTU cells that both receive input from LC10a and project to DNa02. Relevant DNs included: DNa01,, DNa02,, DNa03, DNa11, DNb02, and DNg13. DNa03 is unusual in that most of its outputs are within the central brain, forming strong connections onto other DNs such as DNa02 (Fig. S1b). AOTU019 and AOTU025 form the strongest LC10a-to-DN pathway. All connectome analyses use FAFB/FlyWire data–,,. d, LC10a cell dendritic arbors in the lobula (LO), color-coded by synapse count onto AOTU019 and AOTU025. Scale bar: 20 μm. e, Visual receptive field estimates of AOTU019 and AOTU025 projected onto LO (top panel) and retinal (bottom panel) coordinates, including 15° binocular overlap,. The LO (yellow optic lobe structure) medial-lateral axis maps onto the retina’s anterior-posterior axis, suggesting AOTU019 is tuned to objects near the midline (anterior) and AOTU025 is tuned to objects more laterally (posterior). f, Schematic of the male fly-on-ball setup showing patch-clamp recording, motion of a visual object across the panoramic display, and P1 activation via CsChrimson. Right: Example recordings from right AOTU019 and AOTU025 during motion pulses at 25 and 75 °/s. Motion stimuli spanned the front 100° for AOTU019 and 180° for AOTU025, with all pulses traversing 22.5° of azimuth. g, Visual responses to repeated motion pulses for AOTU019 (mean ± s.e.m., n = 25 flies) and AOTU025 (n = 22 flies). Cells in the right hemisphere were shown rightward motion pulses, while cells in the left hemisphere were shown leftward motion pulses. Data from the left hemisphere is mirrored and combined with right-hemisphere data for panels (g,h). Response latencies: 39.98 ± 8.46 ms (AOTU019) and 35.88 ± 9.52 ms (AOTU025). h, Average firing rate during each motion pulse presentation, plotted at the center of each sweep position, for AOTU019 (mean ± s.e.m., n = 25 flies) and AOTU025 (n = 22 flies).
Figure 2:
Figure 2:. Steering can arise from asymmetric excitation or inhibition.
a, Frontal schematic of the fly brain (top) and simplified circuit diagram (bottom). AOTU019 and AOTU025 link visual object motion—via LC10a inputs from the LO—to steering-related descending neurons (e.g., DNa02) in premotor regions such as the lateral accessory lobe (LAL). AOTU019 is inhibitory and contralateral, with dendritic compartments (squares) in both the AOTU and LAL. In contrast, AOTU025 is excitatory and ipsilateral, with dendrites restricted to the AOTU. A “cell on the right” refers to a neuron whose soma and dendrites reside on the right hemisphere of the brain. Detailed morphologies of AOTU cells are shown in Fig. S3a. b, Changes in firing rate and behavior (mean ± s.e.m. across flies) caused by positive and negative current injection into AOTU019 (+: n = 15 flies; −: n = 8 flies) and AOTU025 (+: n = 15 flies; −: n = 5 flies). Depolarization drove ipsilateral turning (p < 0.0001 for either cell type), while also increasing forward velocity for AOTU019 (p < 0.005). Hyperpolarization of AOTU019 drove contralateral turning (p < 0.05), with a trend toward reduced forward velocity (p = 0.066). Hyperpolarization of AOTU025 did not significantly affect rotational velocity (p = 0.362), and there was no significant effect on forward velocity for AOTU025 (p = 0.246). Ipsilateral means toward the recorded soma: thus, depolarizing either soma on the right produces rightward turning. c, Schematic of see-saw steering control via AOTU inputs. Steering can result from asymmetric excitation or inhibition: increasing excitation to the right, decreasing excitation to the left, increasing inhibition to the left, or decreasing inhibition to the right. These mechanisms may act alone or in combination. d, Blue: motion pulse responses of AOTU019 cells on the right, minus responses of AOTU019 in the left hemisphere (mean ± s.e.m., n = 23 flies), for objects moving rightward. Magenta: same for AOTU025 (n = 22 flies). Responses were recorded during P1 optostimulation. Data from right and left hemispheres were combined under the assumption of mirror symmetry (see Methods). e, Green: responses of DNa02 on the right, minus responses of DNa02 on the left (mean ± s.e.m., n = 11 flies). Purple: sum of AOTU019 and AOTU025 responses from (c), mean ± s.e.m. with error propagation. f, Turn responses to rightward motion pulses (mean ± s.e.m., n = 40 flies). g, Peak cross-correlation between firing rate and rotational velocity during motion pulse presentation for AOTU019 (n = 13 flies) and AOTU025 (n = 11 flies). Negative lag indicates firing precedes turning. Both cells precede steering, although AOTU025 has a stronger correlation (p < 0.01) and shorter lag (p < 0.01). Horizontal lines indicate medians. h, Mean rotational velocity (± s.e.m.) binned by cell firing rate 200 ms in the past, measured during motion pulse presentation, for AOTU019 (n = 13 flies) and AOTU025 (n = 11 flies). No significant difference was observed between cell types (p = 0.156).
Figure 3:
Figure 3:. Direction selectivity is highest around the frontal visual field.
a, Turn responses to 25 °/s motion pulses moving rightward or leftward in head-closed males (mean ± s.e.m., n = 16 flies). In general, flies turned toward the object’s position (e.g., rightward turns for stimuli on the right), with a notable exception near the midline, where flies instead tended to follow the direction of motion. Turn responses differed significantly depending on both sweep position and motion direction (p < 0.0001, interaction). b, Example visual responses (R-L) to motion pulses at each cell’s preferred object position for leftward sweeps, shown for right AOTU019 (mean ± s.e.m., n=25 flies) and AOTU025 (n=22 flies). Right: Median direction selectivity index (DSI) calculated across sweep positions that evoked measurable visual responses. Positive DSI values indicate a preference for ipsiversive motion. AOTU019 was, on average, significantly more direction selective than AOTU025 for sweeps moving at 25 °/s (p < 0.05). Analyses during stationary epochs shown in Fig. S5. Horizontal lines indicate medians. c, Right-left visual response means (± s.e.m.) to motion pulses moving in the ipsiversive or contraversive direction for AOTU019 (n = 25 flies) and AOTU025 (n = 22 flies). AOTU019 responses showed a significant difference between motion directions (p < 0.05), whereas AOTU025 responses did not (p = 0.6674). Both AOTU019 (p = 0.1903) and AOTU025 (p = 0.0814) showed a trend toward greater direction selectivity at more medial compared to lateral positions, as indicated by the interaction term. d, Dynamic simulation of pursuit steering behavior based on LC10a-predicted receptive fields for AOTU019 and AOTU025. Visual inputs are weighted by output strength onto DNa02 and following a 200 ms delay (Fig. 2g). Right-left difference in DNa02 activity produces the steering command, scaled by gain parameter k(1.2×). The circled “X” indicates where object motion at each time step is compared with steering feedback. For the random object trajectory (simulating female movement), we varied the magnitude (α) of the object’s independent movement. For the step displacement, we varied the size of the initial object displacement (0–130°). e, Example simulations using a random object trajectory (α = 0.7; see Methods), showing that the feedback system drives the object toward the midline (0°). Right: Adding direction selectivity to AOTU019 (0.7 penalty to object motion in the contraversive direction) improves pursuit performance, whereas applying the same manipulation to AOTU025 does not, with performance overlapping with the neither-direction-selective condition. f, Example simulations using a step response. The object was held at 100° for 1 s to reach steady-state (gray shading) before release; “settling time” was defined as the time for the object to remain within a ±2° tolerance band for > 1 s. Right: Adding direction selectivity (0.7) to AOTU019 reduces settling time, whereas applying the same manipulation to AOTU025 does not.
Figure 4:
Figure 4:. Increasing forward velocity increases steering gain.
a, Example of an arousal-stimulated male pursuing a virtual “female” in closed-loop with his own rotational velocity. Green trace indicates behavior classified as pursuit. Triangles indicate ±60° object “jumps,” used to sample a wider range of virtual female positions and to evoke compensatory turns during pursuit. b, Polar histogram showing the distribution of visual object positions during pursuit for low (bottom third) and high (top third) forward velocity epochs (n = 40 flies). Data are shown as probability density (range: 0–0.2). c, Rotational velocity during pursuit, binned by virtual female position in the front field of view (<60°), for low (bottom third) and high (top third) forward velocity epochs (mean ± s.e.m., n = 40 flies). d, Higher forward velocity is associated with significantly greater steering gain, where gain is the fitted slope of the relationship between rotational velocity and object position (n = 40 flies, p < 0.0001). Horizontal lines indicate medians. e, Schematic depicting how the same angular error (θ) will lead to a larger displacement from the male (pursuer) to the female (leader) as forward velocity increases, requiring larger corrective turns at faster speeds. f, Firing rate binned by forward velocity, measured during motion pulse presentation, for AOTU019 (mean ± s.e.m.; n = 25 flies) and AOTU025 (n = 20 flies). Changes in AOTU019 firing were typically synchronous with changes in forward velocity (median ± s.e.m.; −3.00 ± 8.46 ms), whereas most AOTU025 cells lacked a clear cross-correlation lag, reflecting a more binary relationship with movement. Cell types differed significantly (p < 0.05), with spiking varying by velocity in a cell type–specific manner (interaction, p < 0.0001). g, Visual responses to motion pulses at each cell’s preferred object position during low (<median) and high (>median) forward velocity epochs for AOTU019 (mean ± s.e.m., n = 15 flies) and AOTU025 (n = 8 flies). h, Right-left visual response means (± s.e.m.) to motion pulses during low (<median) and high (>median) forward velocity epochs for AOTU019 (n = 15 flies) and AOTU025 (n = 8 flies). Higher forward velocity significantly changes the right-left visual response in AOTU019 (p < 0.01), but not AOTU025 (p = 0.768).
Figure 5:
Figure 5:. Arousal preferentially recruits the pathway for detecting frontal objects.
a, Example recordings from right AOTU019 and AOTU025 before and during arousal stimulation via P1 optogenetic activation, recorded while the fly walked in darkness. b, Change in membrane voltage and firing rate for AOTU019 (n = 31 flies) and AOTU025 (n = 34 flies), measured during stationary epochs, following arousal stimulation via P1 optogenetic activation. AOTU019 showed a significantly larger increase in activity than AOTU025 (p < 0.0001). Note, the 250 ms immediately after activation onset/offset were excluded from analyses. Horizontal lines indicate medians. c, Change in average visual response, measured at each cell’s preferred object position during stationary epochs, for AOTU019 (n = 12 flies) and AOTU025 (n = 11 flies) following arousal stimulation. AOTU019 showed a significantly larger increase in visual response than AOTU025 (p < 0.05). d, Percentage of time spent running before and after arousal stimulation in darkness for AOTU019 (n = 22 flies) and AOTU025 (n = 19 flies). No significant difference between groups (p = 0.971). e, Polar histogram showing the distribution of visual object positions for males pursuing a virtual “female” in closed-loop with their own rotational velocity following arousal stimulation (n = 61 flies). Data are shown as probability density (range: 0–0.1). During arousal, males concentrated the object near the visual midline (0±30°), whereas pre-arousal object positions were more widely distributed. f, Percentage of time male spent pursuing a virtual “female” before and during arousal stimulation (n = 61 flies). P1 stimulation significantly increased pursuit behavior (p < 0.0001).
Figure 6:
Figure 6:. Silencing the frontal pathway impairs object-directed steering during arousal.
a, Percentage of time each male flies spent pursuing a fictive “female” following arousal stimulation for AOTU019>Kir (n = 21 flies), effector control (n = 19 flies), and driver control (n = 21 flies). P1 stimulation significantly increased pursuit behavior within each genotype (p < 0.0001, Bonferroni-corrected); genotype had no significant effect (p = 0.99998). Horizontal lines indicate medians. b, Rotational velocity binned by virtual female position in the front field of view (<60°) during pursuit for AOTU019>Kir (n = 21 flies), effector control (n = 19 flies), and driver control (n = 21 flies) flies (mean ± s.e.m.). Magnified view of responses near the midline shows a consistent reduction in steering towards the female for AOTU019>Kir flies. c, Slope distributions from the front field reveal a significant reduction in steering gain with AOTU019 silencing (p < 0.05, p < 0.01). d, Simulation summary, for AOTU019 either included or removed, showing rotational velocity binned by object position. Minor LC10a-to-DNa02 visual-motor pathways included (Fig. 1c, Fig. S7). Removing AOTU019 reduces steering toward the object. f, Distribution of average forward velocity during pursuit for AOTU019>Kir (n = 21 flies), effector control (n = 19 flies), and driver control (n = 21 flies) flies, revealing no significant difference across genotypes (p = 0.477). e, Change in forward velocity binned by object position during open-loop pursuit of an oscillatory stimulus in AOTU019>Kir (n = 21), effector control (n = 19), and driver control (n = 21) flies (mean ± s.e.m.). Change measured from each fly’s baseline speed. While the main effect of genotype was not significant (p = 0.4331), a significant interaction with object position (p <0.0001) suggests that AOTU019 contributes to forward speed modulation near the visual midline. f, Feedback control model of visual object pursuit in Drosophila, including adaptive control elements—enhanced direction selectivity, sensitivity to forward velocity, and arousal-dependent recruitment—implemented by the midline error correction pathway AOTU019.

References

    1. Shadmehr R., and Mussa-Ivaldi S. (2012). Biological learning and control (MIT Press; ).
    1. Barnes G.R. (2008). Cognitive processes involved in smooth pursuit eye movements. Brain and Cognition 68, 309–326. - PubMed
    1. Becker W., and Fuchs A.F. (1985). Prediction in the oculomotor system: smooth pursuit during transient disappearance of a visual target. Exp. Brain Res. 57, 562–575. - PubMed
    1. Luebke A.E., and Robinson D.A. (1988). Transition dynamics between pursuit and fixation suggest different systems. Vision Res. 28, 941–946. - PubMed
    1. Schwartz J.D., and Lisberger S.G. (1994). Initial tracking conditions modulate the gain of visuo-motor transmission for smooth pursuit eye movements in monkeys. Vis. Neurosci. 11, 411–424. - PubMed

Publication types

LinkOut - more resources