

A Novel Contact Lens Sensor System for Continuous Intraocular Pressure Monitoring: Evaluation of Accuracy in Human Eyes
- PMID: 40599256
- PMCID: PMC12209922
- DOI: 10.1016/j.xops.2025.100826
A Novel Contact Lens Sensor System for Continuous Intraocular Pressure Monitoring: Evaluation of Accuracy in Human Eyes
Abstract
Purpose: To evaluate the accuracy of intraocular pressure (IOP) monitoring by a novel contact lens sensor system (CLS) in human eyes.
Design: Cross sectional study.
Participants: Eighty eyes of 80 participants were recruited and divided into 3 groups: (1) 40 normal eyes; (2) 30 eyes with primary open-angle glaucoma (POAG) or ocular hypertension (OHT) with normal IOP (<21 mmHg), including 27 POAG eyes and 3 OHT eyes; and (3) 10 POAG/OHT eyes with high IOP (≥21 mmHg), comprising 4 POAG eyes and 6 OHT eyes.
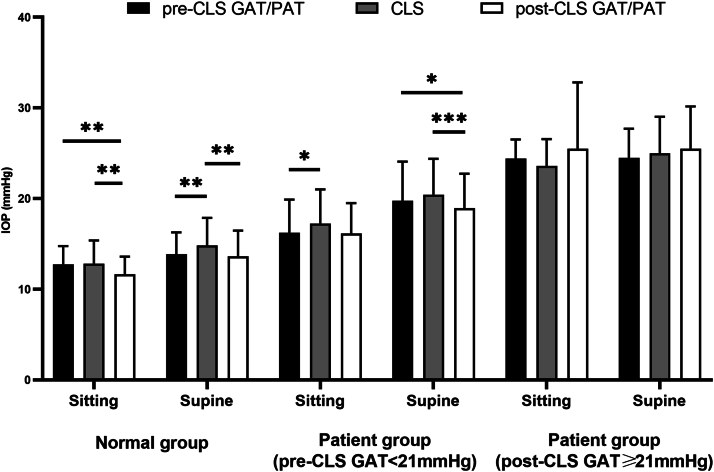
Methods: Participants wore the CLS to enable continuous monitoring of IOP while they assumed both seated and supine positions, with each position maintained for 10 minutes. Intraocular pressure was also measured by the Goldmann applanation tonometer (GAT) while participants were seated and the Perkins applanation tonometer (PAT) in supine, both before and after CLS wear.
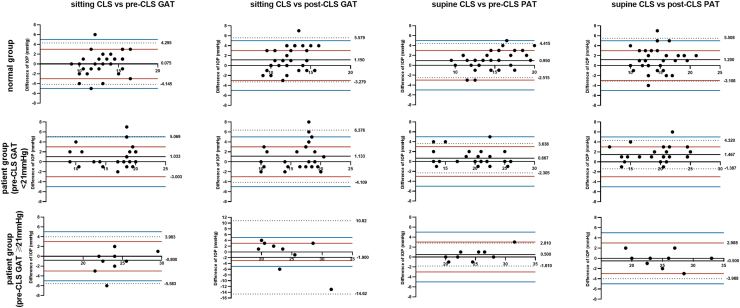
Main outcome measures: The average IOP measured by CLS during the final 1-minute of seated and supine positions was compared with IOP measured by GAT and PAT before and after CLS wear. Also, intraclass correlation coefficient and Bland-Altman analyses were performed.
Results: No significant differences were found between pre-CLS GAT and CLS in normal eyes or between all comparisons in POAG/OHT eyes with high IOP (P > 0.5). Contact lens sensor system IOP was higher than pre-CLS PAT and post-CLS GAT/PAT IOP in normal eyes (P < 0.01), and higher than pre-CLS GAT and post-CLS PAT in POAG/OHT eyes with normal IOP (P < 0.05). All IOP differences were within ± 2 mmHg. Intraclass correlation coefficient showed moderate to very strong consistency (0.51 ≤ r ≤ 0.95, P < 0.05) except for that between sitting CLS and post-CLS GAT in POAG/OHT eyes with high IOP. Bland-Altman analysis showed that over 80% of points were within ± 5 mmHg and over 60% within ± 3 mmHg.
Conclusions: With good agreement in IOP measurement compared with applanation tonometry in seated and supine positions, across normal and POAG/OHT eyes, the CLS can be used for fairly accurate continuous IOP monitoring.
Financial disclosures: Proprietary or commercial disclosure may be found in the Footnotes and Disclosures at the end of this article.
Keywords: Contact lens; Continuous tonometry; Glaucoma; Intraocular pressure.
© 2025 by the American Academy of Ophthalmologyé.
Figures


Similar articles
-
Rho kinase inhibitor for primary open-angle glaucoma and ocular hypertension.Cochrane Database Syst Rev. 2022 Jun 10;6(6):CD013817. doi: 10.1002/14651858.CD013817.pub2. Cochrane Database Syst Rev. 2022. PMID: 35686679 Free PMC article.
-
Comparison of intraocular pressure measurements obtained by Goldmann applanation tonometer, corvis ST and a conventional non-contact airpuff tonometer in eyes with previous myopic refractive surgery and correlation with corneal biomechanical parameters.Int Ophthalmol. 2025 Jun 6;45(1):232. doi: 10.1007/s10792-025-03598-z. Int Ophthalmol. 2025. PMID: 40478442
-
Long-term Safety and Performance of a Suprachoroidal Pressure Sensor System: Results of the EYEMATE-SC Trial Follow-up Study.Ophthalmology. 2025 Jul;132(7):775-784. doi: 10.1016/j.ophtha.2025.01.021. Epub 2025 Jan 31. Ophthalmology. 2025. PMID: 39892748
-
Perioperative medications for preventing temporarily increased intraocular pressure after laser trabeculoplasty.Cochrane Database Syst Rev. 2017 Feb 23;2(2):CD010746. doi: 10.1002/14651858.CD010746.pub2. Cochrane Database Syst Rev. 2017. PMID: 28231380 Free PMC article.
-
Agreement between rebound (iCare IC200), Goldmann applanation tonometer, and noncontact (air puff) tonometer in the immediate postoperative period following vitrectomy.Indian J Ophthalmol. 2025 Sep 1;73(9):1269-1275. doi: 10.4103/IJO.IJO_180_25. Epub 2025 Aug 29. Indian J Ophthalmol. 2025. PMID: 40880144
References
-
- Liang S.Y., Lee G.A., Shields D. Self-tonometry in glaucoma management—past, present and future. Surv Ophthalmol. 2009;54:450–462. - PubMed
-
- Aptel F., Lesoin A., Chiquet C., et al. Long-term reproducibility of diurnal intraocular pressure patterns in patients with glaucoma. Ophthalmology. 2014;121:1998–2003. - PubMed
-
- Liu J.H., Zhang X., Kripke D.F., Weinreb R.N. Twenty-four-hour intraocular pressure pattern associated with early glaucomatous changes. Invest Ophthalmol Vis Sci. 2003;44:1586–1590. - PubMed
-
- Agnifili L., Mastropasqua R., Frezzotti P., et al. Circadian intraocular pressure patterns in healthy subjects, primary open angle and normal tension glaucoma patients with a contact lens sensor. Acta Ophthalmol. 2015;93:e14–e21. - PubMed
LinkOut - more resources
Full Text Sources
