

[Relationship Between Different Traditional Chinese Medicine Syndrome Types and Gut Microbiota in Patients With Type 2 Diabetes Mellitus]
- PMID: 40599291
- PMCID: PMC12207041
- DOI: 10.12182/20250360507
[Relationship Between Different Traditional Chinese Medicine Syndrome Types and Gut Microbiota in Patients With Type 2 Diabetes Mellitus]
Abstract
Objective: To observe the characteristics of gut microbiota in patients with type 2 diabetes mellitus (T2DM) with different traditional Chinese medicine (TCM) syndrome types, and to further explore the key microbial communities and functional differences affecting syndrome differentiation.
Methods: A total of 45 patients who visited the Department of Geriatrics, Hunan Provincial Hospital of Integrated Traditional Chinese and Western Medicine in 2023 were enrolled. These included 15 T2DM patients with qi-yin deficiency and blood stasis syndrome (Group A), 15 T2DM patients with qi-yin deficiency syndrome (Group B), and 15 non-diabetic patients from the same period (Group C). Fecal samples were collected, and 16S rRNA sequencing and analysis were performed.
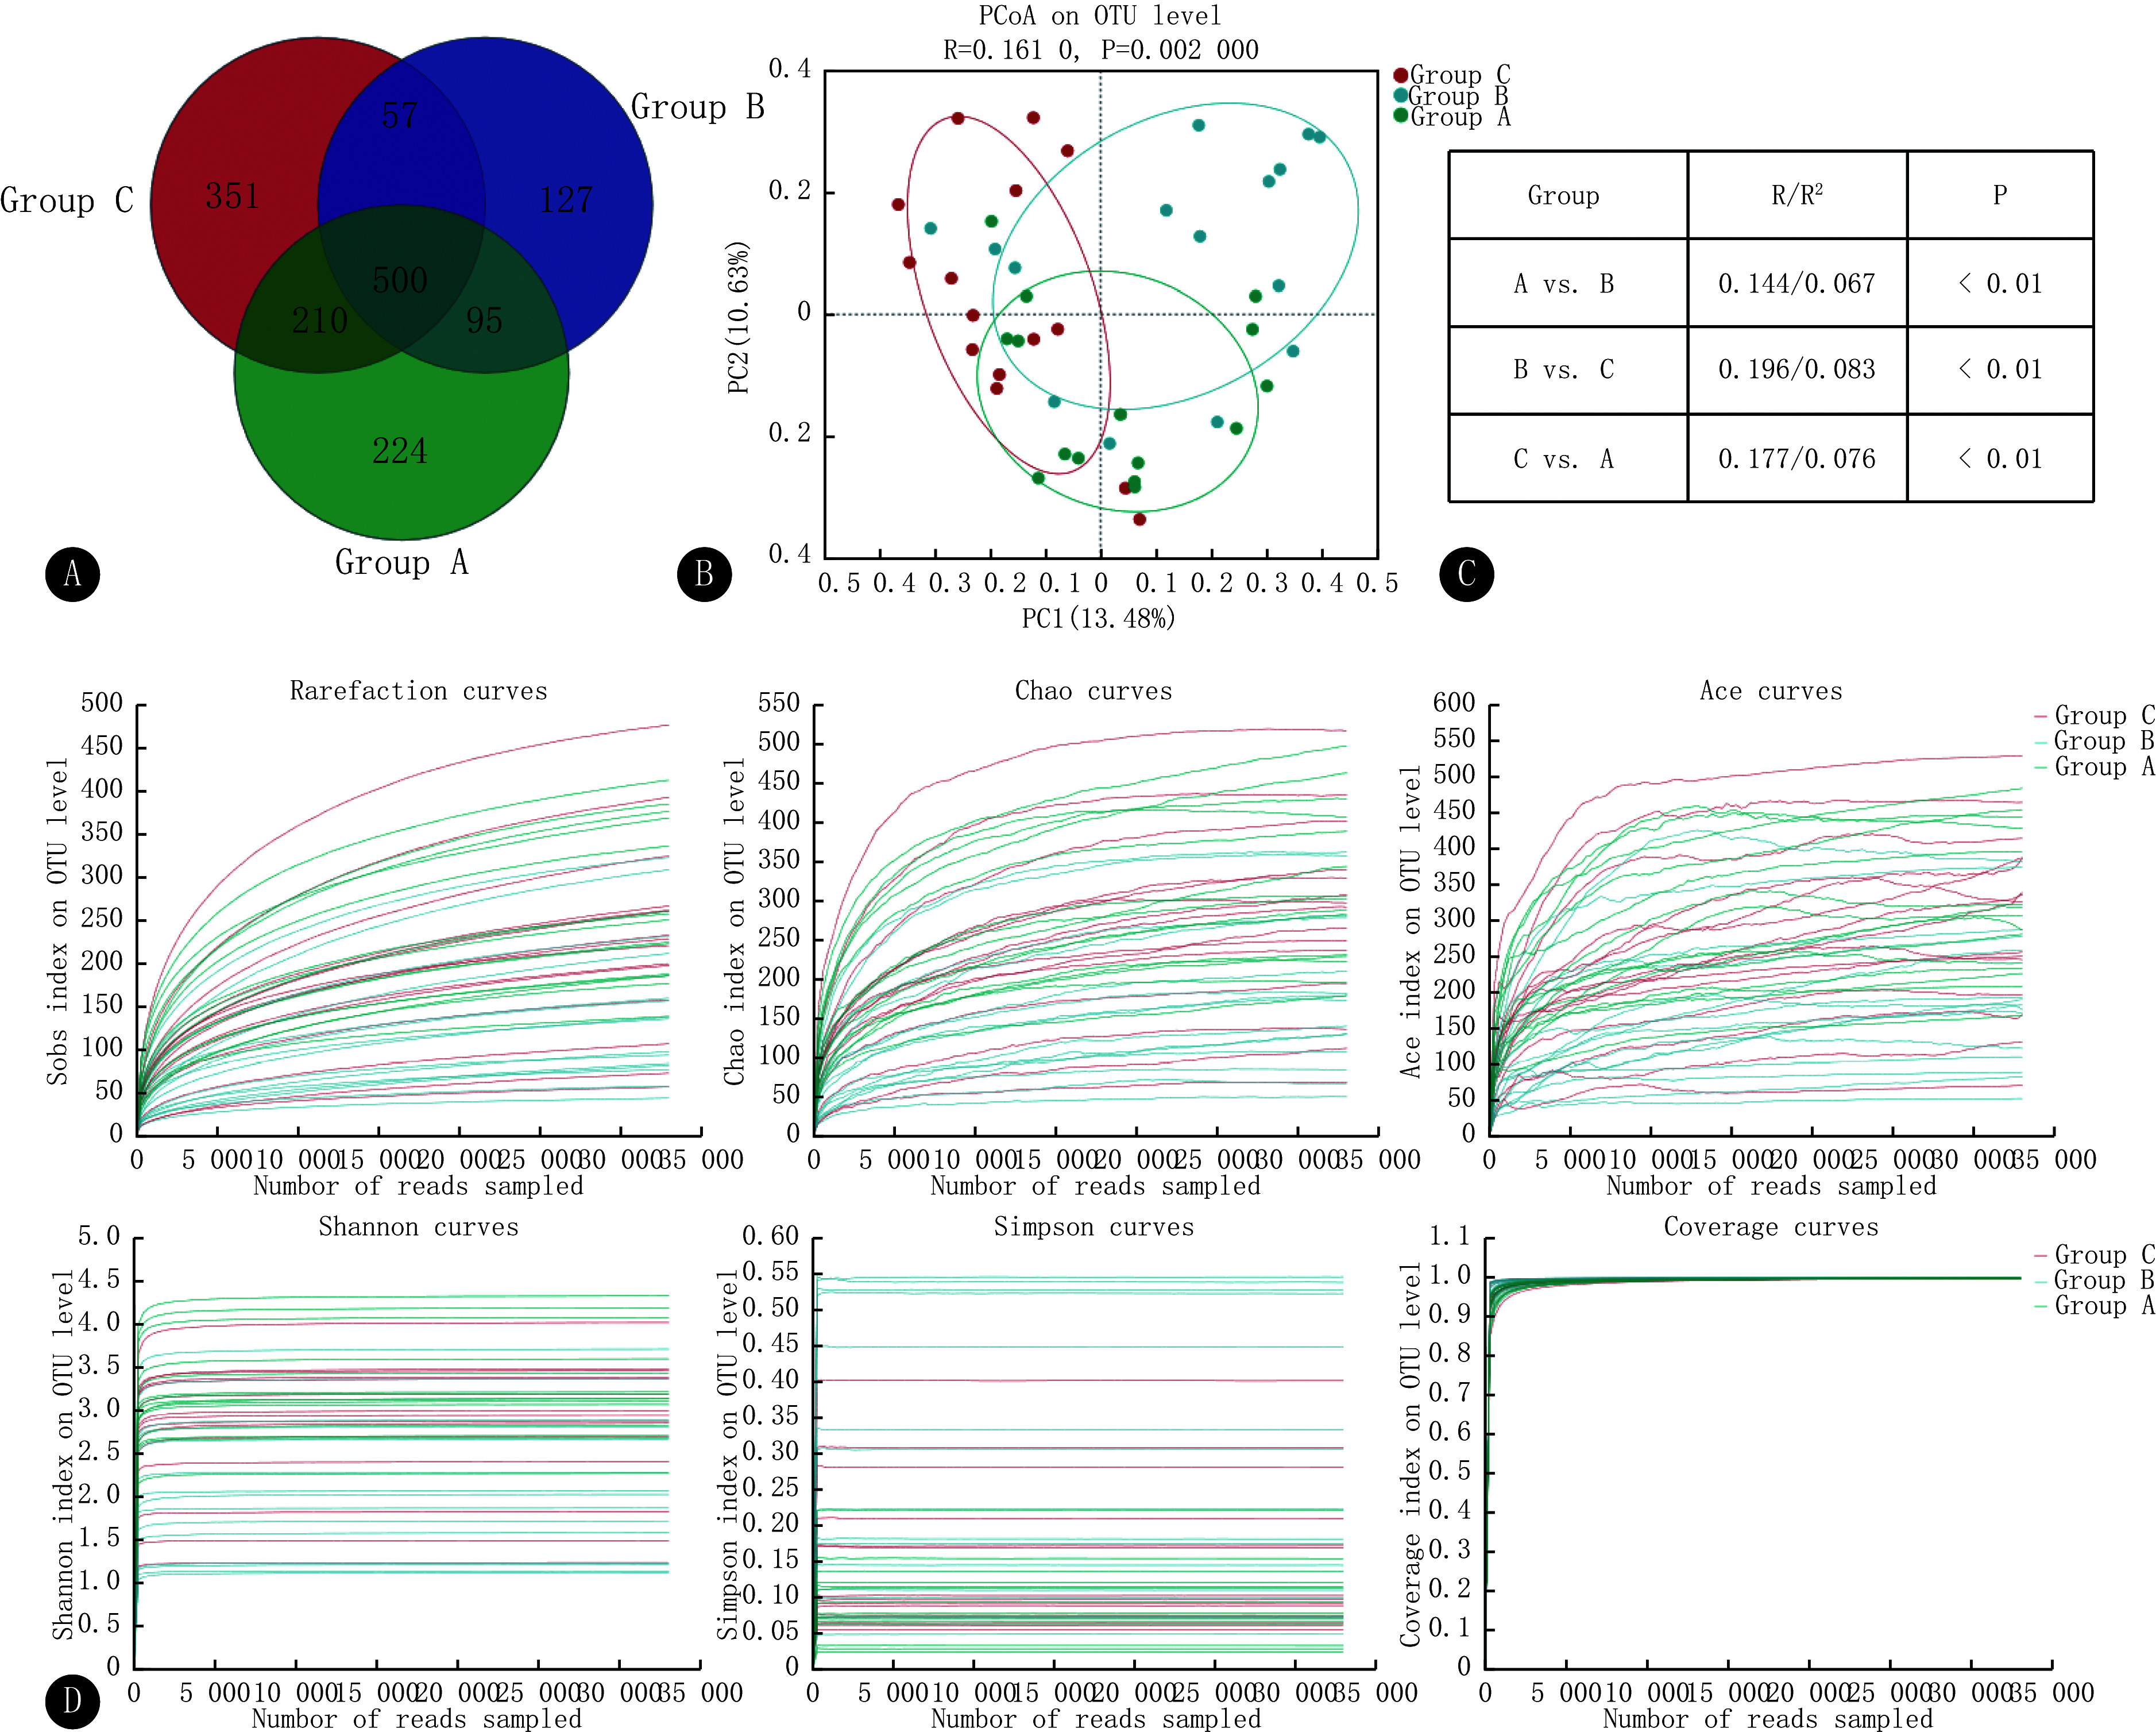
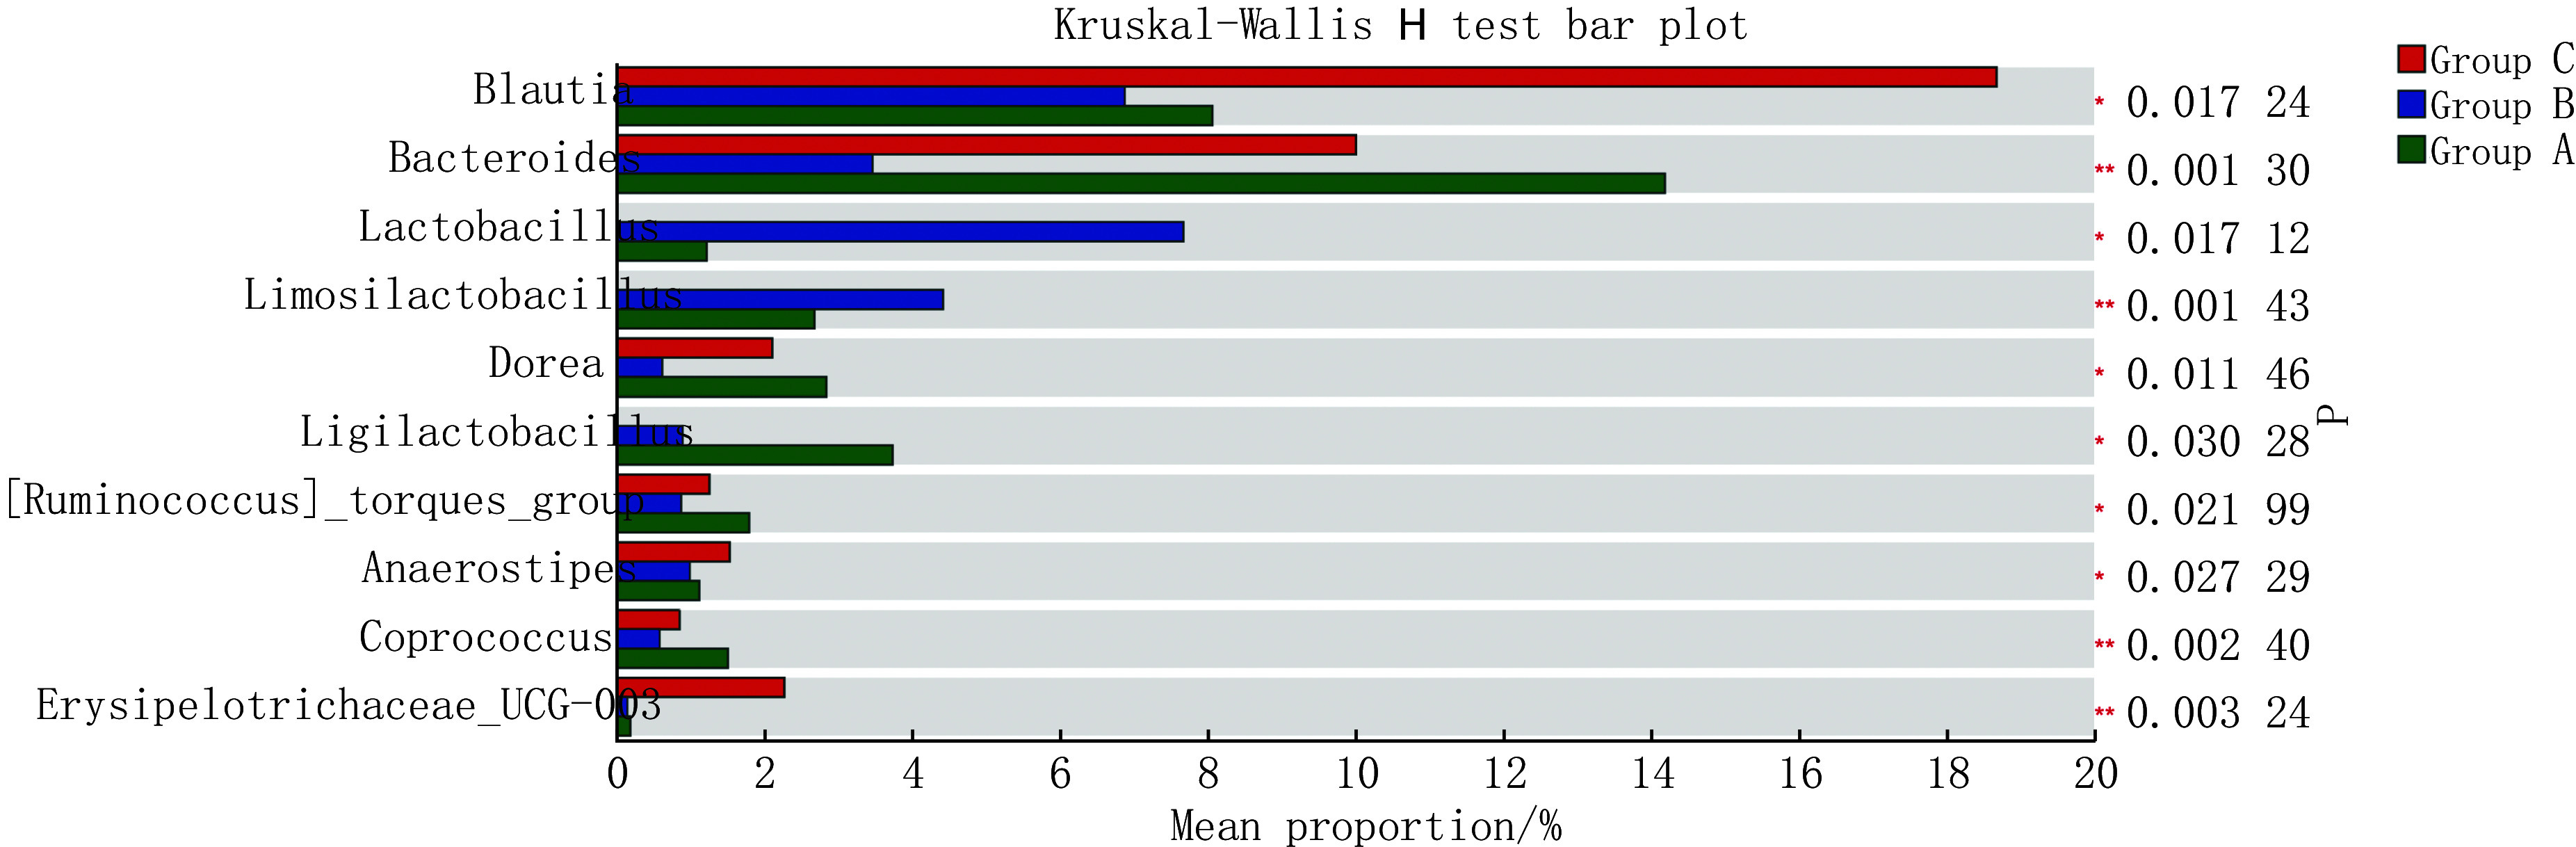
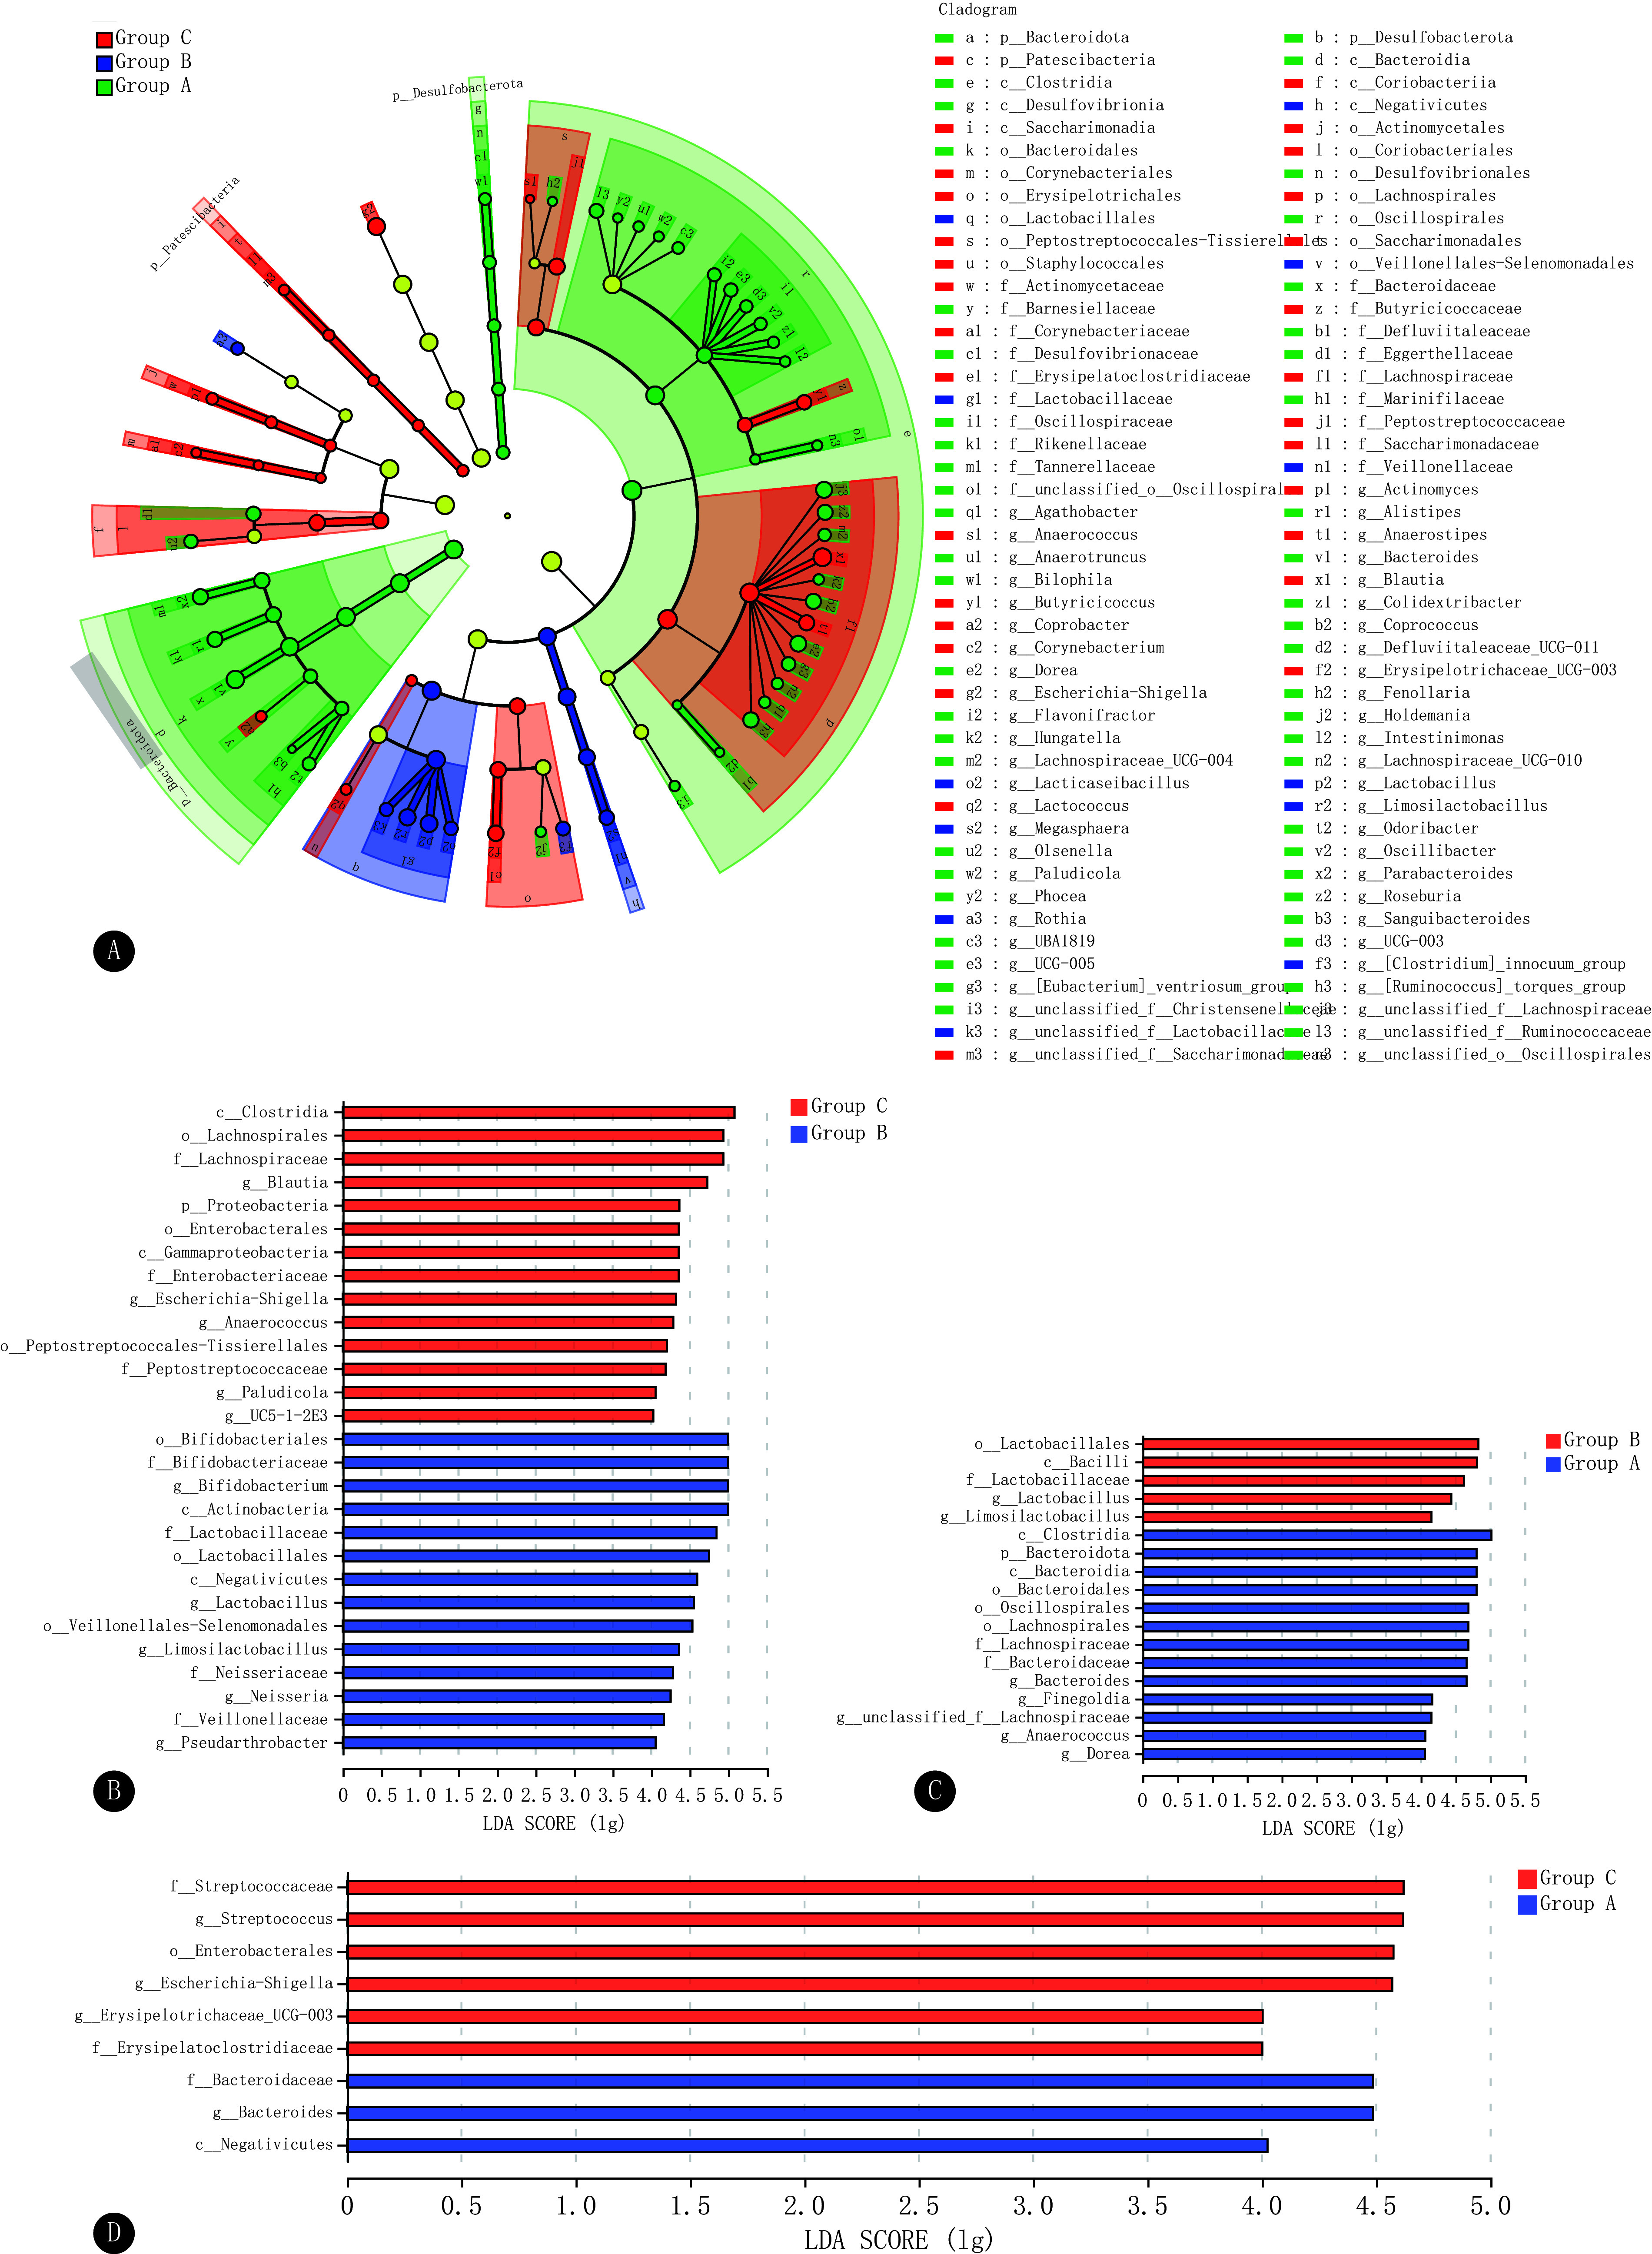
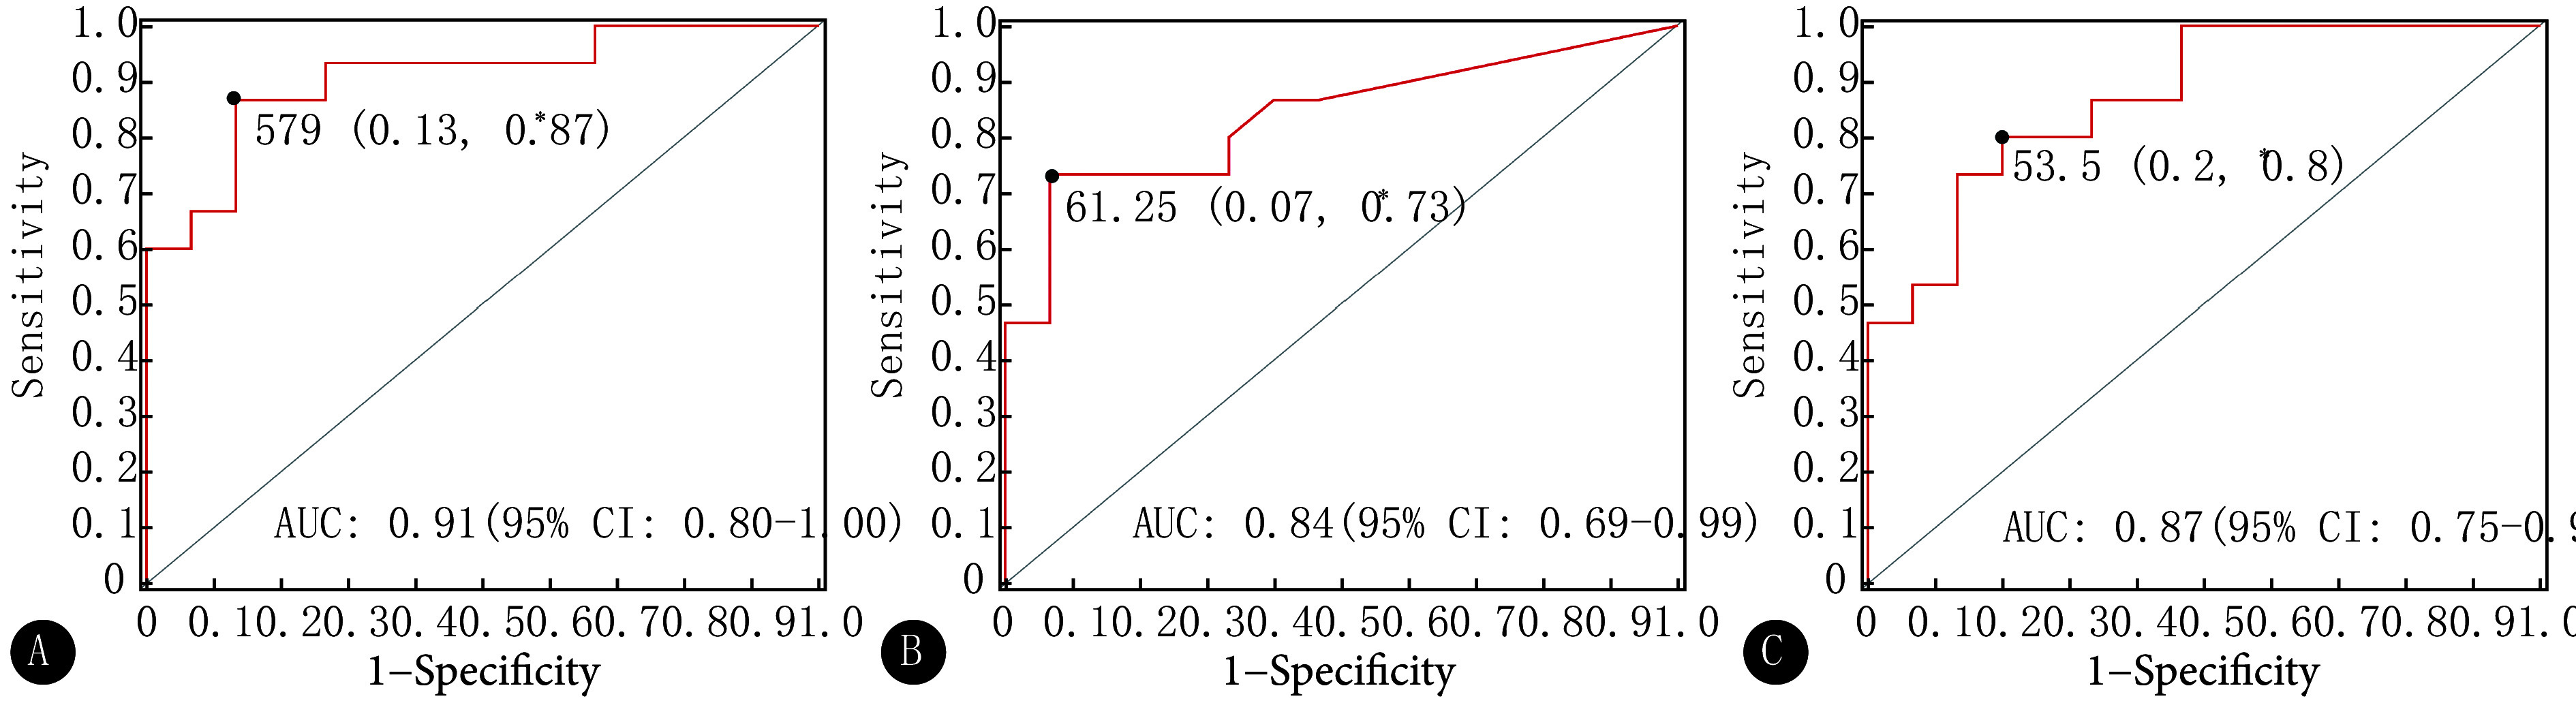
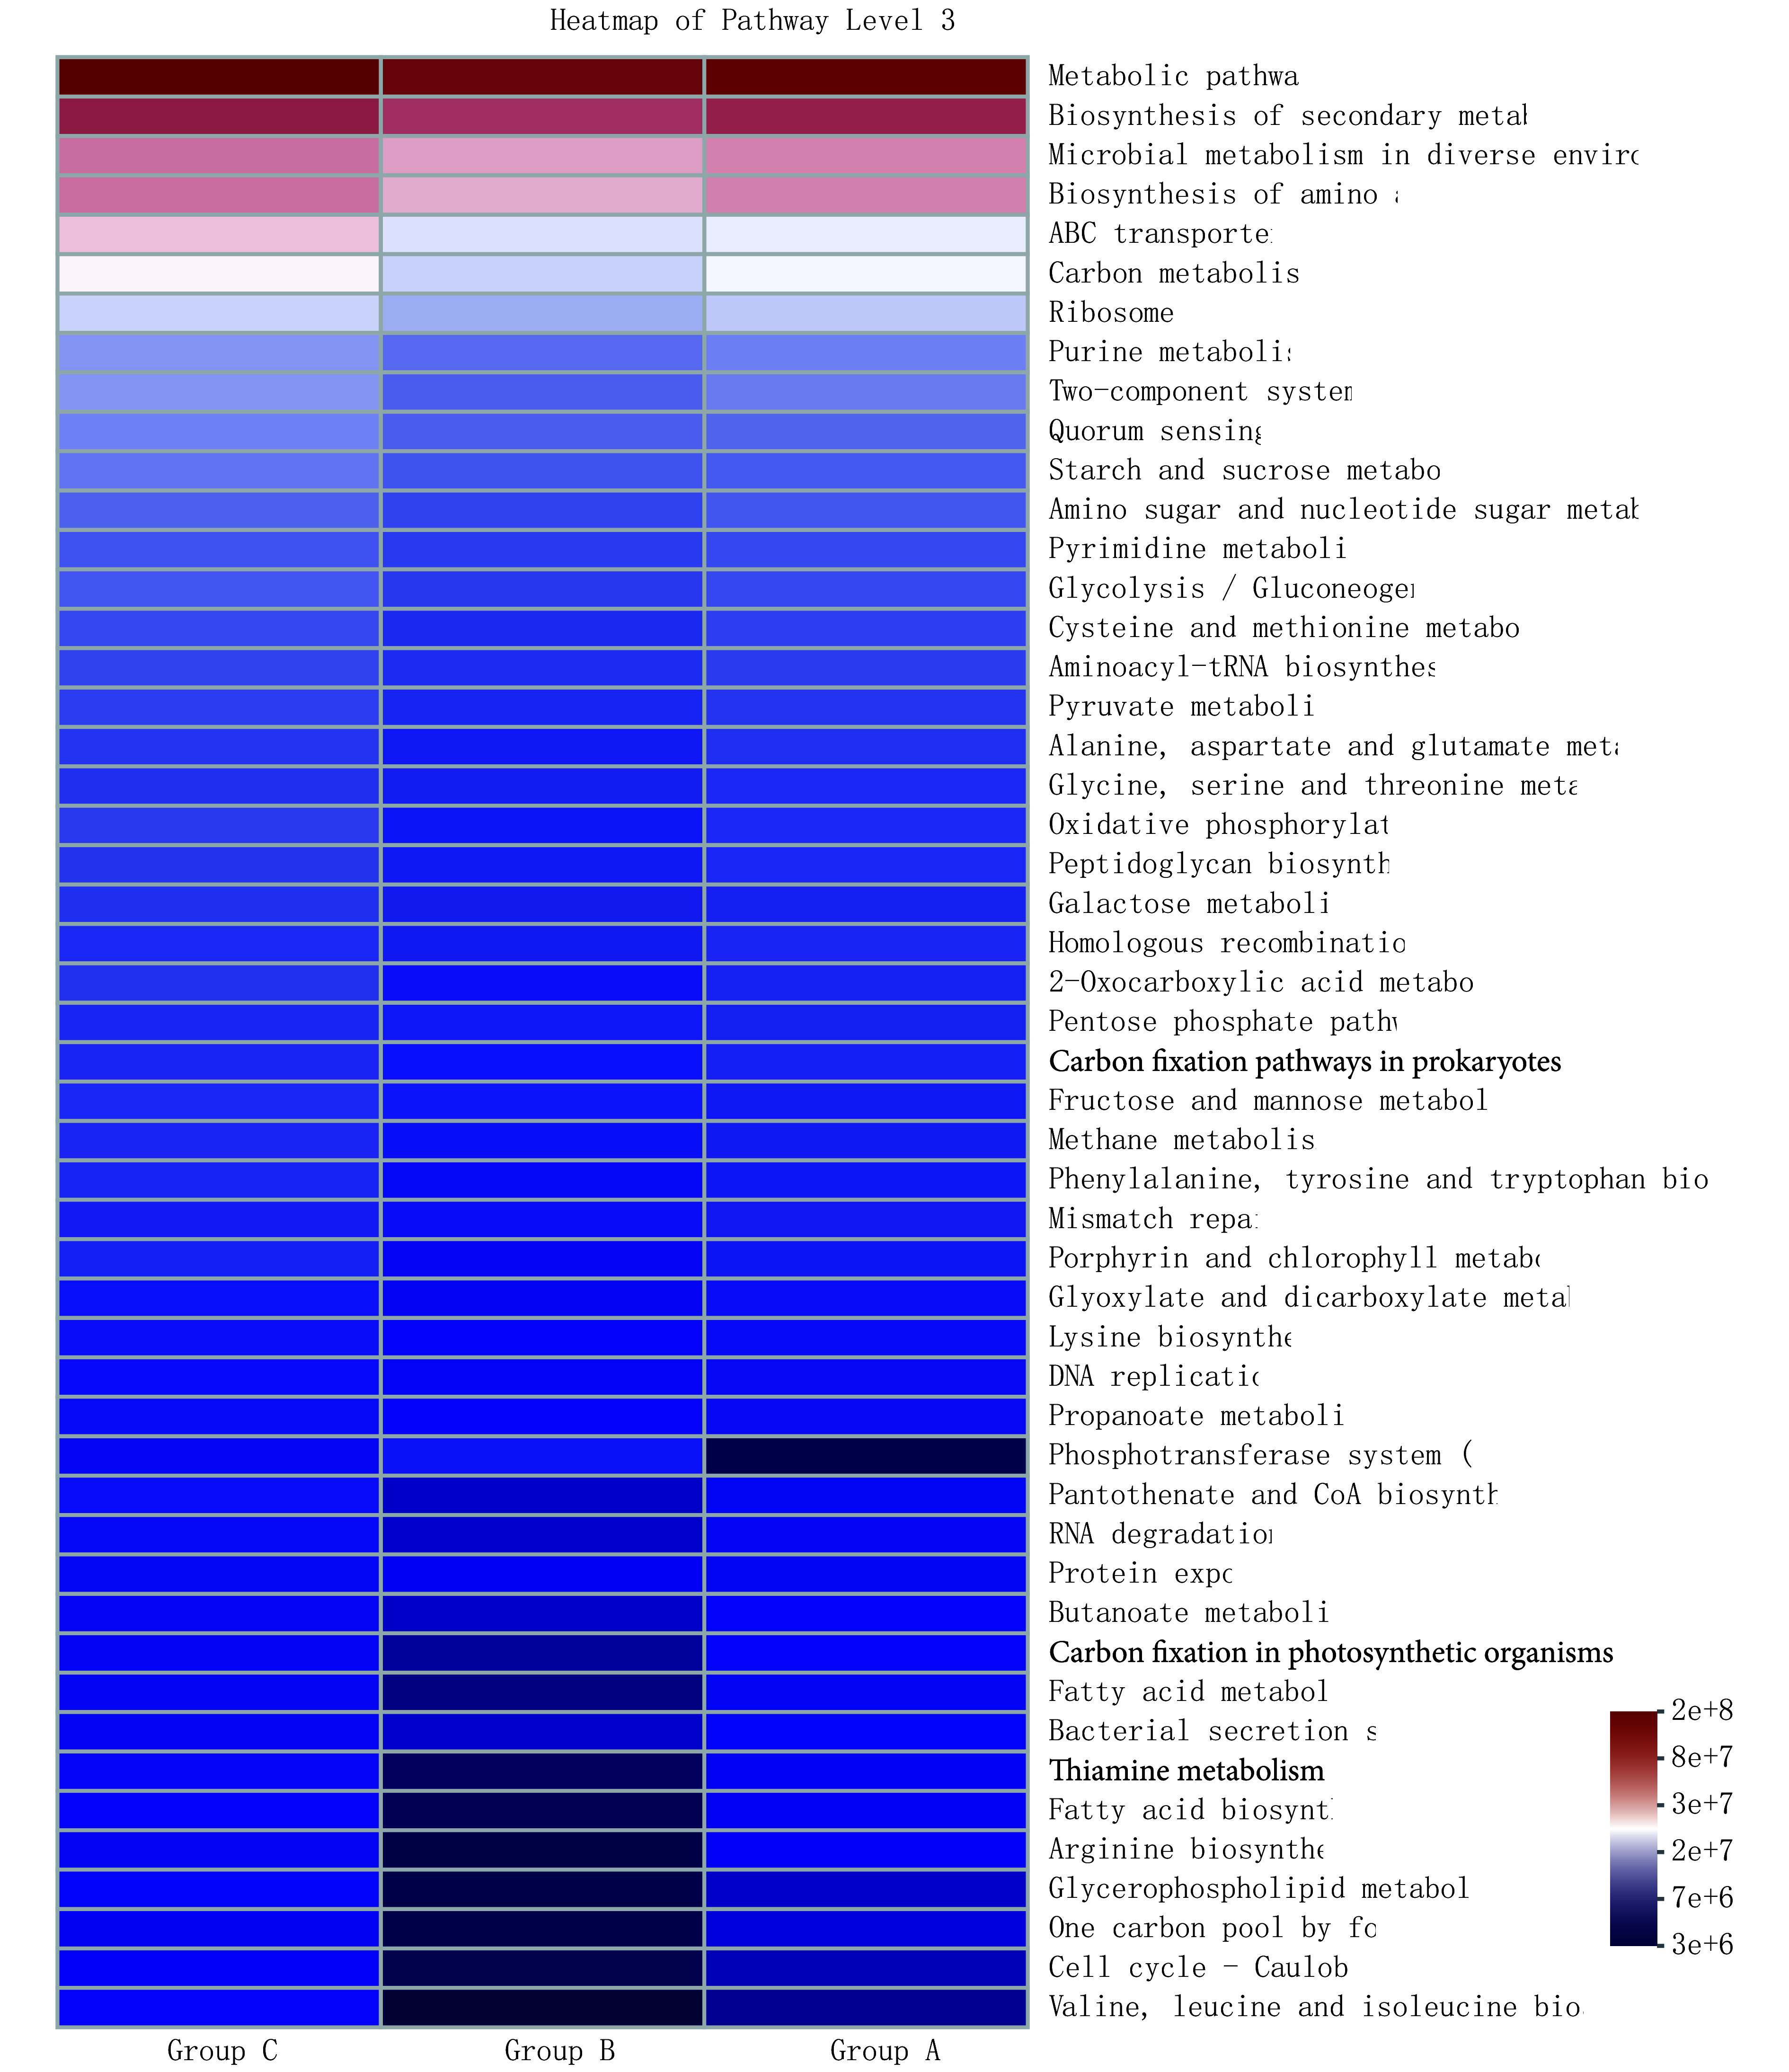
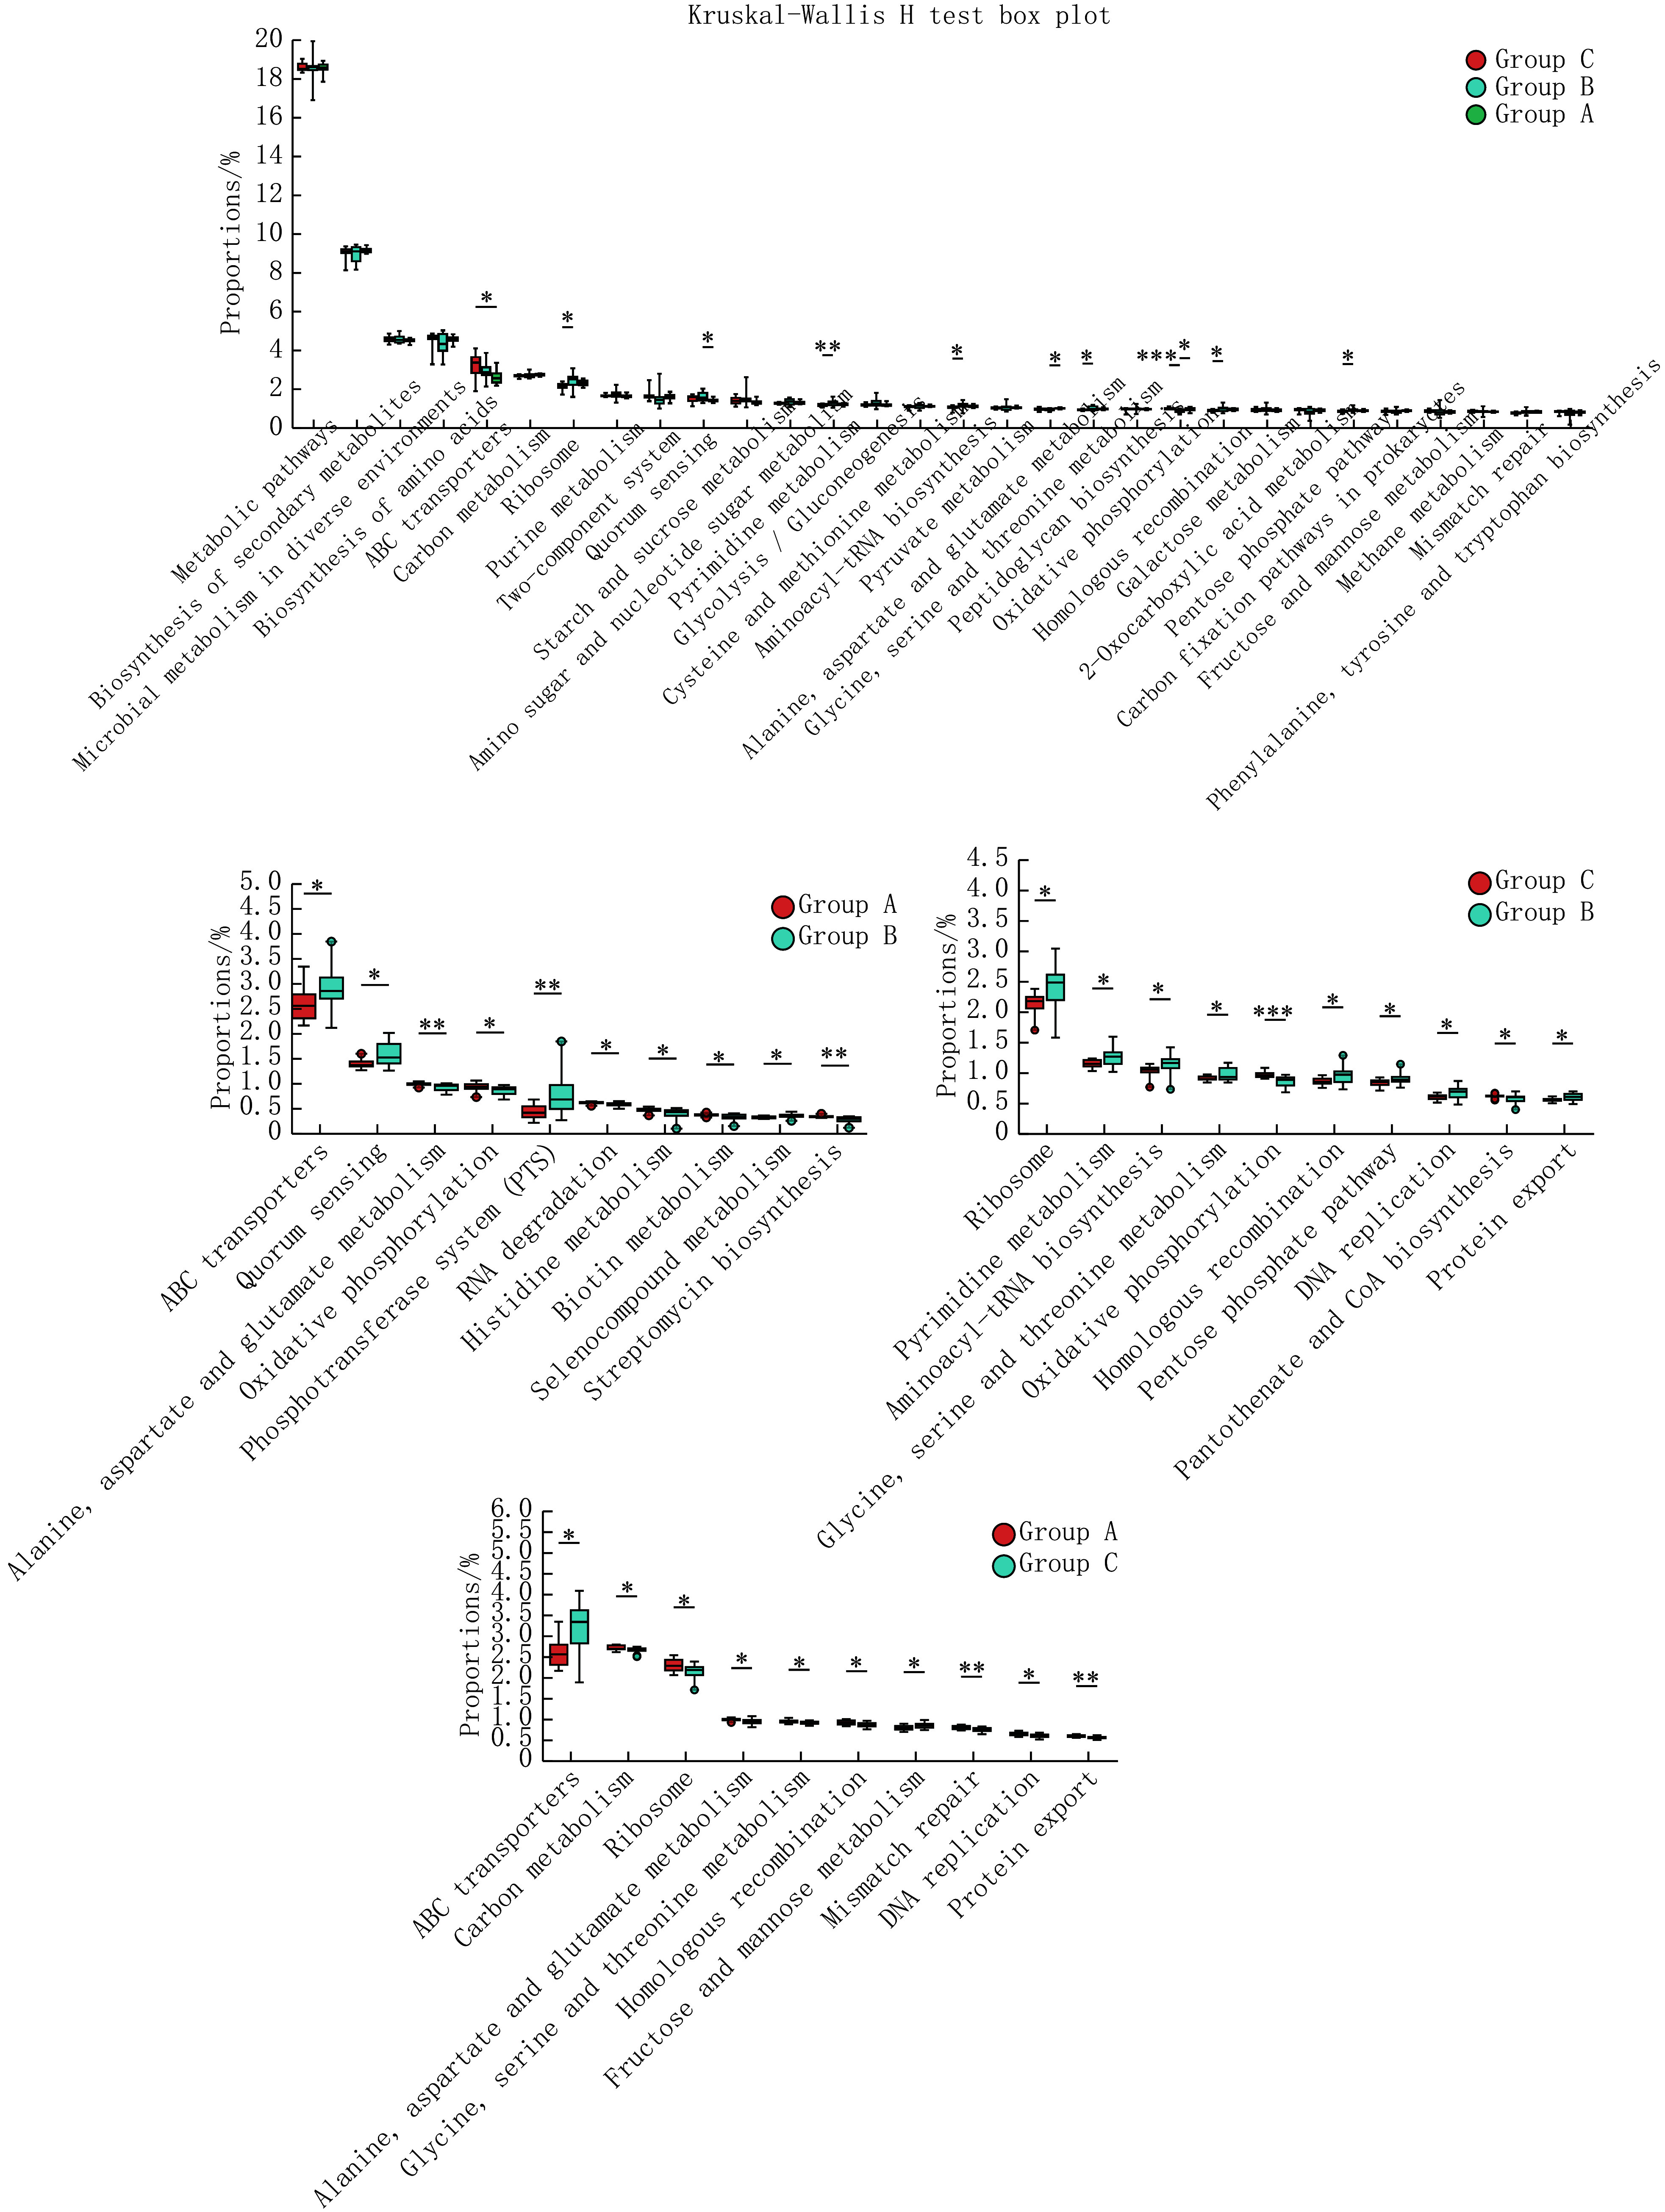
Results: 1) A total of 1564 operational taxonomic units (OTUs) were obtained from the three groups of patients, with 224, 127, and 351 unique OTUs identified in Groups A, B and C, respectively. 2) Both α- and β-diversity analyses indicated differences among the gut microbiota of the three groups. For instance, in the α-diversity analysis, the Sobs index showed significant inter-group differences (P < 0.01). Group A (264.00 ± 88.84) was significantly higher than Group B (145.90 ± 87.0) (P < 0.01), while Group B was significantly lower than Group C (229.7 ± 112.4) (P < 0.05). In the β-diversity analysis, the principal coordinate analysis (PCoA) indicated a clear separation among groups (R = 0.1610, P < 0.01). The R values in the Anosim/Adonis analysis ranged from 0.144 to 0.196, and the R² values ranged from 0.067 to 0.083, all indicating differences in inter-group comparisons (P < 0.01). 3) At the phylum level, Firmicutes, Actinobacteriota, and Bacteroidota were predominant in all groups. Among them, Bacteroidota exhibited significant inter-group differences (P < 0.05), with its abundance in Group A being significantly higher than that in Group B (P < 0.01). 4) Analysis of differences in microbiota composition, combined with linear discriminant analysis effect size (LEfSe) and Random Forest analysis, revealed that, at the genus level, the microbiota biomarkers between Group A and Group B were Parabacteroides, Bacteroides, g__unclassified_f__Lachnospiraceae, Roseburia, and Aspergillus, those between Group B and Group C were Erysipelotrichaceae_UCG-003 and Ruminococcus, and those between Group A and Group C were Parabacteroides, Anaerotruncus, and Oscillibacter. The results were validated by receiver operating characteristic (ROC) curve analysis, which suggested that the microbiota biomarkers between Group A and Group B (AUC = 0.91; 95% CI, 0.80-1.00), Group B and Group C (AUC = 0.84; 95% CI, 0.69-0.99), Group A and Group C (AUC = 0.87; 95% CI, 0.75-0.99) had good diagnostic efficacy. 5) The study identified 116 major pathways with inter-group differences through Kyoto Encyclopedia of Genes and Genomes (KEGG) analysis. For example, the enrichment degree of ABC transporter pathway in Group A (2.58 ± 0.36) was significantly lower than those in Group B (2.90 ± 0.48) and Group C (3.11 ± 0.66) (P < 0.05). These pathways were associated with metabolism and environmental information processing. g.
Conclusion: The differences in the gut microbiota characteristics and functions among patients with specific TCM syndromes of T2DM may provide references for TCM syndrome differentiation and therapeutic mechanisms.
目的: 观察中医不同证型下2型糖尿病患者肠道菌群的特征,进一步探讨影响证型分化的关键微生物群及功能差异。
方法: 选取2023年在湖南省中西医结合医院老年病科就诊的45例患者,包括15例2型糖尿病气阴两虚兼瘀证患者(A组)、15例2型糖尿病气阴两虚证患者(B组)和15例同期未患糖尿病者(C组)。采集患者粪便标本,应用16S rRNA进行测序和分析。
结果: ①三组患者得到了1564个操作分类单元(operational taxonomic units, OTUs),其中A、B、C组所特有的OTUs数分别为224、127和351个。②α和β多样性表明三组肠道微生物群之间存在差异,如:α多样性分析中,Sobs指数在三组间存在组间差异(P<0.01),A组(264.00±88.84)大于B组(145.90±87)(P<0.01),B组则小于C组(229.7±112.4)(P<0.05);β多样性分析中,主坐标分析(principal coordinate analysis, PCoA)提示三组组间分离明显(R=0.1610,P<0.01),Anosim/Adonis分析中R值在0.144~0.196间,R2值在0.067~0.083间,均提示组间对比存在差异(P<0.01)。③ 在门一级,各组均以厚壁菌门、放线菌门、拟杆菌门为主,其中拟杆菌门在三组间存在差异(P<0.05),且在A组中的占比高于B组(P<0.01)。④通过菌群组成差异分析结果、LEfSe(Linear discriminant analysis Effect Size)结合Random Forest分析,认为在属一级,A组和B组之间的菌群标志物是副拟杆菌属、拟杆菌属、某一未命名乳酸菌属、罗氏菌属、黄曲霉属;B组和C组之间的菌群标志物是Erysipelotrichaceae_UCG-003属、瘤胃球菌属;A组和C组间的有副拟杆菌属、厌氧菌属、颤杆菌克属。该结果通过受试者操作特征(receiver operating characteristic, ROC)曲线分析检验,认为A组和B组〔曲线下面积(area under the curve, AUC)=0.91,95%置信区间(confidence interval, CI):0.80~1.00〕、B组和C组(AUC=0.84,95%CI:0.69~0.99)、A组和C组(AUC=0.87,95%CI:0.75~0.99)间的菌群标志物具有较好的诊断效能。⑤研究通过京都基因与基因组百科全书(Kyoto Encyclopedia of Genes and Genomes, KEGG)分析确定了116条存在组间差异的主要通路,如ABC transporters通路富集程度在A组(2.58±0.36)中低于B组(2.90±0.48)和C组(3.11±0.66)(P<0.05),这些通路与新陈代谢和环境信息处理等有关。
结论: 2型糖尿病特殊证型患者的肠道菌群特征和功能差异可为中医辨证分型和治疗机制提供参考。
Keywords: 16S rRNA gene sequence; Gut microbiota; Type 2 diabetes mellitus.
© 2025《四川大学学报(医学版)》编辑部 Copyright ©2025 Journal of Sichuan University (Medical Science Edition).
Conflict of interest statement
利益冲突 所有作者均声明不存在利益冲突
Figures
References
-
- 林思睿, 毛竹君 中医药防治糖尿病视网膜病变研究进展. 中华中医药杂志. 2024;39(2):878–881.
- LIN S R, MAO Z J Research progress of traditional Chinese medicine in the prevention and treatment of diabetic retinopathy. China J Trad Chin Med Phar. 2024;39(2):878–881.
Publication types
MeSH terms
Substances
LinkOut - more resources
Full Text Sources
Medical