. 2025 Jun 17:52:474-491.
doi: 10.1016/j.bioactmat.2025.06.019. eCollection 2025 Oct.

Magnesium ions attenuate tendon graft fibrosis during its ligamentization after ACL reconstruction through modulation of fibroblast to myofibroblast trans-differentiation by promoting PGE2 secretion

Affiliations

Magnesium ions attenuate tendon graft fibrosis during its ligamentization after ACL reconstruction through modulation of fibroblast to myofibroblast trans-differentiation by promoting PGE2 secretion

Changhao Xu et al. Bioact Mater. .

Abstract

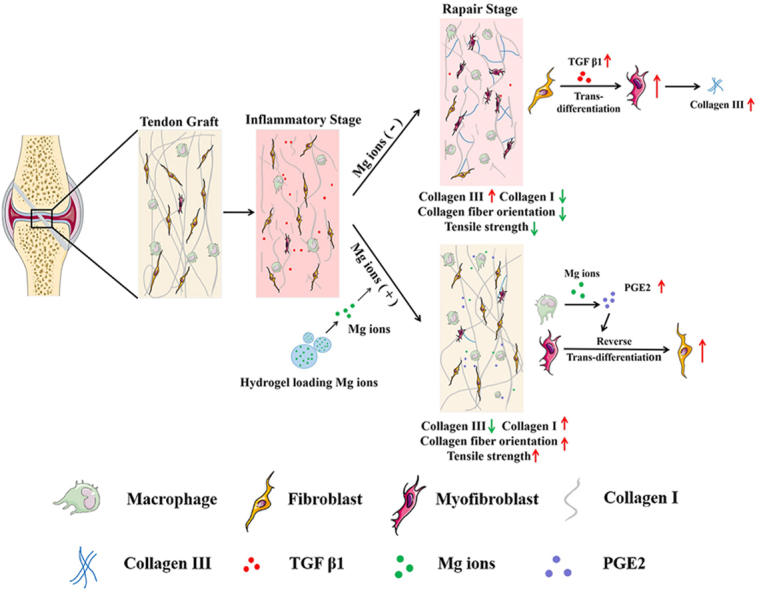
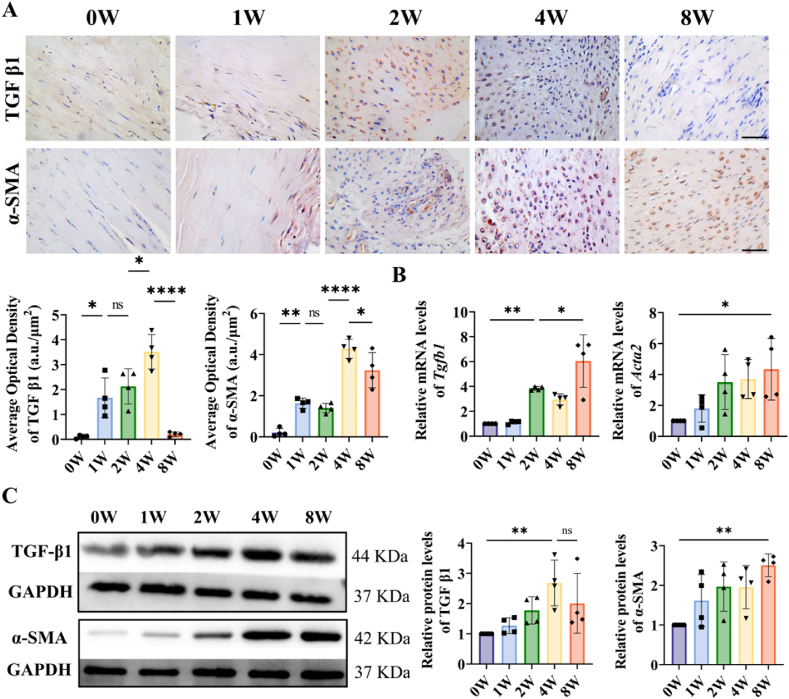
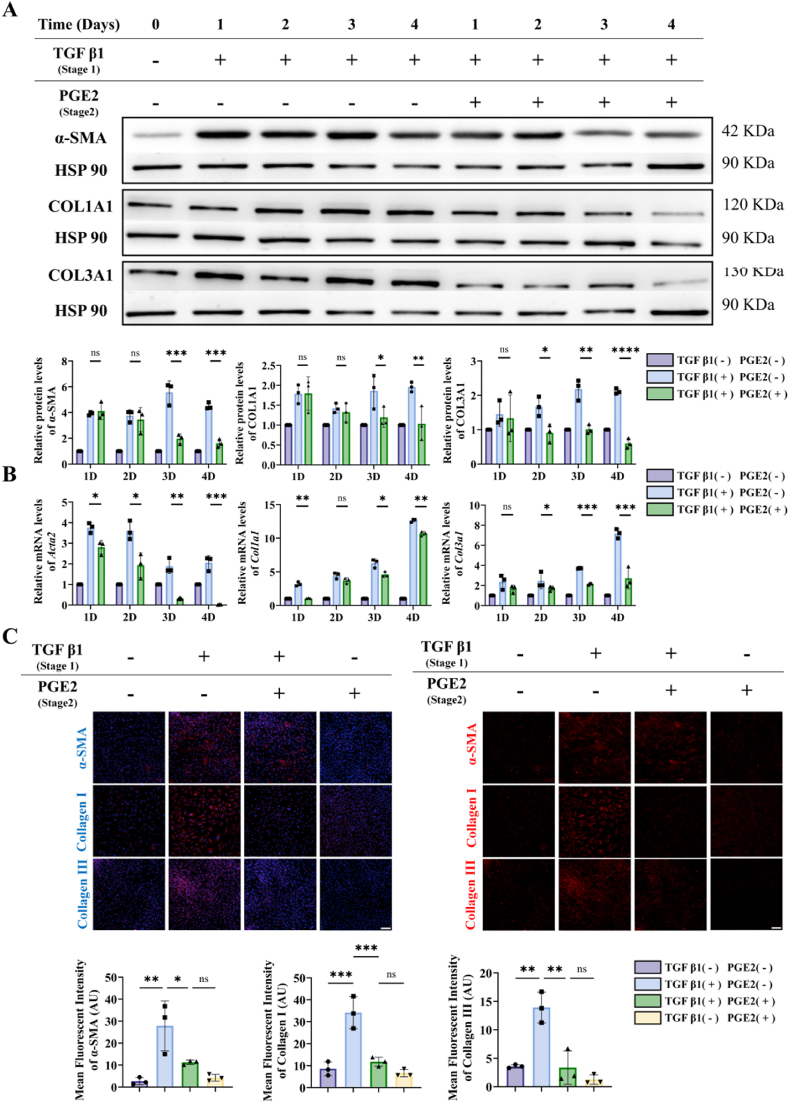
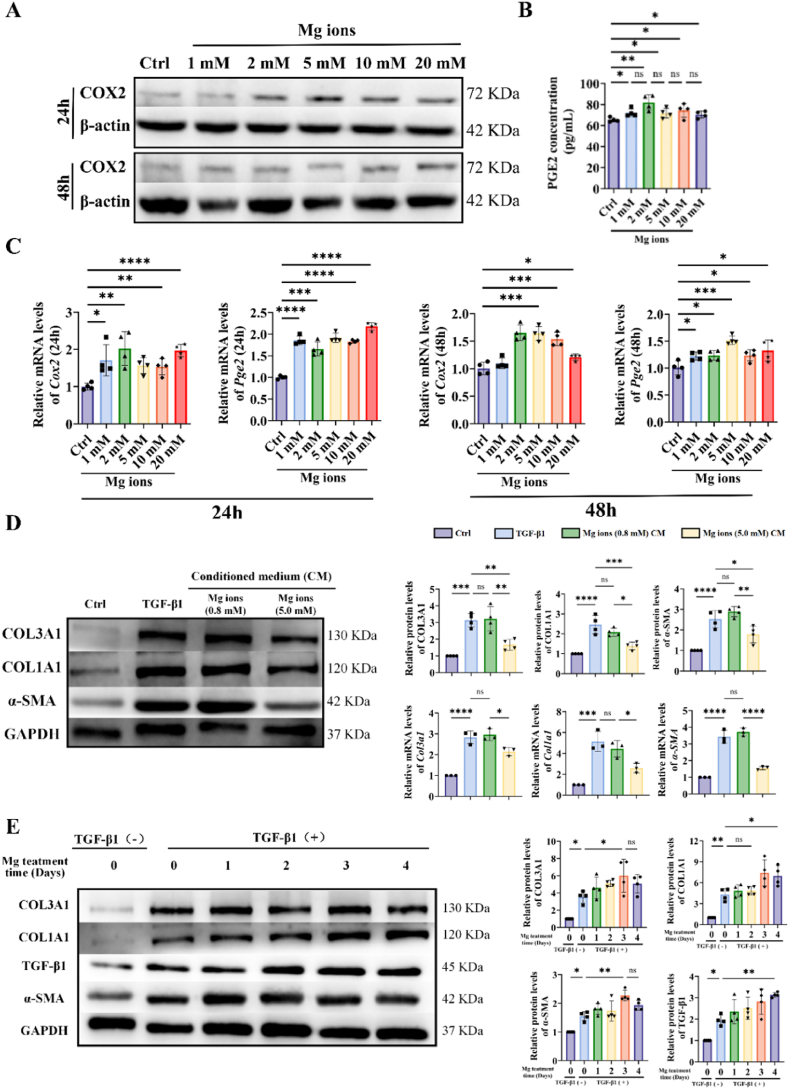
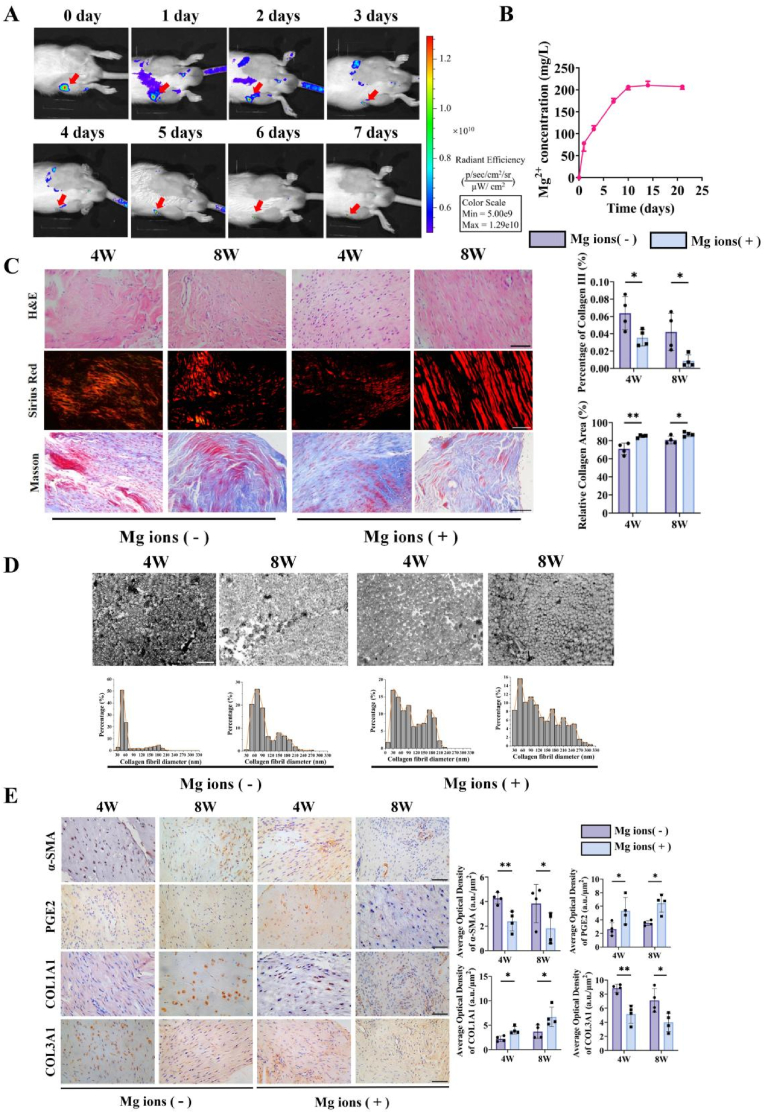
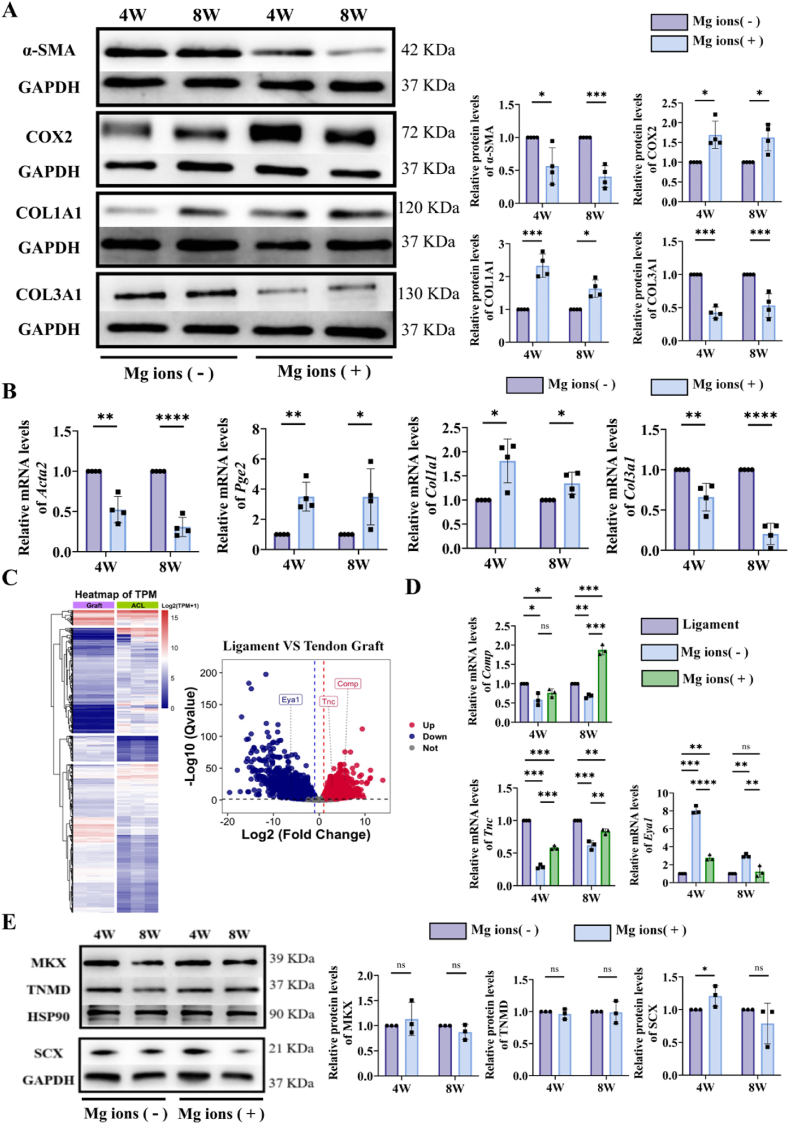
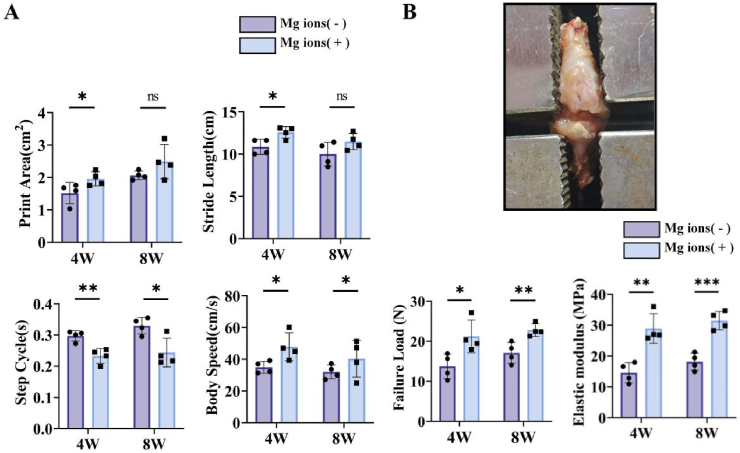
The ligamentization process of the tendon graft in anterior cruciate ligament (ACL) reconstruction is crucial for graft healing quality, thereby affecting knee joint function. Excessive scar tissue, caused by activation of trans-differentiation of fibroblasts to myofibroblasts, rather than orientated collagen fibers with normal composition and structure in the graft mid-substance seriously impacts ligamentization. The elucidation of the underlying mechanism behind the graft fibrosis may facilitate modulation of tendon graft ligamentization. Here, we show that transforming growth factor beta 1 (TGF-β1) was significantly upregulated with ligamentization process, contributing to fibroblast to myofibroblast trans-differentiation and thereby leading to impaired collagen orientation with overproduction of collagen type III. Of note, we verified that prostaglandin E2 (PGE2), a principal mediator of inflammation secreted by macrophages, significantly reversed TGF-β1-induced trans-differentiation of fibroblasts to myofibroblasts. Importantly, magnesium (Mg) ions were found to upregulate PGE2 production in macrophages, ultimately favoring inhibition of scar tissue formation and promoting expression of ligament-like phenotype in the graft mid-substance in rats. Consistently, the rats, with injection of the sodium alginate containing Mg ions into knee joint cavity, exhibited significantly improved gait performance and failure load relative to the control group. These results demonstrate the feasibility of using Mg ions to modulate tendon ligamentization in patients after ACL reconstruction.


Conflict of interest statement

The authors declare that they have no known competing financial interests or personal relationships that could have appeared to influence the work reported in this paper.

Figures

Image 1
Graphical abstract
Fig. 1
Fig. 1
Histology and function alteration of the tendon grafts in rats after ACL reconstruction over time. (A) Representative images of H&E staining showing the ligament and the tendon grafts of the rats at 0, 1, 2, 4, 8 weeks after surgery. Scale bars = 50 μm. (B) Quantitative analysis of cell density at peripheral and central parts of the tendon graft at the indicated time points. ns: not significant, ∗p < 0.05, ∗∗p < 0.01, and ∗∗∗p < 0 0.001; n = 4. (C) Quantification of print area, stride length, step cycle, and body speed in rats at 0, 2, 4 and 8 weeks after surgery. ∗p < 0.05 and ∗∗p < 0.01; n = 4. (D) Quantitative analysis of failure load in the tendon grafts of the rats at 0, 1, 2, 4 and 8 weeks after surgery. ∗p < 0.05, ∗∗p < 0.01 and ∗∗∗p < 0 0.001; n = 4. (E) The elastic modulus of the tendon grafts over healing time. ∗p < 0.05, ∗∗∗p < 0.001, and ∗∗∗∗p < 0.0001; n = 4.
Fig. 2
Fig. 2
The alteration of collagen composition and structure of the tendon grafts in rats after ACL reconstruction over time. (A) Representative Sirius Red staining images and quantitative analysis of the percentage of collagen fibers in different colors in the ligament, the tendon graft in rats at 0, 1, 2, 4 and 8 weeks after surgery. Scale bars = 50 μm. ns: not significant, ∗∗∗p < 0.001 and ∗∗∗∗p < 0.0001; n = 3. (B) Orientation index of collagen fibers in rat tendons at different time points. ns: not significant, ∗p < 0.05, and ∗∗∗p < 0.001; n = 4. (C) Quantitative analysis of the ratio of type III collagen to type I collagen in rat tendons at different time points. ∗∗p < 0.01 and ∗∗∗p < 0.001; n = 3. (D) Representative Masson's trichrome staining images and the quantitative analysis of collagen area in rat tendon grafts at 0, 1, 2, 4, and 8 weeks after surgery. ns: not significant, ∗p < 0.05 and ∗∗∗∗p < 0.0001; n = 4. Scale bars = 50 μm. (E) Representative transmission electron microscopy (TEM) images and quantitative analysis of collagen fibril diameter distribution in the native ligament, tendon grafts at 0, 1, 2, 4 and 8 weeks in rats after surgery. Scale bars = 1 μm. (F) Representative immunohistochemical staining images showing COL1A1and COL3A1 in the tendon grafts of the rats at 0, 1, 2, 4 and 8 weeks after surgery and the quantitative analysis of their expression levels. ns: not significant, ∗p < 0.05, ∗∗p < 0.01, ∗∗∗p < 0.001 and ∗∗∗∗p < 0.0001; n = 4. Scale bars = 50 μm.
Fig. 3
Fig. 3
The changes of the related protein and mRNA expression levels of the tendon grafts in rats after ACL reconstruction over healing time. (A–B) Quantitative analysis of COL1A1, COL3A1, COL2A1, and SOX9 protein and mRNA expression levels of the tendon grafts at 0, 1, 2, 4 and 8 weeks after surgery. ns: not significant, ∗p < 0.05, ∗∗p < 0.01, ∗∗∗p < 0.001 and ∗∗∗∗p < 0.0001; n = 4. (C) Representative western blot bands of MKX, TNMD and SCX of the tendon grafts and their quantitative analysis at different time points after surgery. ns: not significant, ∗p < 0.05, ∗∗p < 0.01 and ∗∗∗p < 0.001; n = 4.
Fig. 4
Fig. 4
The alteration of TGF-β1 and α-SMA expression levels in the tendon grafts over time. (A) Representative immunohistochemical staining images showing TGF-β1 and α-SMA and the quantitative analysis of their expression levels in the tendon grafts of the rats at 0, 1, 2, 4 and 8 weeks after surgery. ns: not significant, ∗p < 0.05, ∗∗p < 0.01, and ∗∗∗∗p < 0.0001; n = 4. Scale bars = 50 μm. (B) Quantitative analysis of Tgfb1 and Acta2 mRNA levels in the tendon grafts of the rats at 0, 1, 2, 4 and 8 weeks after surgery. ns: not significant, ∗p < 0.05 and ∗∗p < 0.01, n = 4. (C) Western blot (WB) analysis of TGF-β1 and α-SMA protein levels in the tendon grafts of the rats at 0, 1, 2, 4 and 8 weeks after surgery. ns: not significant, ∗∗p < 0.01; n = 4.
Fig. 5
Fig. 5
Effects of TGF-β1 and PGE2 on expression levels of α-SMA, COL1A1, and COL3A1 in the tendon-derived fibroblasts. (A) Representative Western blot bands of α-SMA, COL1A1, and COL3A1 and their quantitative analysis in the tendon-derived fibroblasts pretreated by TGF-β1 (0 or 2 ng/ml) for 1 day (Stage 1) and then treated by PGE2 (0 or 500 nM) for 1, 2, 3, and 4 days, respectively. ns: not significant, ∗p < 0.05, ∗∗p < 0.01, ∗∗∗p < 0.001 and ∗∗∗∗p < 0.0001; n = 3. (B) Quantitative analysis of Acta2 (encoding α-SMA), Col1a1 and Col3a1 mRNA levels in the tendon-derived fibroblasts pretreated by TGF-β1 (0 or 2 ng/ml) for 1 day (Stage 1) and then treated by PGE2 (0 or 500 nM) for 1, 2, 3, and 4 days, respectively. ns: not significant, ∗p < 0.05, ∗∗p < 0.01, and ∗∗∗p < 0.001; n = 3. (C) Representative immunofluorescence staining images of α-SMA, COL1A1, and COL3A1 and the quantitative analysis of their expression levels in the tendon-derived fibroblasts pretreated by TGF-β1 (0 or 2 ng/ml) for 1 day (Stage 1) and then treated by PGE2 (0 or 500 nM) for 3 days, respectively. Scale bars = 100 μm. ns: not significant, ∗p < 0.05, ∗∗p < 0.01 and ∗∗∗p < 0.001; n = 3.
Fig. 6
Fig. 6
Effects of Mg ions on PGE2 production in RAW264.7 cells and TGF-β1-induced fibrosis. (A) Representative Western blot (WB) bands of COX2. (B) The effect of Mg ion concentrations on PGE2 production from macrophage detected by ELISA after 24 h. ns: not significant, ∗p < 0.05 and ∗∗p < 0.01; n = 4. (C) Quantitative analysis of Cox2 and Pge2 mRNA levels in RAW264.7 cells after culture in the absence or presence of Mg ions at 24 h and 48 h ∗p < 0.05, ∗∗p < 0.01, ∗∗∗p < 0.001 and ∗∗∗∗p < 0.0001; n = 4. (D) Representative western blot bands of COL3A1, COL1A1 and α-SMA proteins and their quantitative analysis in fibroblasts with or without TGF-β1 treatment prior to stimulation with the conditioned medium of macrophage incubated with 0.8 mM or 5.0 mM Mg ions, and quantitative analysis of mRNA. ns: not significant, ∗p < 0.05, ∗∗p < 0.01, ∗∗∗p < 0.001, and ∗∗∗∗p < 0.0001; n = 4 for protein, n = 3 for mRNA. (E) Representative western blot bands of COL3A1, COL1A1, TGF-β1, and α-SMA proteins and their quantitative analysis in the tendon-derived fibroblasts with or without TGF-β1 and Mg ion treatment at different time points. ns: not significant, ∗p < 0.05, ∗∗p < 0.01; n = 4.
Fig. 7
Fig. 7
Histological analysis investigating effects of magnesium (Mg) ion treatment on ligamentization of the tendon grafts in the rats after ACL reconstruction. (A) The retention time of the sodium alginate (SA) loading Mg ions in the knee joints of the rats after surgery under IVIS detection. (B) The cumulative release amount of the Mg ions from the SA in the in vitro environment. (C) Representative images of H&E, Sirius Red and Masson's trichrome staining showing the tendon grafts in the rats at 4 and 8 weeks after surgery with or without Mg ion treatment and the quantitative analysis of the percentage of collagen type III and collagen area in the tendon grafts in the rats at 4 and 8 weeks after surgery with or without Mg ion treatment. ∗p < 0.05 and ∗∗p < 0.01; n = 4. Scale bars = 50 μm. (D) Representative TEM images and measurement of collagen fibril diameter distribution in the tendon grafts with or without Mg ion treatment at 4 and 8 weeks after surgery. Scale bars = 1 μm. (E) Representative immunohistochemical staining images showing α-SMA, PGE2, COL1A1 and COL3A1 and the quantitative analysis of their expression levels in the tendon grafts of the rats at 4 and 8 weeks after surgery with or without Mg ion treatment. ∗p < 0.05 and ∗∗p < 0.01; n = 4. Scale bars = 50 μm.
Fig. 8
Fig. 8
Quantitative analysis of gene and protein levels investigating effects of Mg ion treatment on ligamentization of the tendon grafts in the rats after reconstruction. (A) Representative Western blot (WB) bands of α-SMA, COX2, COL1A1, and COL3A1 and the quantitative analysis of their expression levels in the tendon grafts of the rats at 4 and 8 weeks after surgery with or without Mg ion treatment. ∗p < 0.05 and ∗∗∗p < 0.001; n = 4. (B) Quantitative analysis of Acta2 (encoding α-SMA), Pge2, Col1a1 and Col3a1 mRNA levels in the tendon grafts of the rats at 4 and 8 weeks after surgery with or without Mg ion treatment. ∗p < 0.05, ∗∗p < 0.01, and ∗∗∗∗p < 0.0001; n = 4. (C) Heatmap of transcripts per kilobase of exon model per million mapped reads (TPM) and volcano map of DEGs between ligament and tendon graft. Fold change≥2, q value < 0.05. (D) Quantitative analysis of the expression of Comp, Tnc and Eya1 mRNA levels in the tendon grafts with or without Mg ion treatment at 4 weeks and 8 weeks post-surgery and the native ligament. ns: not significant, ∗p < 0.05, ∗∗p < 0.01, ∗∗∗p < 0.001, and ∗∗∗∗p < 0.0001; n = 3. (E) Representative western blot bands and quantitative analysis of the expression of MKX, TNMD, and SCX in the tendon grafts treated with or without Mg ions at 4 and 8 weeks after surgery. ns: not significant, ∗p < 0.05; n = 3.
Fig. 9
Fig. 9
Effects of Mg ion treatment on knee function of the rats after ACL reconstruction. (A) Gait analysis of the rats with or without Mg ion treatment by measurement of Print area, Stride length, Step cycle, and Body speed at 4 and 8 weeks after surgery. ns: not significant, ∗p < 0.05 and ∗∗p < 0.01; n = 4. (B) Quantitative analysis of failure load and elastic modulus in the tendon grafts of the rats with or without Mg ion treatment at 4 and 8 weeks after surgery. ∗p < 0.05, ∗∗p < 0.01, and ∗∗∗p < 0.001; n = 4.
Fig. 10
Fig. 10
The schematic diagram showing the fibrosis mechanism during tendon graft mid-substance ligamentization process and the repair strategy. The necrotic fibroblast, in the isolated tendon autograft suffering from denervation and devascularization, produces TGF-β1 and thereby induces trans-differentiation of neighbouring fibroblasts to myofibroblasts. Mg ions treatment effectively attenuates tendon graft mid-substance fibrosis through a PGE2-dependent pathway, contributing to reversible trans-differentiation of myofibroblasts to fibroblats.

Similar articles

References

    1. Zhao X., Wu G., Zhang J., Yu Z., Wang J. Activation of CGRP receptor-mediated signaling promotes tendon-bone healing. Sci. Adv. 2024;10(10) - PMC - PubMed
    1. Wang L.J., Zeng N., Yan Z.P., Li J.T., Ni G.X. Post-traumatic osteoarthritis following ACL injury. Arthritis Res. Ther. 2020;22(1):57. - PMC - PubMed
    1. Wang J., Xu J., Wang X., Sheng L., Zheng L., Song B., Wu G., Zhang R., Yao H., Zheng N., Yun Ong M.T., Yung P.S., Qin L. Magnesium-pretreated periosteum for promoting bone-tendon healing after anterior cruciate ligament reconstruction. Biomaterials. 2021;268 - PubMed
    1. Park J., Soh H., Jo S., Weon S., Lee S.H., Park J.A., Lee M.K., Kim T.H., Sung I.H., Lee J.K. Scaffold-induced compression enhances ligamentization potential of decellularized tendon graft reseeded with ACL-derived cells. iScience. 2023;26(12) - PMC - PubMed
    1. Font Tellado S., Balmayor E.R., Van Griensven M. Strategies to engineer tendon/ligament-to-bone interface: biomaterials, cells and growth factors. Adv. Drug Deliv. Rev. 2015;94:126–140. - PubMed

LinkOut - more resources