. 2025 Jun 17:52:492-510.
doi: 10.1016/j.bioactmat.2025.06.024. eCollection 2025 Oct.

Extracellular vesicles derived from salivary gland stem cells cultured on microwell scaffolds loaded with WNT3A promote the recovery of salivary gland function damaged by radiation via the YWHAZ-PI3K-AKT pathway

Affiliations

Extracellular vesicles derived from salivary gland stem cells cultured on microwell scaffolds loaded with WNT3A promote the recovery of salivary gland function damaged by radiation via the YWHAZ-PI3K-AKT pathway

Jae-Min Cho et al. Bioact Mater. .

Abstract

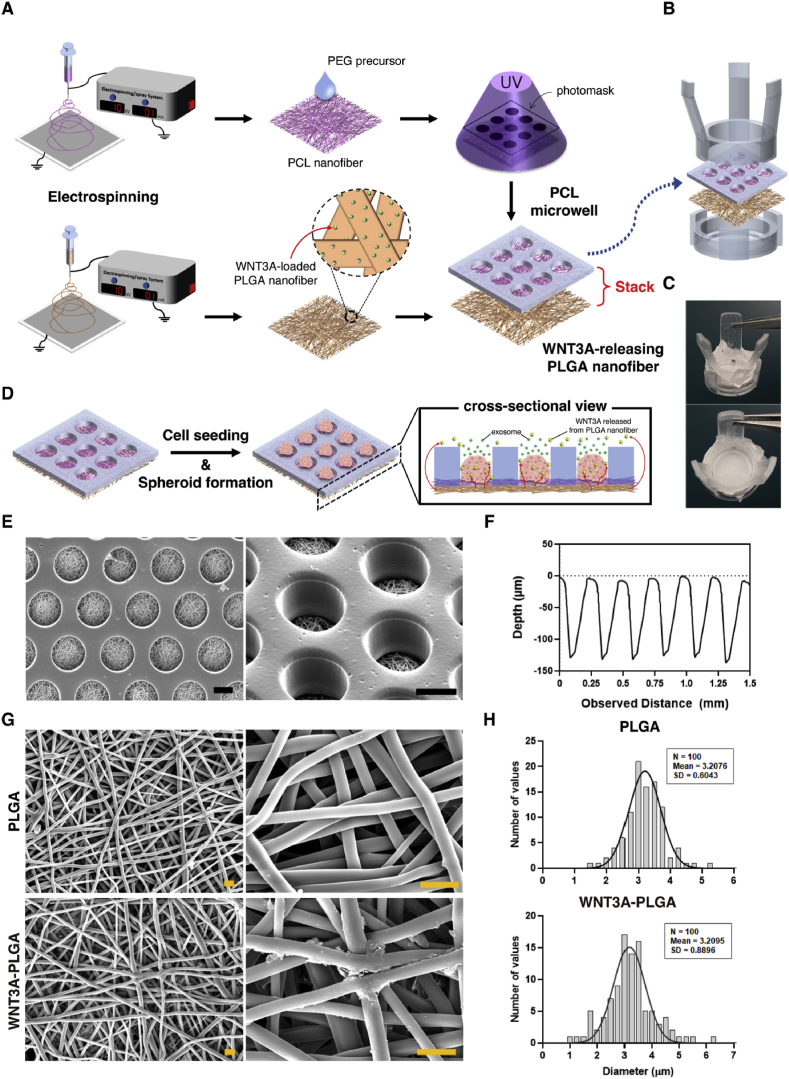
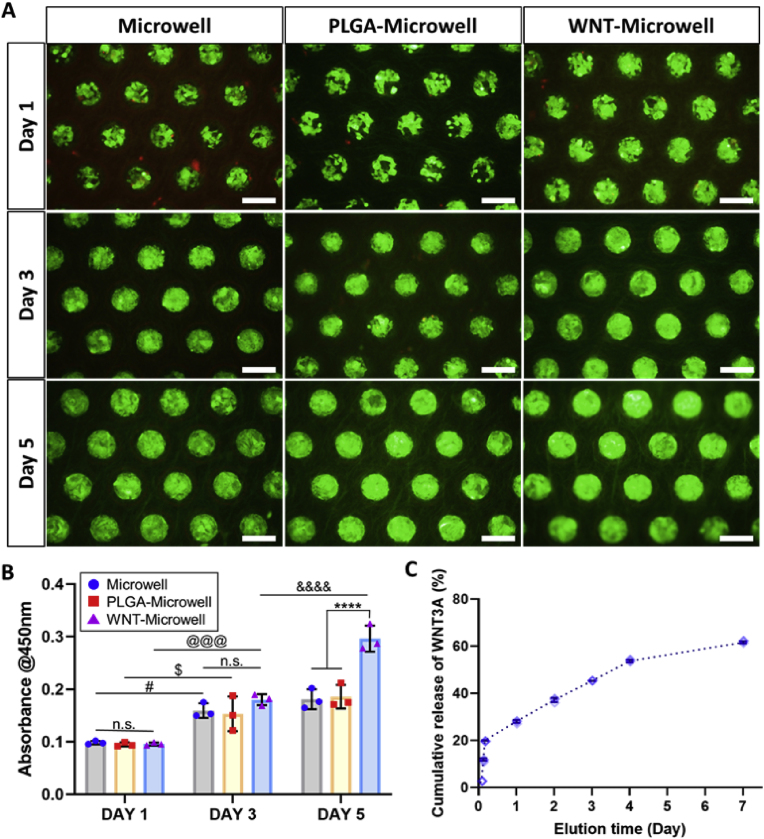
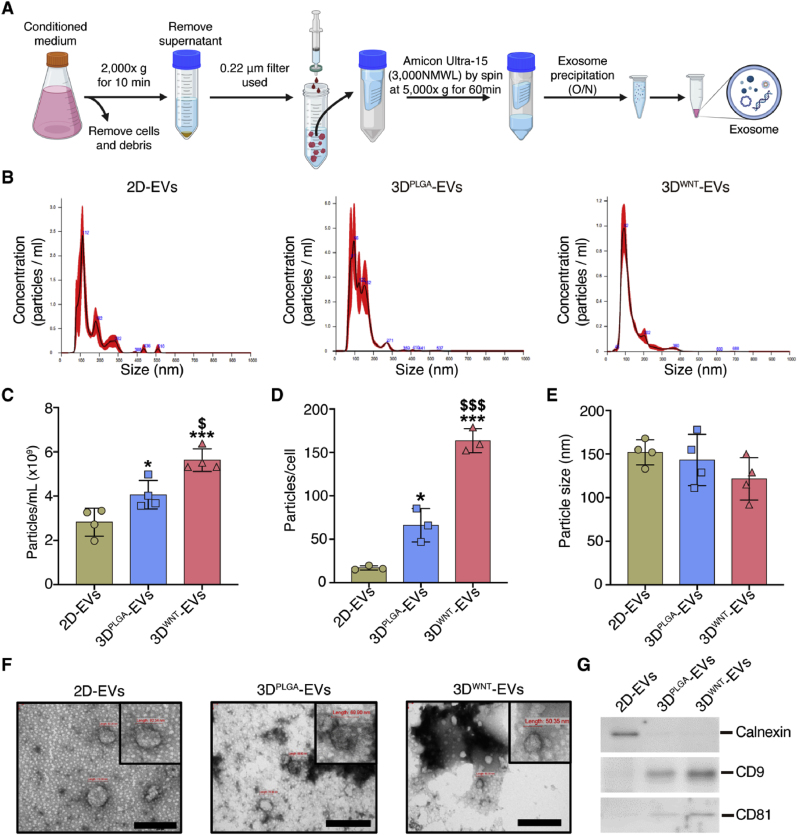
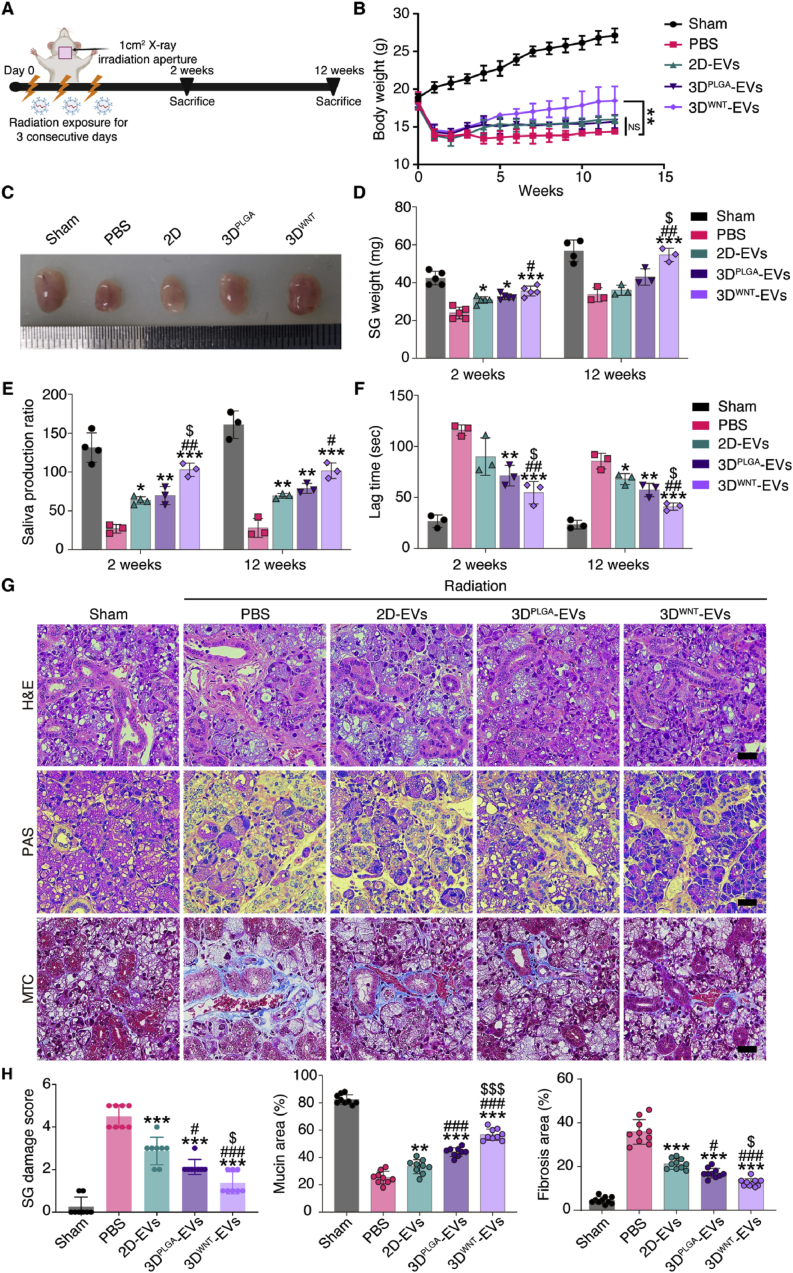
Salivary gland (SG) stem cell-derived extracellular vesicles (EVs) are promising agents for regenerative therapy, but efficient production and targeted delivery remain key challenges. We developed a WNT3A-releasing double-layered microwell scaffold by integrating WNT3A-loaded poly(D,L-lactide-co-glycolide) (PLGA) nanofibers with a polycaprolactone (PCL)-based microwell array. This 3D platform promotes salivary gland epithelial stem cell (sgEpSC) spheroid formation and sustained biochemical stimulation. EVs derived from four culture conditions (2D dish, 3D Microwell, 3D PLGA-Microwell, and 3D WNT-Microwell) were analyzed for yield, purity, and therapeutic efficacy. The WNT-Microwell system enabled stable spheroid formation and sustained WNT3A release over 7 days. sgEpSCs cultured on this platform produced significantly higher EV yields than other conditions. In a murine model of radiation-induced SG damage, retroductal injection of EVs from 3D spheroids cultured in WNT3A-releasing microwells (3DWNT-EVs) reduced apoptosis, preserved acinar structures, and restored saliva secretion more effectively than other groups. In irradiated human SG organoids, 3DWNT-EVs increased organoid size, mucin production, and suppressed cleaved caspase-3. Proteomic analysis identified YWHAZ (14-3-3ζ/δ) as a key regenerative cargo. Functional assays showed that EV-mediated delivery of YWHAZ activated PI3K-AKT signaling, enhanced SG progenitor proliferation, and mitigated radiation-induced damage. WNT-Microwell scaffolds enhance the yield and regenerative efficacy of SG-derived EVs. YWHAZ-enriched EVs promote SG repair via PI3K-AKT activation, offering a promising strategy for scalable, cell-free regenerative therapy in SG dysfunction.

Keywords: 3D spheroid culture; Exosome; Extracellular vesicle; Nanofibrous scaffold; Salivary gland; Salivary organoid.


Conflict of interest statement

The authors declare the following personal relationships which may be considered as potential competing interests: Sunyoung Park and Hyo-Il Jung are currently employed by The DABOM Inc.

Figures

Image 1
Graphical abstract
Fig. 1
Fig. 1
Schematic representation of the overall procedure for manufacturing double-layered WNT3A-releasing microwell scaffolds. (A) Fabrication process of PCL microwells and WNT3A-releasing PLGA nanofiber. (B) Stacking method of PCL microwells and WNT3A-loaded PLGA nanofiber using insert. (C) Images of fabricated double-layered WNT3A-releasing microwell scaffolds. (D) Schematic representation of cell seeding and spheroid formation on WNT3A-releasing scaffold. (E) SEM images of PCL microwells (scale bar = 100 μm). (F) Surface profiler of PCL microwells. (G) SEM images and (H) diameter distribution of bare PLGA nanofibers and WNT3A-loaded PLGA nanofibers (scale bar = 10 μm).
Fig. 2
Fig. 2
WNT3A release profiling and cell viability assessment of sgEpSCs in PLGA-Microwells. (A) Live/dead fluorescence images of sgEpSCs cultured on the scaffolds (scale bar = 200 μm). (B) Cell viability results of sgEpSCs cultured on Microwell, PLGA-Microwell, and WNT-Microwell scaffolds for 1, 3, and 5 days. Error bars represent SD of the mean. Cell viability assessment was conducted with n = 3 for each trial; #compared with Day 1 Microwell; $compared with Day 1 PLGA-Microwell; @compared with Day 1 WNT-Microwell; &compared with Day 3 WNT-Microwell; ∗compared with Day 5 Microwell. #p < 0.05, $p < 0.05, @@@p < 0.001, &&&&p < 0.0001, and ∗∗∗∗p < 0.0001. (C) Cumulative WNT3A release profile of WNT3A-releasing scaffold. ELISA upon recombinant human-WNT3A was conducted with n = 3. Error bars represent SD of the mean.
Fig. 3
Fig. 3
Characterization and analysis of EVs derived from sgEpSCs cultured under different conditions. (A) Schematic representation of EV isolation process from the conditioned medium of sgEpSCs, including sequential filtration, PEG precipitation, and ultracentrifugation. (B) NTA of EVs secreted by sgEpSCs cultured in 2D, PLGA-Microwell, and WNT-Microwell conditions, showing particle concentration and size distribution. (C) Particle concentration of EVs smaller than 200 nm, showing 2.8 × 109 particles/mL in 2D culture, 4 × 109 particles/mL in 3D PLGA-Microwell culture, and 5.8 × 109 particles/mL in 3D WNT-Microwell culture. (D) Average number of EVs released per cell in each culture condition: 20 EVs/cell for 2D, 65 EVs/cell for 3D PLGA-Microwell, and 175 EVs/cell for 3D WNT-Microwell. (E) Size distribution analysis of EVs across different culture conditions. No significant difference in size was observed. Data are shown as the mean ± SD. To compare groups, we used one-way ANOVA with Tukey post-hoc test; ∗compared with 2D; $compared with 3DPLGA. ∗p < 0.05, ∗∗∗p < 0.001, $p < 0.05, and $$$p < 0.001. (F) TEM images of sgEpSCs-derived EVs from each culture condition, showing spherical vesicles with sizes ranging from 50 to 150 nm. (G) Western blot analysis of EV-associated markers. Calnexin (negative marker) was detected in 2D-EVs but absent from 3DPLGA-EVs and 3DWNT-EVs. CD9 and CD81 (positive markers) were highly enriched in 3DPLGA-EVs and 3DWNT-EVs.
Fig. 4
Fig. 4
Effects of EVs on restoration of structure and function in irradiated SGs. (A) Experimental timeline illustrating radiation exposure and subsequent treatment with PBS or EVs. Mice were sacrificed at 2 and 12 weeks post-radiation to evaluate acute and long-term effects. (B) Average body weight of mice treated with PBS, 2D-EVs, 3DPLGA-EVs, 3DWNT-EVs, or sham. (C) Images of extirpated SMGs at 12 weeks post-radiation in mice treated with PBS, 2D-EVs, 3DPLGA-EVs, 3DWNT-EVs, or Sham. (D) SMG weight, (E) saliva production ratio, and (F) lag time were observed at 2 and 12 weeks post-radiation. (G) Histological analysis of SMGs at 12 weeks post-radiation. H&E staining for structure, PAS staining for mucin, and MTC staining for fibrosis. Sham group served as a baseline for normal histological appearance. (H) Quantification of histological changes, including acinoductal structure damage (SG damage score), mucin deposition (mucin area), and fibrosis area, in EV-treated groups compared to sham and PBS groups. Individual data points represent biological (i.e., individual mice) or technical replicates, per group ranging from 3 to 10. Error bars indicate standard deviation (SD). To compare groups, we used one-way ANOVA with Tukey post-hoc test; ∗compared with PBS; #compared with 2D-EVs; $compared with 3DPLGA-EVs. ∗p < 0.05, ∗∗p < 0.01, ∗∗∗p < 0.001, #p < 0.05, ##p < 0.01, and $p < 0.05.
Fig. 5
Fig. 5
Effect of EVs on PI3K-AKT pathway and cell survival in irradiated SGs. (A) Immunohistochemistry images of p-PI3K and p-AKT of SMG tissues at 2 weeks after irradiation and treatment with PBS or EVs. The sham group served as a control. (B) TUNEL staining to detect apoptotic cells in SMG tissues at 2 weeks post-irradiation and PBS or EV treatment. Scale bar = 50 μm. Quantification of p-PI3K and p-AKT expression (C) and TUNEL + cells from (D). (E) Immunofluorescence staining for KRT5 (basal ductal cells), KRT7 (luminal ductal cells), PROL1 (secretory epithelial cells), AQP5 (pro-acinar cells), ACTA2 (myoepithelial cells), and BHLHA15 (mature acinar cells and progenitors) in SMG tissues at two weeks post-irradiation and PBS or EV treatment. Scale bar = 100 μm. (F) Quantification of KRT5, KRT7, ACTA2, PROL1, AQP5, and BHLHA15 expression. Individual data points represent biological or technical replicates, per group ranging from 5 to 12. Error bars indicate SD. To compare groups, we used one-way ANOVA with Tukey post-hoc test; ∗compared with PBS; #compared with 2D-EVs; $compared with 3DPLGA-EVs. ∗p < 0.05, ∗∗∗p < 0.001, #p < 0.05, ###p < 0.001, and $$$p < 0.001.
Fig. 6
Fig. 6
Impact of 3DWNT-EVs on AKT pathway modulation in SG organoids (A) Bright-field microscopy images of mouse SGOs under different conditions: Sham, PBS, 2D-EVs, 3DPLGA-EVs, and 3DWNT-EVs, following radiation exposure. Apoptotic cells are marked with a red arrow. Scale bar = 100 μm. (B) Size of mouse SGOs, cell viability, mucin area in EV-treated groups compared with the Control and PBS groups. (C) LC-MS analysis of EVs. The volcano plot displays the relative abundance of exosomal proteins in 3DPLGA-EVs and 3DWNT-EVs. (D) Immunofluorescence staining of YWHAZ expression in mouse SGOs treated with different EVs. Scale bar = 50 μm. (E) Quantification of YWHAZ+ area mouse SGOs treated with different EV forms. Individual data points represent biological or technical replicates, per group ranging from 3 to 9. Error bars indicate SD. To compare groups, we used one-way ANOVA with Tukey post-hoc test; ∗compared with PBS; #compared with 2D-EVs; $compared with 3DPLGA-EVs. ∗p < 0.05, ∗∗p < 0.01, ∗∗∗p < 0.001, ##p < 0.01, ###p < 0.001, $p < 0.05, and $$$p < 0.001. (F) Western blot analysis of mouse SGOs following radiation, 3DWNT-EVs treatment, and 10 μM of LY294002 (PI3K inhibitor that suppresses AKT phosphorylation). Phospho-AKT, AKT, phosphor-P53, P53, BCL-2, and cleaved caspase 3 expression levels are shown. β-Actin was used as a loading control.
Fig. 7
Fig. 7
Functional validation of YWHAZ as a key effector in 3DWNT-EV-mediated restoration of irradiated mouse SGOs. (A) Representative bright-field, H&E, and PAS images of SGOs under five conditions: untreated (Control), irradiated + PBS (PBS), irradiated + 3DWNT-EVs derived from sgEpSCs transfected with YWHAZ siRNA (YWHAZ siRNA-EVs), irradiated + 3DWNT-EVs derived from sgEpSCs transfected with scrambled siRNA (scrambled siRNA-EVs), and irradiated + 3DWNT-EVs (3DWNT-EVs). SGOs treated with PBS or YWHAZ siRNA-EVs exhibited smaller size and cystic morphology, while those treated with scrambled siRNA-EVs or 3DWNT-EVs showed regenerative end-bud structures. H&E staining showed keratin pearl-like structures in the PBS group, while PAS staining revealed mucin recovery in all EV-treated groups, with greater intensity in scrambled and 3DWNT-EV conditions. Scale bars, 100 μm. (B) Representative immunofluorescence images of phosphorylated AKT (p-AKT) in SGOs under each treatment condition. SGOs treated with 3DWNT-EVs or scrambled siRNA-EVs showed elevated p-AKT levels compared to the PBS and YWHAZ siRNA-EVs groups. DAPI was used for nuclear counterstaining. Scale bars, 100 μm. (C) Cell viability, size of mouse SGOs and mucin area in EV-treated groups compared with the control and PBS groups. (D) Quantification of p-AKT+ in SGOs shown in (B). Individual data points represent biological or technical replicates, per group ranging from 3 to 9. Error bars indicate SD. Statistical significance was determined using one-way ANOVA followed by Tukey's post hoc test. ∗p < 0.05, ∗∗p < 0.01, ∗∗∗p < 0.001.

Similar articles

References

    1. Atkinson J.C., Wu A.J. Salivary-gland dysfunction - causes, symptoms, treatment. J. Am. Dent. Assoc. 1994;125(4):409–416. doi: 10.14219/jada.archive.1994.0059. - DOI - PubMed
    1. Yamauchi Y., Matsuno T., Omata K., Satoh T. Relationship between hyposalivation and oxidative stress in aging mice. J. Clin. Biochem. Nutr. 2017;61(1):40–46. doi: 10.3164/jcbn.16-79. - DOI - PMC - PubMed
    1. Miletich I. Introduction to salivary glands: structure, function and embryonic development. Front Oral Biol. 2010;14:1–20. doi: 10.1159/000313703. - DOI - PubMed
    1. Johnson J., Shojaee M., Mitchell Crow J., Khanabdali R. From mesenchymal stromal cells to engineered extracellular vesicles: a new therapeutic paradigm. Front. Cell Dev. Biol. 2021;9 doi: 10.3389/fcell.2021.705676. - DOI - PMC - PubMed
    1. Han Y., Yang J., Fang J., Zhou Y., Candi E., Wang J., Hua D., Shao C., Shi Y. The secretion profile of mesenchymal stem cells and potential applications in treating human diseases. Signal Transduct. Targeted Ther. 2022;7(1):92. doi: 10.1038/s41392-022-00932-0. - DOI - PMC - PubMed

LinkOut - more resources