

Transcriptomic analysis and machine learning modeling identifies novel biomarkers and genetic characteristics of hypertrophic cardiomyopathy
- PMID: 40599543
- PMCID: PMC12209200
- DOI: 10.3389/fgene.2025.1596049
Transcriptomic analysis and machine learning modeling identifies novel biomarkers and genetic characteristics of hypertrophic cardiomyopathy
Abstract
Objective: This study aimed to leverage bioinformatics approaches to identify novel biomarkers and characterize the molecular mechanisms underlying hypertrophic cardiomyopathy (HCM).
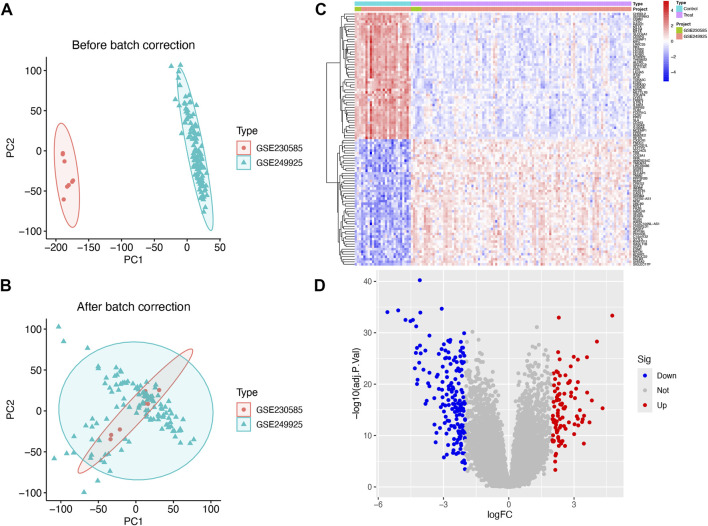
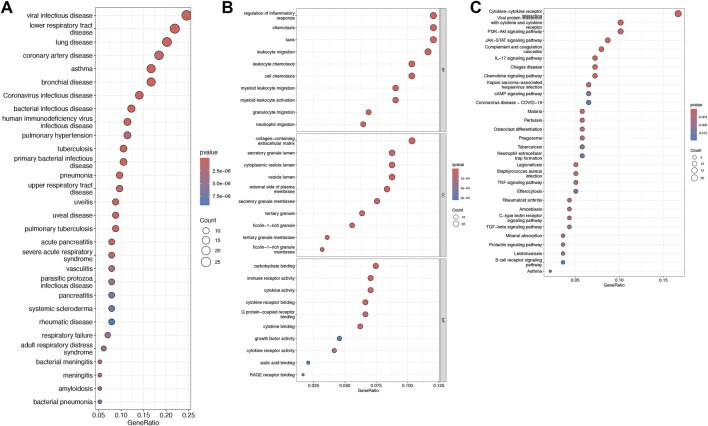
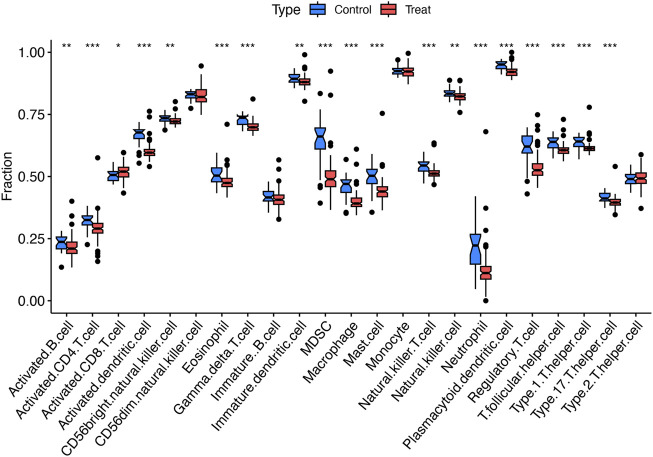
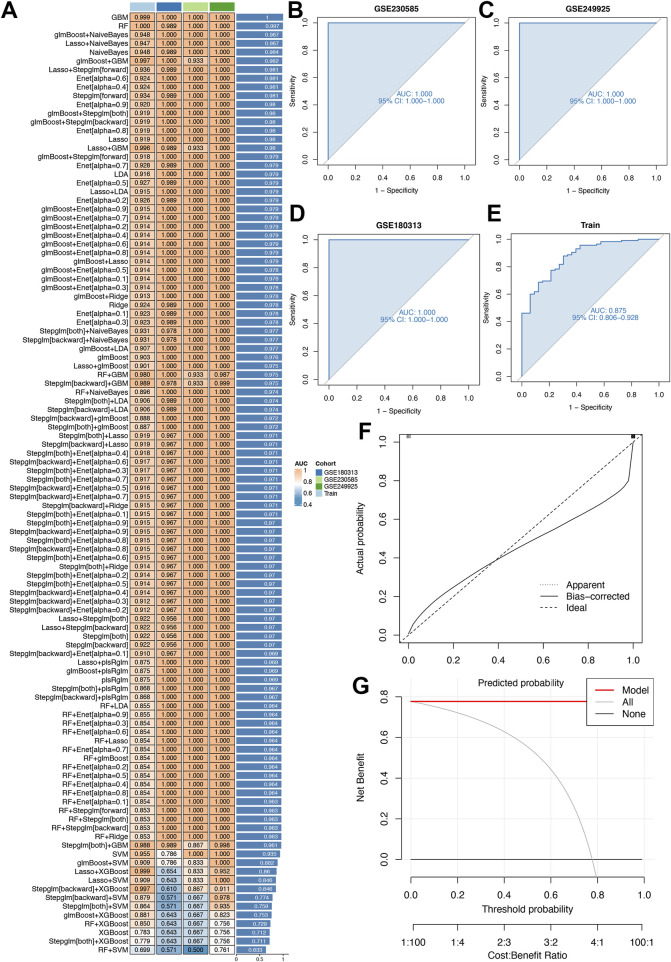
Methods: Two RNA-sequencing datasets (GSE230585 and GSE249925) were obtained from the Gene Expression Omnibus (GEO) repository. Computational analysis was performed to compare transcriptomic profiles between normal cardiac tissues from healthy donors and myocardial tissues from HCM patients. Functional annotation of differentially expressed genes (DEGs) was performed using Gene Ontology (GO) and Kyoto Encyclopedia of Genes and Genomes (KEGG) enrichment analyses. Immune cell infiltration patterns were quantified via single-sample gene set enrichment analysis (ssGSEA). A predictive model for HCM was developed through systematic evaluation of 113 combinations of 12 machine-learning algorithms, employing 10-fold cross-validation on training datasets and external validation using an independent cohort (GSE180313).
Results: A total of 271 DEGs were identified, primarily enriched in multiple biological pathways. Immune infiltration analysis revealed distinct patterns of immune cell composition. Based on the top differentially expressed genes, a robust 12-gene diagnostic signature (COMP, SFRP4, RASD1, IL1RL1, S100A8, S100A9, ESM1, CA3, MYL1, VGLL2, MCEMP1, and MT1A) was constructed, demonstrating superior performance in both training and testing cohorts.
Conclusion: This study utilized bioinformatics approaches to analyze RNA-sequencing datasets, identifying DEGs and distinct immune infiltration patterns in HCM. These findings enabled the construction of a 12-gene diagnostic signature with robust predictive performance, thereby advancing our understanding of HCM's molecular biomarkers and pathogenic mechanisms.
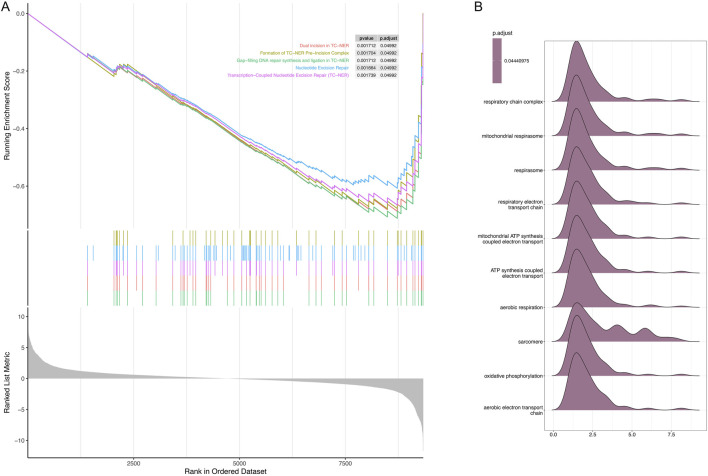
Keywords: DNA repair; RNA sequencing; biomarker; gene expression; gene expression omnibus; hypertrophic cardiomyopathy; machine learning.
Copyright © 2025 Zhang, Li and Zhang.
Conflict of interest statement
The author declares that the research was conducted in the absence of any commercial or financial relationships that could be construed as a potential conflict of interest.
Figures
Similar articles
-
Deciphering Shared Gene Signatures and Immune Infiltration Characteristics Between Gestational Diabetes Mellitus and Preeclampsia by Integrated Bioinformatics Analysis and Machine Learning.Reprod Sci. 2025 Jun;32(6):1886-1904. doi: 10.1007/s43032-025-01847-1. Epub 2025 May 15. Reprod Sci. 2025. PMID: 40374866
-
Machine learning and bioinformatics analysis to identify and validate diagnostic model associated with immune infiltration in rheumatoid arthritis.Clin Rheumatol. 2025 Jul;44(7):2683-2694. doi: 10.1007/s10067-025-07514-9. Epub 2025 Jun 11. Clin Rheumatol. 2025. PMID: 40500570
-
Identification of marker genes associated with oxidative stress in hypertrophic cardiomyopathy using bioinformatics analysis and experimental validation.Sci Rep. 2025 Aug 6;15(1):28817. doi: 10.1038/s41598-025-14313-4. Sci Rep. 2025. PMID: 40770404 Free PMC article.
-
Generalizable machine learning for stress monitoring from wearable devices: A systematic literature review.Int J Med Inform. 2023 May;173:105026. doi: 10.1016/j.ijmedinf.2023.105026. Epub 2023 Feb 28. Int J Med Inform. 2023. PMID: 36893657
-
Cost-effectiveness of using prognostic information to select women with breast cancer for adjuvant systemic therapy.Health Technol Assess. 2006 Sep;10(34):iii-iv, ix-xi, 1-204. doi: 10.3310/hta10340. Health Technol Assess. 2006. PMID: 16959170
References
LinkOut - more resources
Full Text Sources
Miscellaneous