. 2025 Jun 19.
doi: 10.1039/d5md00359h. Online ahead of print.

Structure-guided design of a methyltransferase-like 3 (METTL3) proteolysis targeting chimera (PROTAC) incorporating an indole-nicotinamide chemotype

Affiliations

Structure-guided design of a methyltransferase-like 3 (METTL3) proteolysis targeting chimera (PROTAC) incorporating an indole-nicotinamide chemotype

Annabelle C Weldert et al. RSC Med Chem. .

Abstract

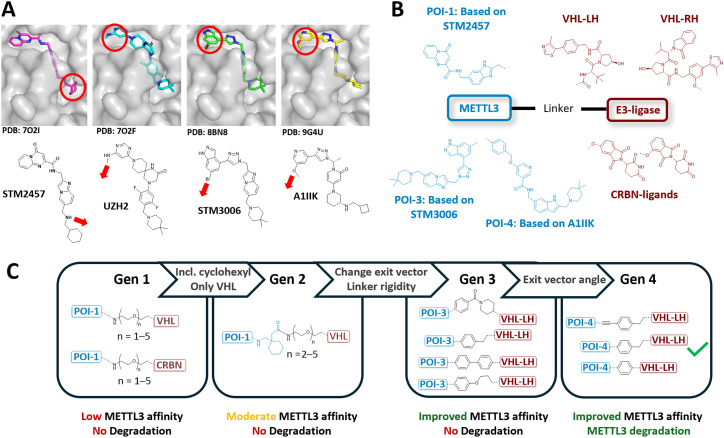
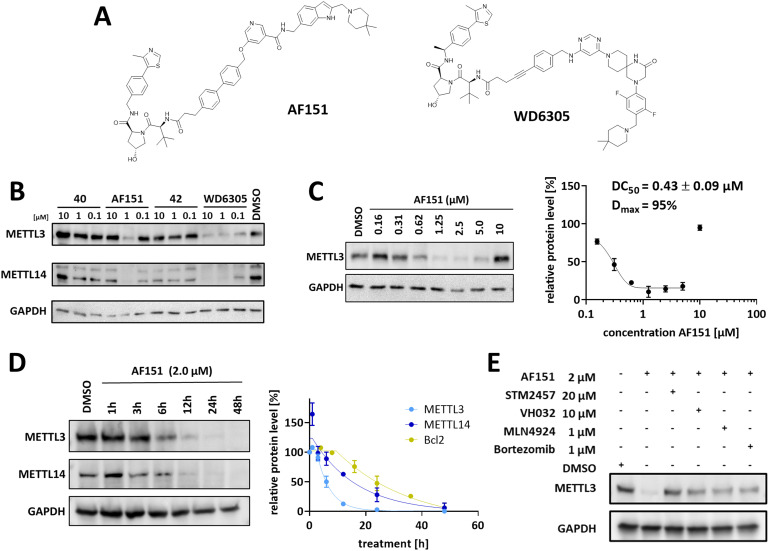
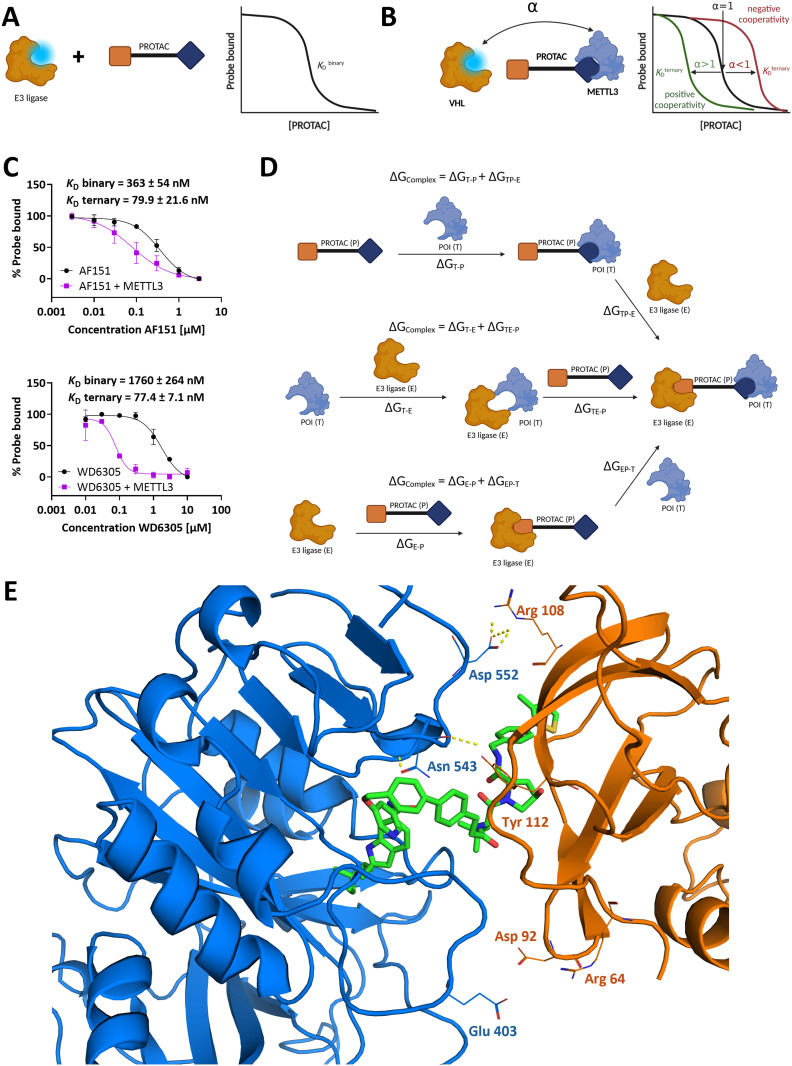
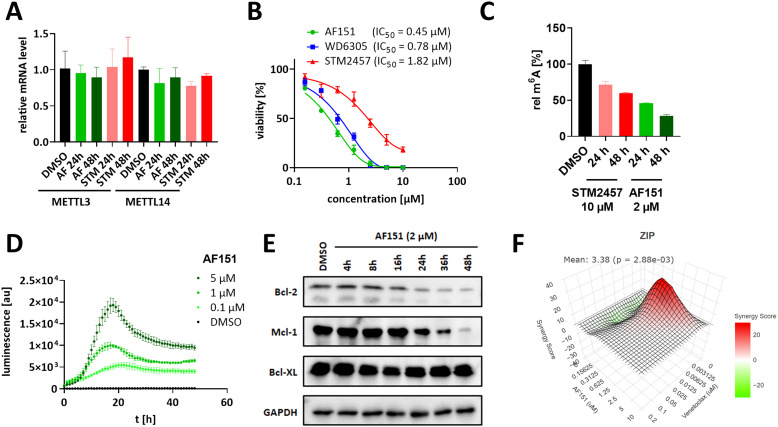
Methyltransferase-like 3 (METTL3) is the main catalytic subunit of the m6A methyltransferase complex (MTC) and plays an essential role in various disease indications, including acute myeloid leukemia (AML). Here, we describe the structure-guided design and evaluation of METTL3 proteolysis-targeting chimeras (PROTACs), starting from the potent small-molecule inhibitor STM2457. Across four design generations, we highlight key considerations, particularly regarding the exit vector, linker mechanics, and METTL3-binding chemotype composition. Our most effective PROTAC, AF151, forms a stable complex between the E3 ligase von Hippel-Lindau (VHL) and the target-of-interest METTL3, demonstrating efficient METTL3 degradation (DC50 = 430 nM) in the AML cell line MOLM-13. This molecule candidate exhibits more pronounced effects on viability inhibition (IC50 = 0.45 μM) and more significant m6A level reduction in cancer cells than its non-PRTOAC parent compounds. By incorporating the indole-nicotinamide chemotype as the METTL3-binding recruiter, this PROTAC is structurally distinct from recently published METTL3 PROTACs, expanding the design options for future METTL3 degrader development.


Conflict of interest statement

There are no conflicts of interest to declare.

Figures

Fig. 1
Fig. 1. Development pipeline of PROTACs targeting METTL3. (A) Crystal structures of various METTL3-targeting small-molecule inhibitor complexes: STM2457 (PDB: 7O2I), UZH2 (PDB: 7O2F), STM3006 (PDB: 8BN8), and A1IIK (PDB: 9G4U), showing solvent-exposed regions and thereby possible exit vectors for linker attachment sides. (B) General design and selected structures of our METTL3 PROTAC strategy, including METTL3 and E3 ligase binding moieties used in this study. (C) Structural representation of METTL3 PROTAC development across four generations, specifying changes made between each generation.
Fig. 2
Fig. 2. Cellular characterization of METTL3 PROTAC AF151. (A) Structures of AF151 and reference degrader WD6305, developed by Du et al. (B) Western blots of PROTAC screening results analyzing the fourth generation of our PROTAC design. MOLM-13 cells were treated with the indicated compounds at different concentrations (10 μM, 1 μM, and 0.1 μM) for 16 h. WD6305 and DMSO were used as positive and negative controls. (C) Dose–response experiments and DC50 determination for AF151 in MOLM-13 cells. Left: Western blot image after treatment at the indicated concentrations for 16 h. Right: Dose–response curve with different AF151 concentrations plotted against METTL3 protein levels relative to the DMSO control. (D) Time course treatment experiments. Left: Western blot image after treatment with AF151 at 2 μM at the indicated time points. Right: Time-response curve with different time points plotted against METTL3, METTL14, and Bcl-2 protein levels relative to the DMSO control. (E) Cellular PROTAC competition assay. MOLM-13 cells were treated with AF151 in combination with the METTL3 inhibitor STM2457, VH032, MLN4924, or bortezomib at the indicated concentrations. Uncropped Western blot images can be found in Fig. S8–S11.
Fig. 3
Fig. 3. Investigation of ternary complex formation and cooperativity for AF151 and WD6305. (A and B) A fluorescent displacement probe binds to the E3 ligase and is displaced upon PROTAC molecule binding. The FP level of the displaced probe was used to determine the dissociation constant of PROTAC binding. Cooperativity is evaluated by comparing the PROTAC's affinity for the E3 ligase in the presence and the absence of METTL3. (C) Cooperativity factor (α) determination for AF151 and WD6305 binding in the presence (purple) and absence (black) of METTL3 (12 μM). Each data point represents the mean ± SEM from triplicates repeated in two independent experiments. (D) Possible binary and ternary interactions between PROTAC (P), E3-ligase (E), and the protein of interest (target, T) can be described using Gibbs free energy (ΔG) for each interaction. The overall Gibbs free energy change for the formation of the ternary complex can be determined in three equivalent ways: ΔGcomplex = ΔGT–P + ΔGTP–E = ΔGE–P + ΔGEP–T = ΔGT–E + ΔGTE–P. (E) Most stable predicted binding mode for AF151 in a ternary METTL3-VCB complex. The proteins are portrayed as cartoons, with the amino acids commonly found in protein–protein interactions across all simulations labeled as lines. Polar protein–protein interactions are shown as dashed yellow lines, and AF151 is shown as green sticks. METTL3: blue, VHL: orange.
Fig. 4
Fig. 4. Evaluation of AF151 in MOLM-13 cells. (A) Relative METTL3 and METTL14 mRNA levels (ΔΔCt) after treatment with AF151 (2 μM) or STM2457 (10 μM) for 24 h resp. 48 h. (B) Cell viability inhibition after treatment with varying concentrations of AF151, WD6305, and STM2457. (C) m6A quantification of total mRNA isolated from MOLM-13 cells after treatment with AF151 (2 μM) or STM2457 (10 μM) for the indicated durations. (D) Real-time apoptosis assay (homogeneous luminogenic annexin V binding assay). MOLM-13 cells were treated with AF151 at the indicated concentrations, and apoptosis was monitored via luminescence over 48 h. (E) Time course treatment experiment of Bcl-like proteins performed analogously to Fig. 2D. Western blot image after treatment with AF151 at 2 μM at the indicated time points. The corresponding time-response plot can be found in Fig. 2D. (F) Zero interaction potency (ZIP) analysis of co-treatment (72 h) with AF151 and venetoclax in MOLM-13 cells. Quantification and illustration were generated with the SynergyFinder+ webserver.

Similar articles

References

    1. Boccaletto P. Stefaniak F. Ray A. Cappannini A. Mukherjee S. Purta E. Kurkowska M. Shirvanizadeh N. Destefanis E. Groza P. Avşar G. Romitelli A. Pir P. Dassi E. Conticello S. G. Aguilo F. Bujnicki J. M. Nucleic Acids Res. 2022;50:D231–D235. - PMC - PubMed
    1. Zhou J. Wan J. Gao X. Zhang X. Jaffrey S. R. Qian S.-B. Nature. 2015;526:591–594. - PMC - PubMed
    1. Chen J. Wang C. Fei W. Fang X. Hu X. Am. J. Cancer Res. 2019;9:752–764. - PMC - PubMed
    1. Wang Y. Li Y. Toth J. I. Petroski M. D. Zhang Z. Zhao J. C. Nat. Cell Biol. 2014;16:191–198. - PMC - PubMed
    1. Yang Y. Hsu P. J. Chen Y.-S. Yang Y.-G. Cell Res. 2018;28:616–624. - PMC - PubMed

LinkOut - more resources