

Comparative study of flow rate- and material-dependent human plasma protein adsorption on oxygenator membranes and heat exchanger materials
- PMID: 40599623
- PMCID: PMC12211862
- DOI: 10.3389/fcvm.2025.1578538
Comparative study of flow rate- and material-dependent human plasma protein adsorption on oxygenator membranes and heat exchanger materials
Abstract
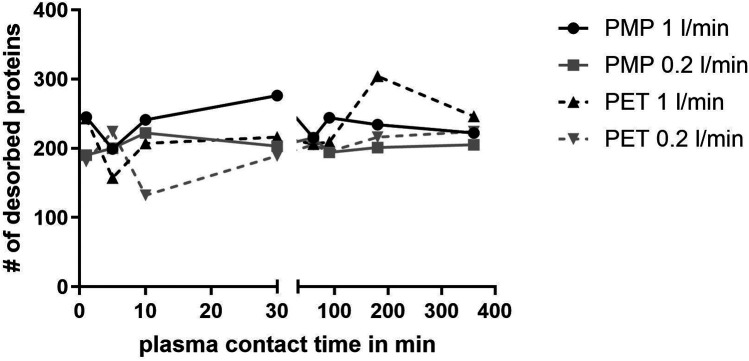
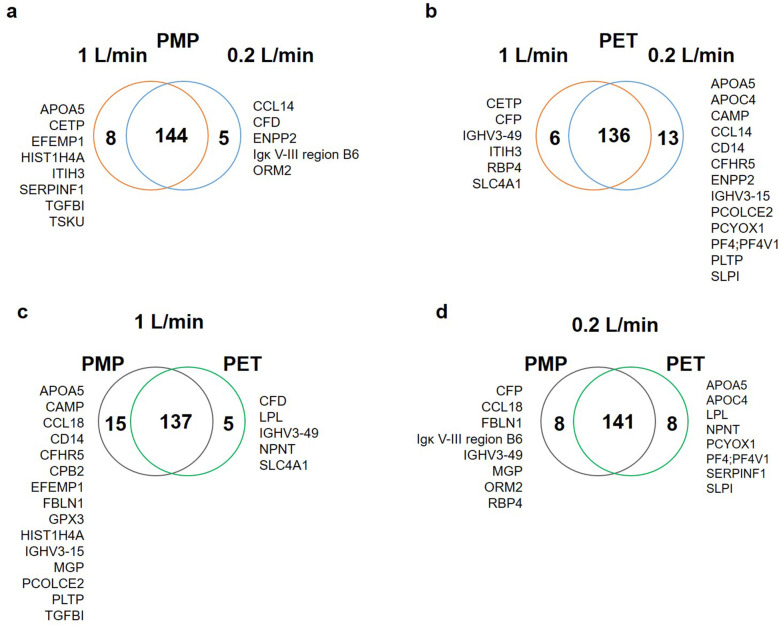
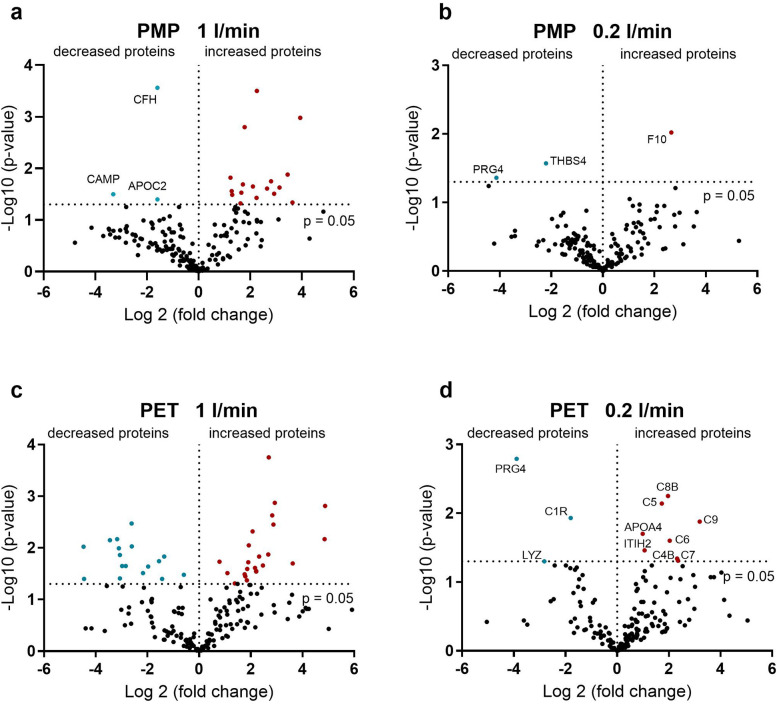
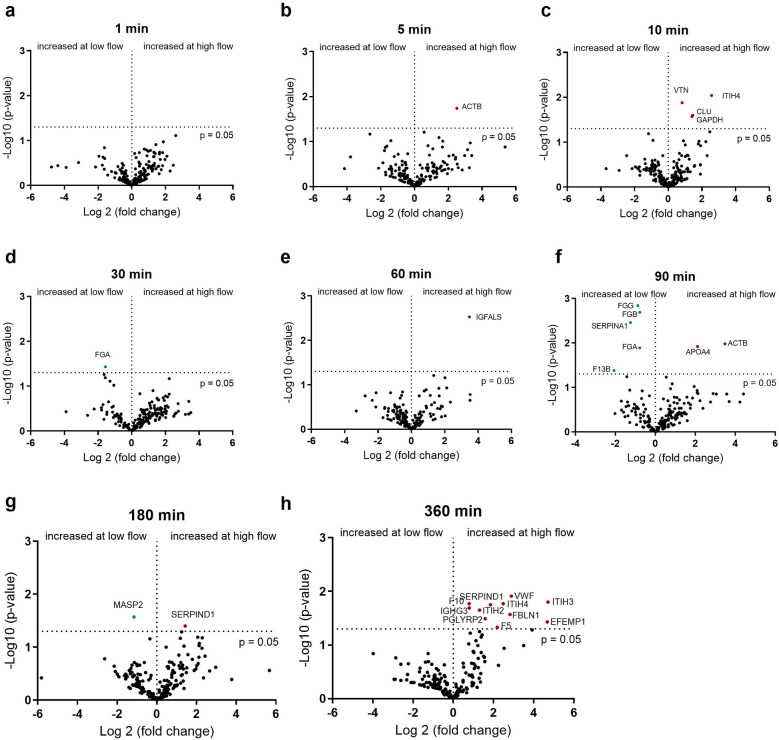
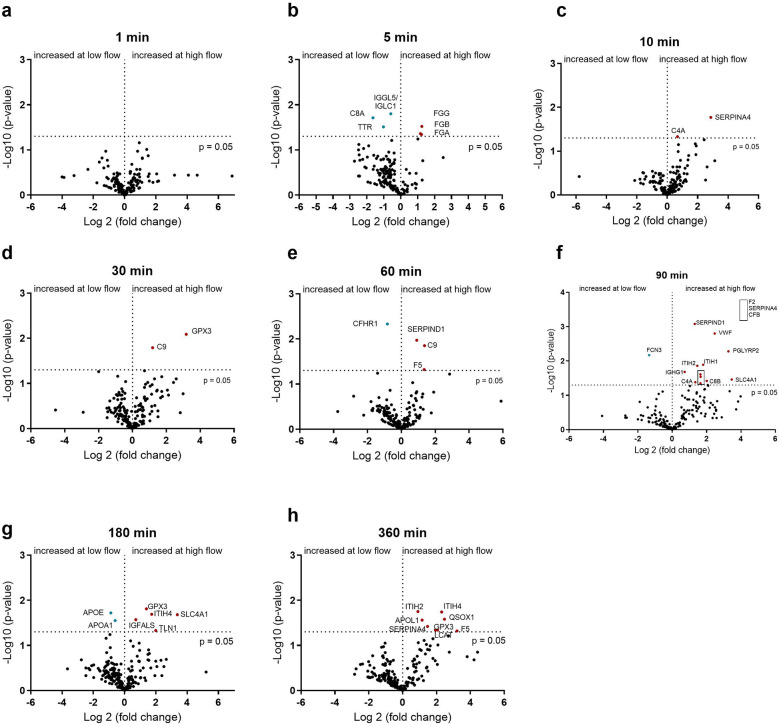
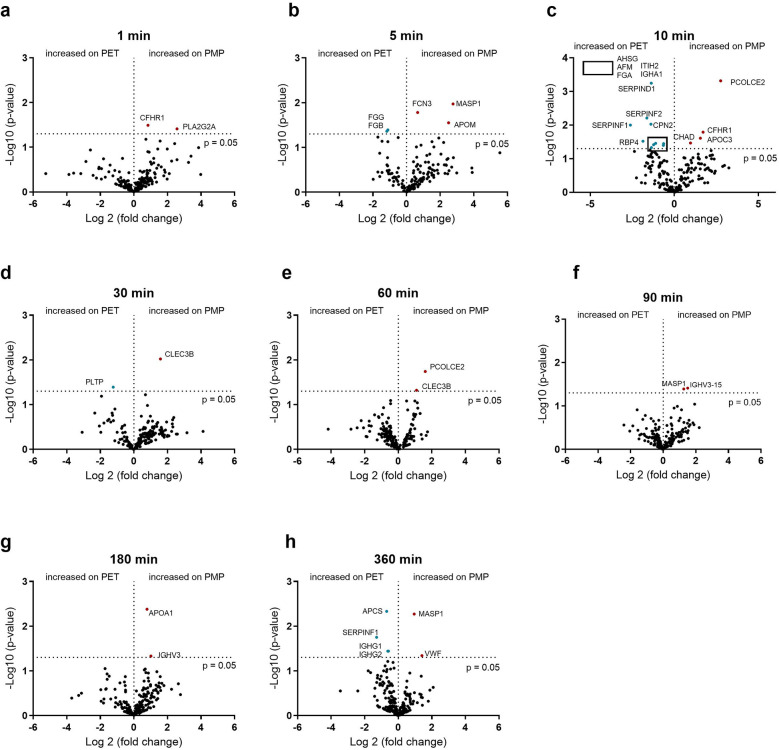
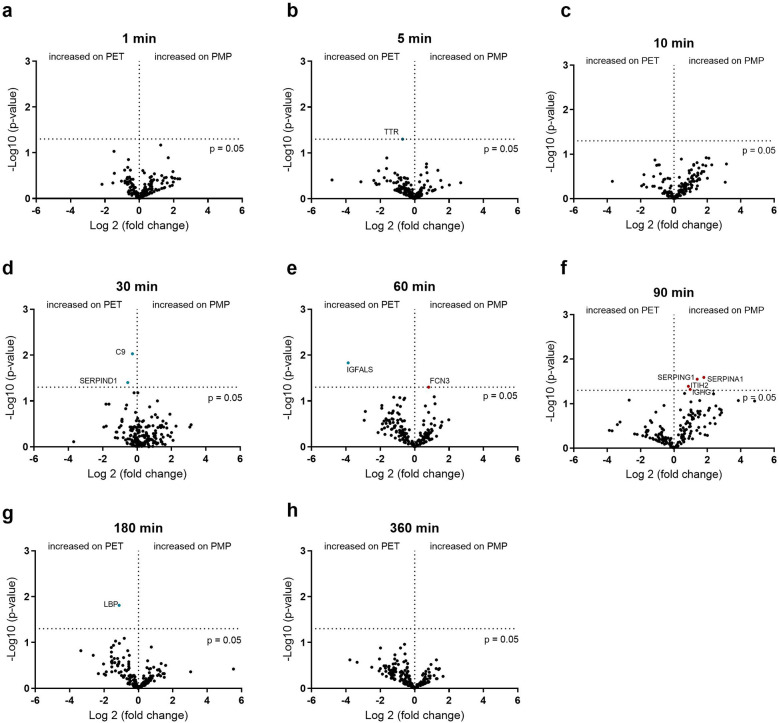
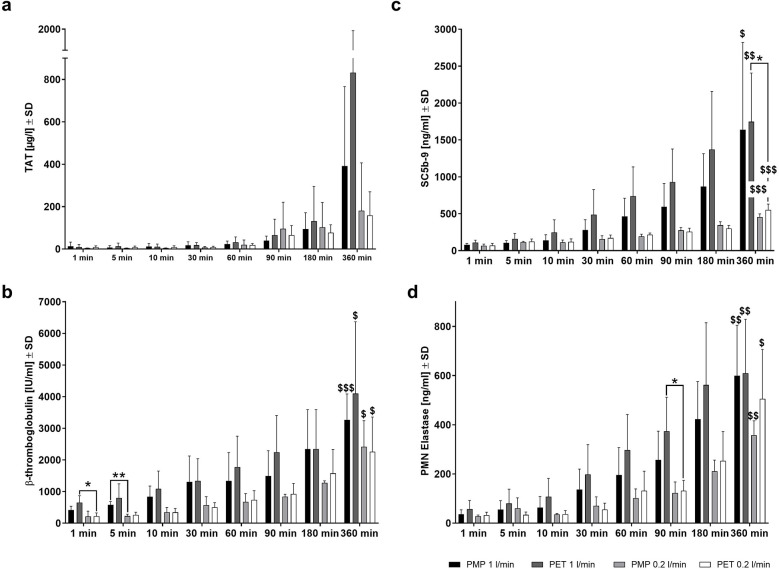
Artificial lungs support patients with acute or chronic lung diseases. However, complications such as the activation of blood components leading to thrombosis and inflammation limit their long-term applicability. The systematic characterization of protein adhesion events on different material parts of the oxygenators at different flow rates can shed light on the initial reaction of blood to foreign materials. Miniaturized extracorporeal circuit devices with heparin-coated gas (PMP) or heat-exchange (PET) hollow-fiber membranes were exposed to high and low flow rates. Hemocompatibility and adsorption of plasma proteins were measured after one minute to six hours using mass spectroscopy analyses. Approximately 150-200 different proteins were present on the membranes, with almost no variation in the 10 most abundant proteins. Protein adsorption to the membrane types did not vary to a large extent, but a decreased flow rate significantly reduced the differences in protein adsorption between both membrane types and led to the adhesion of significantly higher amounts of inhibitory proteins C1INH and α1-AT. At the higher flow rate, coagulation-associated proteins adsorbed significantly more to PET membranes, whereas complement-activating-related proteins adsorbed more on PMP membranes. Our results highlight the importance of analyzing all circuit components to understand the activation of blood components during ECMO. The primary contributor to increased protein adsorption and activation of blood components was an increased flow rate. Therefore, flow rate adjustments should ideally aim to achieve optimal oxygenation levels of around 80% while minimizing protein adsorption and blood activation during ECMO. Notably, at a low flow rate, PMP HFM exhibited a significant increase in binding of complement and inflammation inhibitors, suggesting a potential benefit of lowering the flow rate apart from the general reduction in protein adsorption.
Keywords: ECMO; PET; PMP; hemocompatibility; heparin-coating; hollow fiber membrane; plasma protein adsorption.
© 2025 Große-Berkenbusch, Avci-Adali, Cahalan, Cahalan, Velic, Maček, Schlensak, Wendel and Stoppelkamp.
Conflict of interest statement
The DFG had no role in the design of the study; in the collection, analyses, or interpretation of data; in the writing of the manuscript, or in the decision to publish the results. PC and LC are employees of Ension, Inc. The remaining authors declare that the research was conducted in the absence of any commercial or financial relationships that could be construed as a potential conflict of interest.
Figures
Similar articles
-
Antiretrovirals for reducing the risk of mother-to-child transmission of HIV infection.Cochrane Database Syst Rev. 2011 Jul 6;(7):CD003510. doi: 10.1002/14651858.CD003510.pub3. Cochrane Database Syst Rev. 2011. PMID: 21735394
-
Antiretrovirals for reducing the risk of mother-to-child transmission of HIV infection.Cochrane Database Syst Rev. 2007 Jan 24;(1):CD003510. doi: 10.1002/14651858.CD003510.pub2. Cochrane Database Syst Rev. 2007. Update in: Cochrane Database Syst Rev. 2011 Jul 06;(7):CD003510. doi: 10.1002/14651858.CD003510.pub3. PMID: 17253490 Updated.
-
Systemic pharmacological treatments for chronic plaque psoriasis: a network meta-analysis.Cochrane Database Syst Rev. 2021 Apr 19;4(4):CD011535. doi: 10.1002/14651858.CD011535.pub4. Cochrane Database Syst Rev. 2021. Update in: Cochrane Database Syst Rev. 2022 May 23;5:CD011535. doi: 10.1002/14651858.CD011535.pub5. PMID: 33871055 Free PMC article. Updated.
-
Systemic pharmacological treatments for chronic plaque psoriasis: a network meta-analysis.Cochrane Database Syst Rev. 2017 Dec 22;12(12):CD011535. doi: 10.1002/14651858.CD011535.pub2. Cochrane Database Syst Rev. 2017. Update in: Cochrane Database Syst Rev. 2020 Jan 9;1:CD011535. doi: 10.1002/14651858.CD011535.pub3. PMID: 29271481 Free PMC article. Updated.
-
Comparison of cellulose, modified cellulose and synthetic membranes in the haemodialysis of patients with end-stage renal disease.Cochrane Database Syst Rev. 2001;(3):CD003234. doi: 10.1002/14651858.CD003234. Cochrane Database Syst Rev. 2001. Update in: Cochrane Database Syst Rev. 2005 Jul 20;(3):CD003234. doi: 10.1002/14651858.CD003234.pub2. PMID: 11687058 Updated.
References
-
- Firstenberg MS. Extracorporeal Membrane Oxygenation: Advances in Therapy. Rijeka: BoD–Books on Demand; (2016).
-
- Marcum JA, Rosenberg RD. The biochemistry and physiology of anticoagulantly active heparin-like molecules. In: Simionescu N, Simionescu M, editors. Endothelial Cell Biology in Health and Disease. Boston, MA: Springer; (1988). 10.1007/978-1-4613-0937-6_10 - DOI
LinkOut - more resources
Full Text Sources