. 2025 Jun 17:6:1609961.
doi: 10.3389/froh.2025.1609961. eCollection 2025.

Sociodemographic inequalities in the global burden trends and machine learning-based projections of periodontitis from 1990 to 2030 across different development levels

Affiliations

Sociodemographic inequalities in the global burden trends and machine learning-based projections of periodontitis from 1990 to 2030 across different development levels

Amr Sayed Ghanem et al. Front Oral Health. .

Abstract

Introduction: Oral diseases affect billions globally, with periodontitis contributing to significant health disparities and systemic conditions like diabetes and cardiovascular diseases.

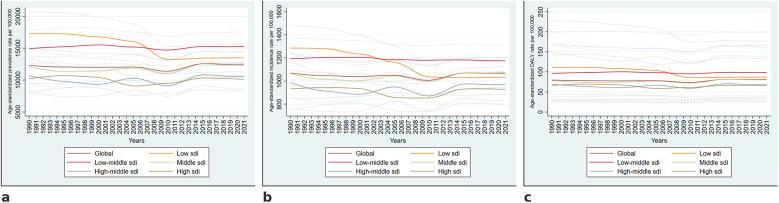
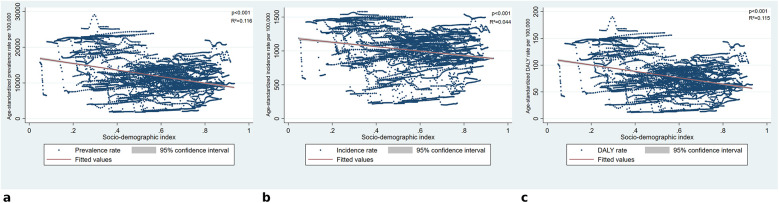
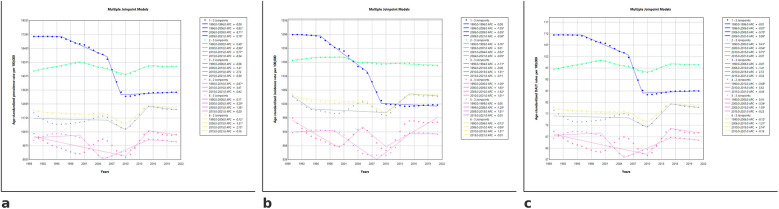
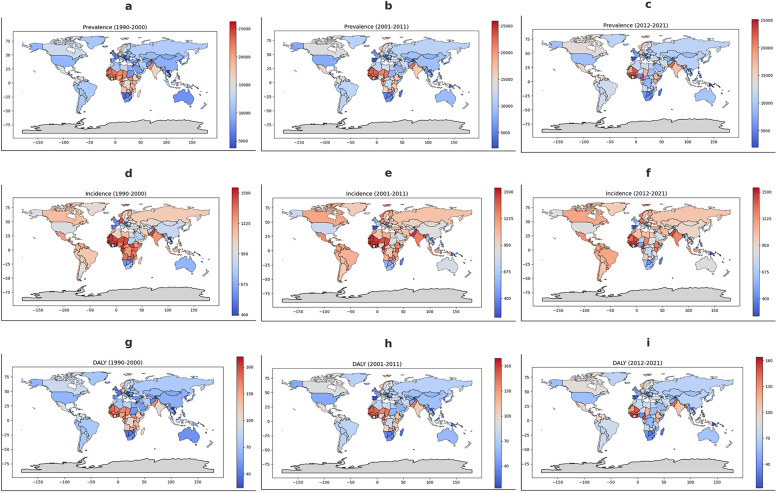
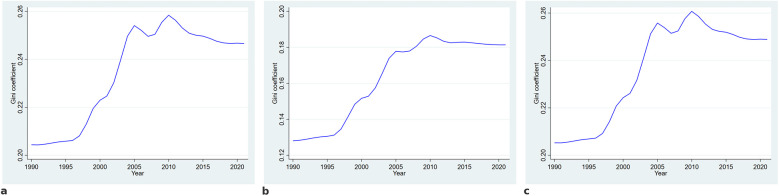
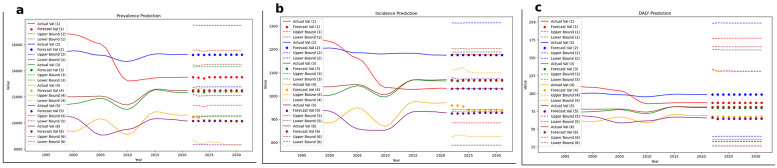
Methods: This study utilized the GBD 2021 dataset to assess the global burden of periodontitis across 204 countries, analyzing prevalence, incidence, and DALY rates. Socioeconomic disparities were examined using the Sociodemographic Index (SDI) and Gini coefficient, while time-series analysis, regression models, and Joinpoint regression identified trends. Machine learning predicted future burden, and geospatial mapping visualized global distribution.

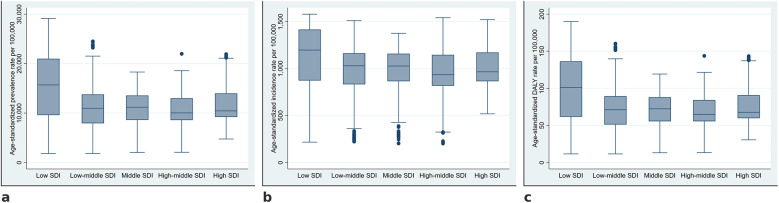
Results: Periodontitis burden remains highest in low-SDI regions, with significantly greater prevalence, incidence, and DALY rates compared to higher-SDI countries (p < 0.001). Global trends showed a decline until 2010 (AAPC: ASPR -0.792%, ASIR -0.719%, DALY -0.794%; all p < 0.05), followed by a temporary increase before stabilizing. Disparities widened over time, peaking around 2010. Projections suggest persistent inequalities, with low-SDI regions maintaining the highest burden and minimal expected reductions, while higher-SDI countries exhibit stable, lower rates.

Conclusion: Despite global declines, periodontitis disparities have widened, with low-SDI regions facing the highest burden and minimal improvements. Without strong public health policies integrating preventive oral health into diseases management, inequalities will persist, worsening systemic health outcomes. Urgent action is needed to ensure universal access to periodontal care and early interventions, especially in low-resource settings.

Keywords: disease burden; global burden of disease; inequalities; joinpoint regression; oral cavity; periodontal disease; periodontitis; sociodemographic.


Conflict of interest statement

The authors declare that the research was conducted in the absence of any commercial or financial relationships that could be construed as a potential conflict of interest.

Figures

Figure 1
Figure 1
Temporal trends in the burden of periodontitis from 1990 to 2021. Global and SDI-stratified trends in age-standardized prevalence (a), incidence (b), and DALY rates (c) per 100,000 population from 1990 to 2021. Solid lines represent estimates, and dotted lines indicate 95% uncertainty intervals.
Figure 2
Figure 2
Distribution of age-standardized prevalence, incidence, and DALY rates of periodontitis across socio-demographic Index categories. Boxplots illustrate the distribution of age-standardized prevalence (a), incidence (b), and DALY rates (c) of periodontitis across the five SDI categories.
Figure 3
Figure 3
Association between socio-demographic Index and periodontitis burden. (a) Presents the relationship between SDI and age-standardized prevalence rates, (b) shows SDI against age-standardized incidence rates, and Panel c illustrates SDI vs. age-standardized DALY rates. Linear regression lines indicate a negative association across all measures, with statistically significant results (p < 0.001). R-squared values suggest that SDI accounts for a limited proportion of the variance, with the strongest association observed for prevalence (R2 = 0.116) and DALYs (R2 = 0.115), while incidence had the lowest explanatory power (R2 = 0.044).
Figure 4
Figure 4
Joinpoint regression models for age-standardized prevalence, incidence, and DALY rates of periodontitis (1990–2021) across SDI categories. The figures illustrate joinpoint regression trends in the age-standardized prevalence (a), incidence (b), and DALY rates (c) of periodontitis from 1990 to 2021 across different SDI categories. Each segment represents a distinct trend period, with corresponding Annual Percentage Change (APC) values. Asterisks (*) indicate statistically significant trends (p < 0.05). SDI categories are coded as follows in the software: 1 = Low SDI, 2 = Low-middle SDI, 3 = Middle SDI, 4 = High-middle SDI, 5 = High SDI, and 6 = Global.
Figure 5
Figure 5
Geographical distribution of periodontitis burden from 1990 to 2021. The figure presents the geographical distribution of periodontitis burden from 1990 to 2021. (a–c) Show the average age-standardized prevalence rates per 100,000 for 1990–2000, 2001–2011, and 2012–2021, respectively. (d–f) Depict incidence rates per 100,000 for the same periods, while (g–i) illustrate disability-adjusted life years (DALY) per 100,000. Color gradients indicate burden levels, with red shades representing higher rates and blue shades indicating lower rates, as shown in the corresponding scale bars. Gray areas denote missing or unavailable data.
Figure 6
Figure 6
Trends in the gini coefficient for age-standardized prevalence (a), incidence (b), and disability-adjusted life years (c) of periodontitis from 1990 to 2021. The Gini coefficient was computed to assess global inequalities in periodontitis burden across countries. A higher Gini coefficient indicates greater disparity.
Figure 7
Figure 7
Projected trends in age-standardized prevalence, incidence, and DALY rates of periodontitis until 2030 across SDI categories. (a–c) depict projections for prevalence, incidence, and DALY rates, respectively, modeled until 2030. Solid lines represent historical trends, while dots indicate forecasted values. Dotted lines denote upper and lower confidence bounds. SDI categories are coded as follows: 1 = Low SDI, 2 = Low-middle SDI, 3 = Middle SDI, 4 = High-middle SDI, 5 = High SDI, 6 = Global estimate.

Similar articles

References

    1. Global Oral Health status Report: Towards Universal Health Coverage for Oral Health by 2030. Geneva: World Health Organization; (2022). Licence: CC BY-NC-SA 3.0 IGO.
    1. GBD 2017 Oral Disorders Collaborators. Global, regional, and national levels and trends in burden of oral conditions from 1990 to 2017: a systematic analysis for the global burden of disease 2017 study. J Dent Res. (2020) 99(4):362–73. 10.1177/0022034520908533 - DOI - PMC - PubMed
    1. Vos T, Lim SS, Abbafati C, Abbas KM, Abbasi M, Abbasifard M, et al. Global burden of 369 diseases and injuries in 204 countries and territories, 1990–2019: a systematic analysis for the global burden of disease study 2019. Lancet. (2020) 396(10258):1204–22. 10.1016/S0140-6736(20)30925-9 - DOI - PMC - PubMed
    1. Gasner NS, Schure RS. Periodontal disease. In: Schure RS, editor. StatPearls. Treasure Island, FL: StatPearls Publishing; (2025). Available at: http://www.ncbi.nlm.nih.gov/books/NBK554590/ (Accessed March 08 2025) - PubMed
    1. Pihlstrom BL, Michalowicz BS, Johnson NW. Periodontal diseases. Lancet. (2005) 366(9499):1809–20. 10.1016/S0140-6736(05)67728-8 - DOI - PubMed

LinkOut - more resources