Review
. 2025 May 23:18:100454.
doi: 10.1016/j.jpi.2025.100454. eCollection 2025 Aug.

Advancing open-source visual analytics in digital pathology: A systematic review of tools, trends, and clinical applications

Affiliations
Review

Advancing open-source visual analytics in digital pathology: A systematic review of tools, trends, and clinical applications

Zahoor Ahmad et al. J Pathol Inform. .

Abstract

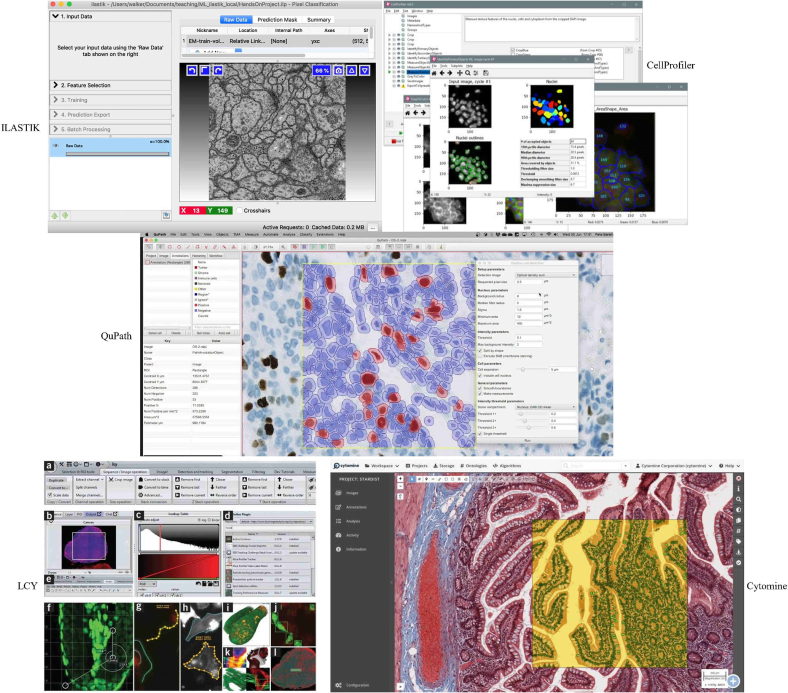
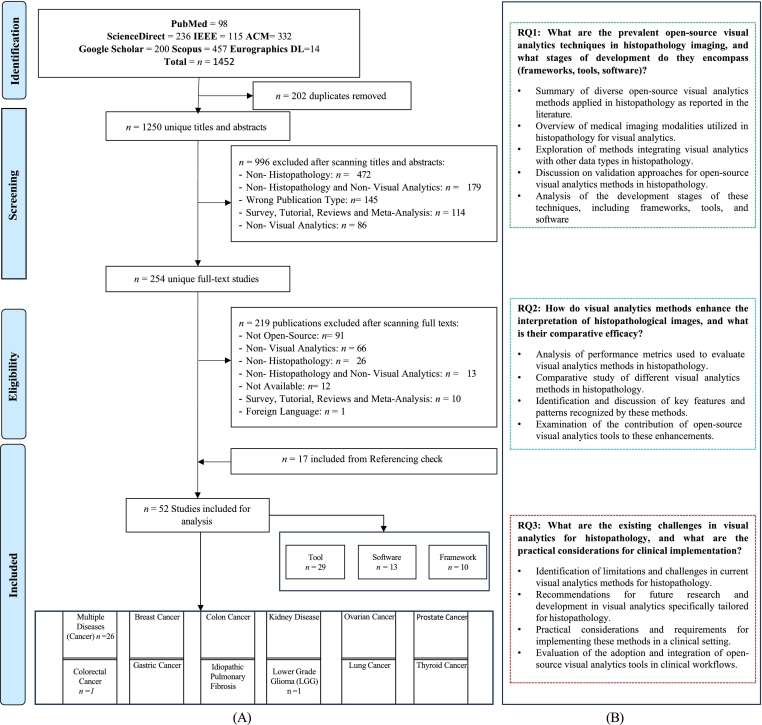
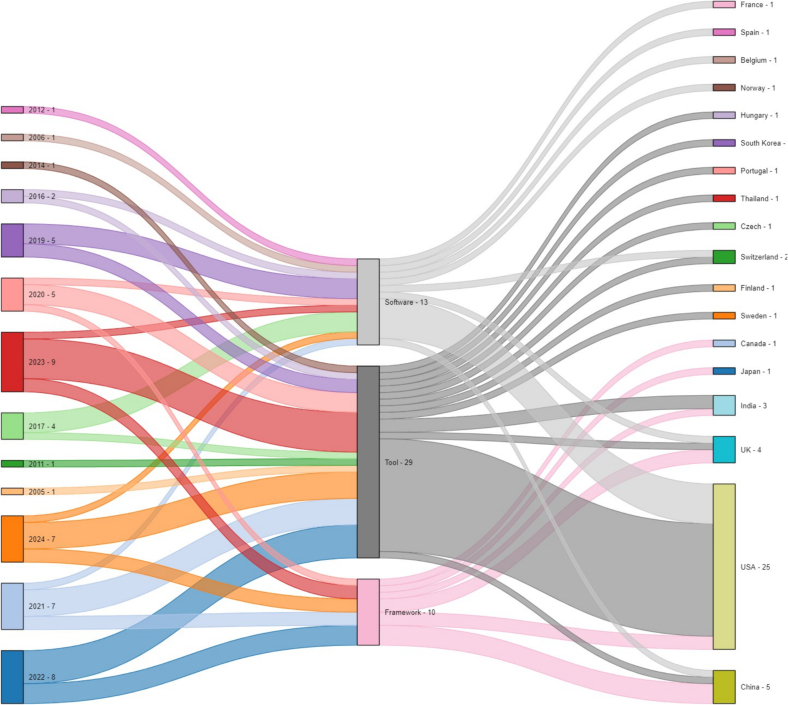
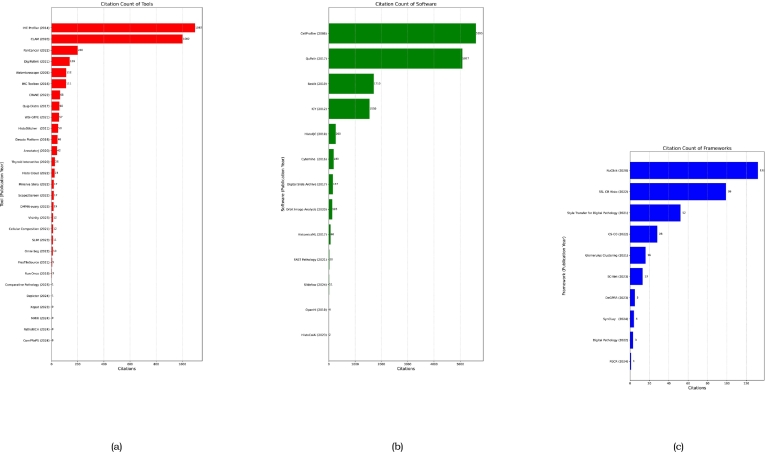
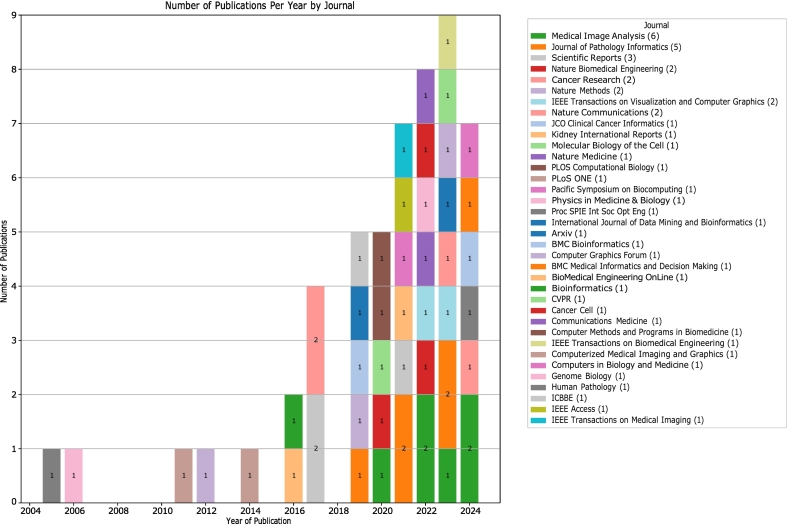
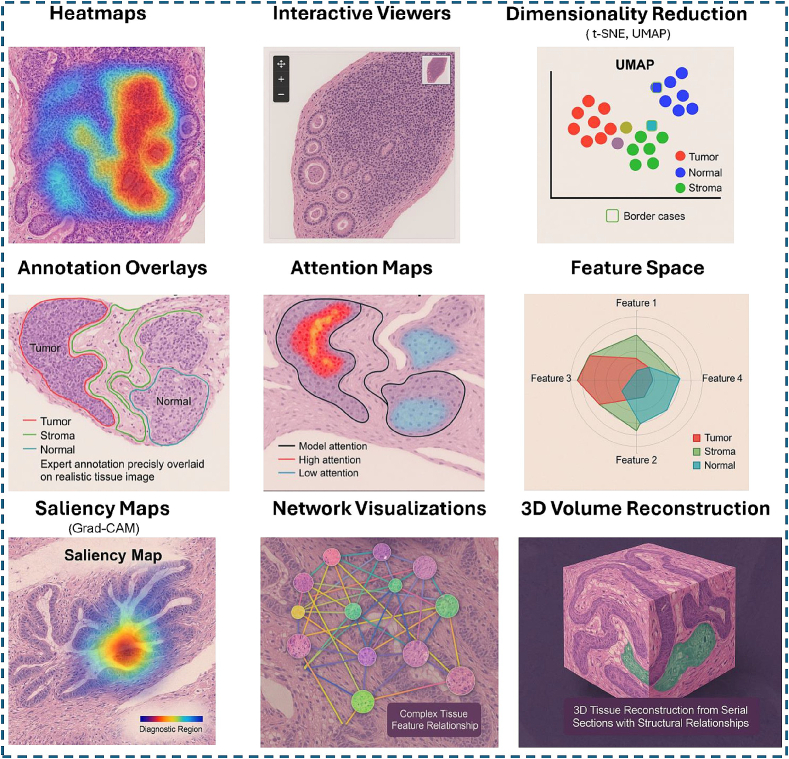
Histopathology is critical for disease diagnosis, and digital pathology has transformed traditional workflows by digitizing slides, enabling remote consultations, and enhancing analysis through computational methods. In this systematic review, we evaluated open-source visual analytics abilities in digital pathology by screening 254 studies and including 52 that met predefined criteria. Our analysis reveals that these solutions-comprising abilities (n = 29), software (n = 13), and frameworks (n = 10)-are predominantly applied in cancer research (e.g., breast, colon, ovarian, and prostate cancers) and primarily utilize whole slide images. Key contributions include advanced image analysis capabilities (as demonstrated by platforms such as QuPath and CellProfiler) and the integration of machine learning for diagnostic support, treatment planning, automated tissue segmentation, and collaborative research. Despite these promising advancements, challenges such as high computational demands, limited external validation, and difficulties integrating into clinical workflows remain. Future research should focus on establishing standardized validation frameworks, aligning with regulatory requirements, and enhancing user-centric designs to promote robust, interoperable solutions for clinical adoption.

Keywords: Cancer research; Clinical implementation; Computational pathology; Digital pathology; Histopathology; Image analysis; Machine learning in pathology; Open-source; Visual analytics; Whole slide imaging.


Conflict of interest statement

The authors declare that they have no known competing financial interests or personal relationships that could have appeared to influence the work reported in this article.

Figures

Fig. 1
Fig. 1
Representative open source software tools for visual analytics in digital pathology. This figure illustrates five prominent tools: QuPath, Ilastik, CellProfiler, ICY, and Cytomine, showcasing the diverse capabilities available in open source digital pathology software.
Fig. 2
Fig. 2
Overview of the study selection process and research questions. (A) PRISMA flow diagram of study selection process for open source visual analytics in histopathology. (B) Research questions posed.
Fig. 3
Fig. 3
Distribution of open source visual analytics studies in histopathology by type, year (2006–2024), and country, showing trends and geographical research efforts.
Fig. 4
Fig. 4
Bibliometric analysis of tools (A), software (B), and framework (C). The y-axis indicates the year and name, whereas the x-axis shows the number of citations.
Fig. 5
Fig. 5
Temporal distribution of publications in open source visual analytics for histopathology by journal and conference (2004–2024).
Fig. 6
Fig. 6
This figure illustrates common approaches reported in Table 7, showcasing nine distinct visualization methods: Heatmaps: displaying spatial distribution of cancer probability across tissue structures. Interactive viewers: enabling multi-resolution WSI exploration with navigation tools. Dimensionality reduction techniques (t-SNE, UMAP): revealing tissue type clustering patterns. Annotation overlays: precisely marking tumor, stroma, and immune components. Attention maps: highlighting cellular structures of model focus. Feature space visualization: comparing multi-dimensional tissue characteristics. Saliency maps (including Grad-CAM): identifying diagnostically relevant regions. Network visualizations: displaying weighted relationships between tissue components. 3D volume reconstruction: showing structural relationships across tissue sections. These complementary visualization approaches support interpretation of complex histopathological data.

References

    1. Titford M. A short history of histopathology technique. J Histotechnol. 2006;29(2):99–110. doi: 10.1179/his.2006.29.2.99. - DOI
    1. van der Laak J., Litjens G., Ciompi F. Deep learning in histopathology: the path to the clinic. Nat Med. 2021;27(5):775–784. doi: 10.1038/s41591-021-01343-4. - DOI - PubMed
    1. Al-Janabi S., Huisman A., Van Diest P.J. Digital pathology: current status and future perspectives. Histopathology. 2012;61(1):1–9. doi: 10.1111/j.1365-2559.2011.03814.x. - DOI - PubMed
    1. Banerji S., Mitra S. Deep learning in histopathology: a review, WIREs. Data Min Knowl Disc. 2022;12(1) doi: 10.1002/widm.1439. - DOI
    1. Heinz C.N., Echle A., Foersch S., Bychkov A., Kather J.N. The future of artificial intelligence in digital pathology-results of a survey across stakeholder groups. Histopathology. 2022;80(7):1121–1127. doi: 10.1111/his.14659. - DOI - PubMed

LinkOut - more resources