. 2025 Jun 20;23(2):72.
doi: 10.3892/mco.2025.2867. eCollection 2025 Aug.

Nuclear factor IA-mediated transcriptional regulation of crystallin αB inhibits hepatocellular carcinoma progression

Affiliations

Nuclear factor IA-mediated transcriptional regulation of crystallin αB inhibits hepatocellular carcinoma progression

Yun Jin et al. Mol Clin Oncol. .

Abstract

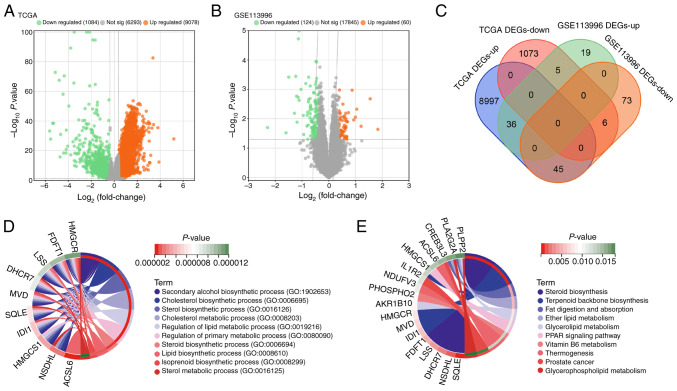
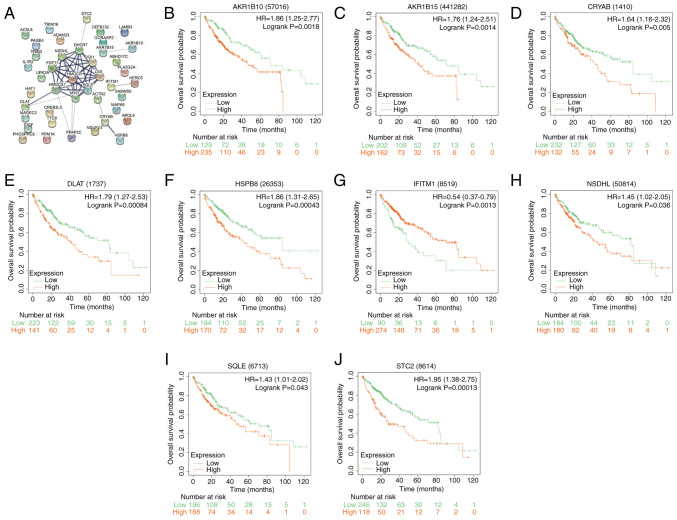
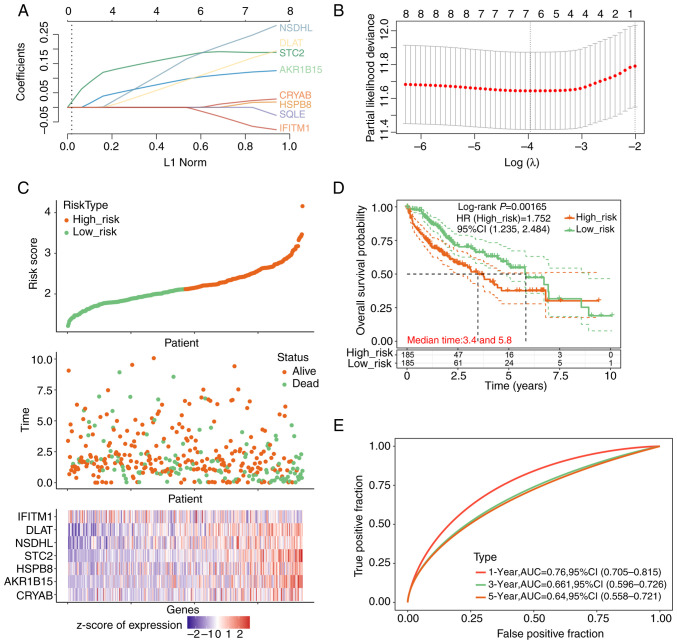
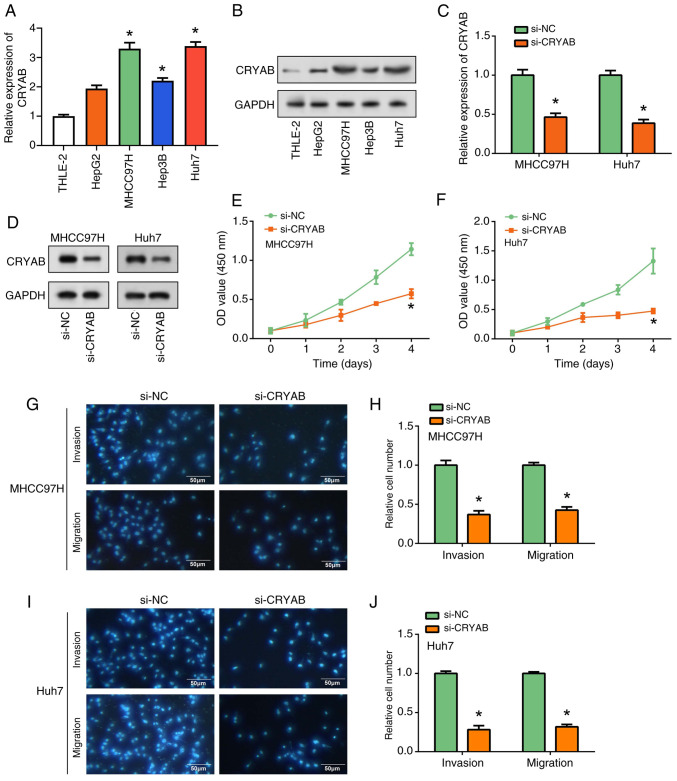
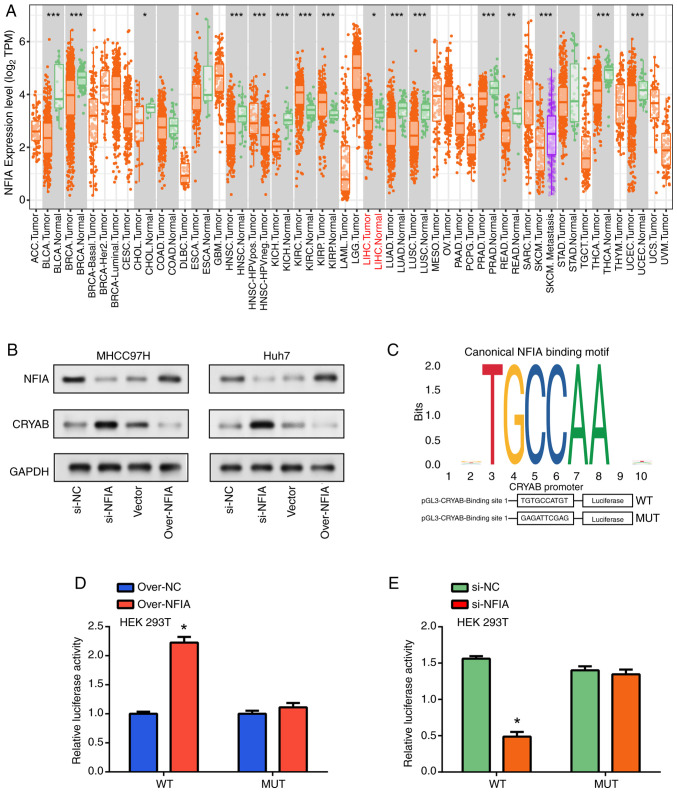
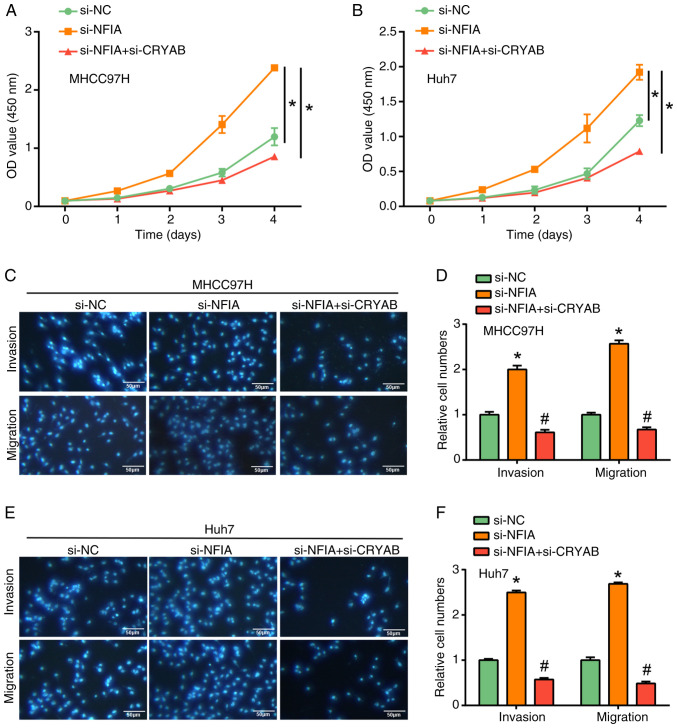
Hepatocellular carcinoma (HCC) is a highly invasive malignant tumor with limited therapeutic options. In the present study, bioinformatics analysis, including differential expression analysis, functional enrichment, protein-protein interaction network construction, survival analysis and risk model evaluation, identified CRYAB as a central prognostic gene in HCC. Additionally, motif analysis using JASPAR revealed nuclear factor IA (NFIA), as a potential transcriptional regulator of CRYAB. Further in vitro experiments were conducted to explore the roles of CRYAB and NFIA in HCC, suggesting that these molecules may serve as promising therapeutic targets for future research. Differentially expressed genes (DEGs) from the Cancer Genome Atlas-liver hepatocellular carcinoma (LIHC) and GSE113996 datasets were identified using the 'limma' package, with Biological Process and Kyoto Encyclopedia of Genes and Genomes enrichment analysis conducted. Overlapping DEGs underwent Protein-protein interaction and prognostic analysis. Key prognostic genes were selected through Kaplan-Meier survival analysis and Least Absolute Shrinkage and Selection Operator regression before they were incorporated into a predictive risk model, which was evaluated by receiver operating characteristic analysis. JASPAR motif analysis identified NFIA as a potential transcriptional regulator of CRYAB, with the TIMER database used to further examine the NFIA expression profile among other cancers. In vitro assays using MHCC97H and Huh7 cells were used to examine the roles of CRYAB and NFIA in HCC. Cell counting kit-8 (CCK-8) assay was used to assess proliferation, whilst Transwell assay was used to measure migration and invasion. To investigate the reciprocal regulation, rescue experiments combining NFIA overexpression and CRYAB knockdown were performed to compare their effects on cell proliferation, migration and invasion. Additionally, dual-luciferase assay was used to examine the regulatory effect of NFIA on the CRYAB promoter by comparing the wild-type and mutant constructs. Bioinformatics analyses revealed CRYAB to be a hub gene. CRYAB upregulation was found to be associated with poor prognosis in patients with LIHC. In vitro, elevated CRYAB expression was observed in HCC cell lines compared with that in the huma liver immortalized cell line THLE-2. CRYAB knockdown was found to significantly inhibit MHCC97H and Huh7 cell proliferation, migration and invasion. By contrast, NFIA expression was found to be downregulated in LIHC compared with that in normal liver tissues, where its expression showed an inverse association with that of CRYAB. Direct interaction between NFIA and the CRYAB promoter region was confirmed through dual-luciferase assays. Furthermore, low NFIA expression markedly enhanced HCC cell proliferation, invasion and migration. This pro-tumor effect was reversed in the si-NFIA + si-CRYAB group, where simultaneous downregulation of CRYAB significantly reduced cell proliferation, migration and invasion, suggesting that CRYAB downregulation can counteract the effects induced by low NFIA expression. To conclude, these results suggest that NFIA can inhibit the malignant proliferation of HCC cells by activating CRYAB expression, which further suggest that CRYAB and NFIA are promising avenues for the development of novel HCC treatment strategies.

Keywords: crystallin αB; hepatocellular carcinoma; in vitro evaluation; nuclear factor IA; transcriptional regulation.


Conflict of interest statement

The authors declare that they have no competing interests.

Figures

Figure 1
Figure 1
Comprehensive analysis of differentially expressed genes and pathway enrichment. Volcano maps of DEGs based on the (A) TCGA and (B) GSE113996 datasets. Gray scatter points represent genes with insignificant differences in expression, whilst orange and green scatter points represent genes with significant differences in expression. X-axis shows log2 fold-change and Y-axis shows -log10 P-value. (C) Venn diagram showing the overlapping DEGs between TCGA-LIHC and GSE113996 datasets. Chord diagram showing enrichment analysis of (D) BP and (E) KEGG. The right ring of the outermost circle shows 10 BP terms, each term is identified by a color. The left ring of the outermost circle shows the gene column, the gradient color indicates the gene differential expression fold change. Inner circles show associations between genes and terms. BP, biological process; DEGs, differentially expressing genes; TCGA, The Cancer Genome Atlas; up, upregulated; down, downregulated.
Figure 2
Figure 2
PPI network analysis and prognostic significance of overlapping genes in liver cancer. (A) PPI network representation of 42 overlapping genes. Nodes represent proteins or protein domains, while edges represent interactions between these proteins, with edge thickness representing the confidence of the interaction. Kaplan-Meier survival curves for the identified prognostically significant genes: (B) AKR1B10, (C) AKR1B15, (D) CRYAB, (E) DLAT, (F) HSPB8, (G) IFITM1, (H) NSDHL, (I) SQLE and (J) STC2. The x-axis represents survival time in months and the y-axis represents survival probability. HR represents the risk of an event in the high-risk group compared to the low-risk group. Log-rank P-value indicates the statistical significance of the difference in survival between high-risk and low-risk groups. PPI, protein-protein interaction; HR, hazard ratio; AKR1B10, aldo-keto reductase family 1, member B10; AKR1B15, aldo-keto reductase 1B15; CRYAB, Crystallin αB; DLAT, dihydrolipoamide S-acetyltransferase; HSPB8, heat shock protein family B member 8; IFITM1, interferon induced transmembrane protein 1; NSDHL, NAD(P)-dependent steroid dehydrogenase-like; SQLE, squalene epoxidase; STC2, stanniocalcin 2.
Figure 3
Figure 3
Risk prediction model analysis and characterization of prognostic genes. (A) LASSO regression analysis highlighting the coefficients of the eight prognosis-associated genes against the L1 Norm. (B) Cross-validation utilized for tuning parameter determination in the LASSO regression model. The x-axis represents the log(λ) value and the y-axis indicates partial likelihood deviance. (C) Risk score distribution of patients with liver cancer, segregated into low-risk and high-risk categories. The upper scatterplot elucidates the association between risk scores and patient survival status and duration. The lower plot shows a heatmap of z-scores of normalized expression levels of the prognostic genes across the risk stratifications. The x-axis in the upper scatterplot shows ‘patient’ identifiers, each representing an individual's risk score and survival data. In the lower heatmap below, the x-axis shows the ‘genes’ involved in liver cancer prognosis, with their expression levels depicted across the different risk categories. (D) Kaplan-Meier survival analysis contrasting the overall survival between low- and high-risk cohorts. The x-axis chronicles the time in years, whereas the y-axis plots the overall survival probability. (E) Receiver operating characteristic curves demonstrating the predictive performance of the prognostic signature at 1-year, 3-year, and 5-year intervals. HR, hazard ratio; AUC, area under the curve; LASSO, Least Absolute Shrinkage and Selection Operator; NSDHL, NAD(P)-dependent steroid dehydrogenase-like; IFITM1, interferon induced transmembrane protein 1; DLAT, dihydrolipoamide S-acetyltransferase; STC2, stanniocalcin 2; HSPB8, heat shock protein family B member 8; AKR1B15, aldo-keto reductase 1B15; CRYAB, crystallin αB.
Figure 4
Figure 4
Regulation of liver cancer cell proliferation, migration and invasion by CRYAB knockdown. (A) RT-qPCR and (B) WB analysis of CRYAB expression in THLE-2 cells and 4 liver cancer cell lines (HepG2, MHCC97H, Huh7 and Hep3B). *P<0.05 vs. THLE-2. (C) RT-qPCR and (D) WB were used to evaluate the efficiency of CRYAB knockdown in MHCC97H and Huh7 cells. *P<0.05 vs. THLE-2. Cell Counting Kit-8 assay of the effect of CRYAB knockdown on (E) MHCC97H and (F) cell proliferation. *P<0.05 vs. si-NC. Transwell assay to assess the effect of CRYAB knockdown on migration and invasion of (G) MHCC97H cells and (H) were semi-quantified (scale bars, 50 µm). Transwell assay to assess the effect of CRYAB knockdown on migration and invasion of (I) Huh7 cells and (J) were semi-quantified. *P<0.05 vs. si-NC. CRYAB, Crystallin αB; RT-qPCR, reverse transcription-quantitative PCR; WB, western blotting; si, small interfering; NC, negative control; OD, optical density.
Figure 5
Figure 5
NFIA activates CRYAB gene expression by binding to its promoter region. (A) Expression level analysis of NFIA in pan-cancer using TIMER database. *P<0.05, **P<0.01 and ***P<0.001. (B) Western blotting analysis of NFIA and CRYAB expression in liver cell lines after NFIA overexpression (using NFIA overexpression plasmid, labeled as ‘over-NFIA’) and knockdown. ‘Vector’ refers to the control plasmid used in the overexpression experiments, whilst ‘si-NC’ represents the negative control for siRNA knockdown experiments. (C) Upper figure shows JASPAR software detecting potential NFIA binding sites in the upstream genome sequence of the CRYAB coding region, lower figure shows the structure diagram of reporter genes based on the pGL3-Basic vector in luciferase detection. Dual-luciferase reporter assay in 293T cells measuring changes in wild-type and mutant luciferase activities after NFIA (D) overexpression or (E) knockdown. *P<0.05 vs. over-NC or si-NC. TPM, transcript per million; CRYAB, Crystallin αB; NFIA, nuclear factor IA; WT, wild-type; MUT, mutant; over-, overexpression plasmid; si-small interfering; NC, negative control.
Figure 6
Figure 6
Role of NFIA and CRYAB in liver cancer cell proliferation, migration and invasion. Cell Counting Kit-8 was used to measure (A) MHCC97H and (B) Huh7 cell proliferation after the knockdown of NFIA and/or CRYAB. *P<0.05 vs. si-NC. Transwell assay was used to measure cell migration and invasion after combined knockdown of NFIA and/or CRYAB in (C) MHCC97H cells, (D) which was semi-quantified. Transwell assay was used to measure cell migration and invasion after combined knockdown of NFIA and/or CRYAB in (E) Huh7 cells, (F) which was semi-quantified. Scale bars, 50 µm. *P<0.05 vs. si-NC. #P<0.05 vs. si-NFIA. CRYAB, Crystallin αB; NFIA, nuclear factor IA; si, small interferin; NC, negative control.

Similar articles

References

    1. Qiu S, Cai J, Yang Z, He X, Xing Z, Zu J, Xie E, Henry L, Chong CR, John EM, et al. Trends in Hepatocellular Carcinoma Mortality Rates in the US and Projections Through 2040. JAMA Netw Open. 2024;7(e2445525) doi: 10.1001/jamanetworkopen.2024.45525. - DOI - PMC - PubMed
    1. Giri S, Singh A. Epidemiology of Hepatocellular Carcinoma in India-An Updated Review for 2024. J Clin Exp Hepatol. 2024;14(101447) doi: 10.1016/j.jceh.2024.101447. - DOI - PMC - PubMed
    1. Hahn JW, Woo S, Park J, Lee H, Kim HJ, Ko JS, Moon JS, Rahmati M, Smith L, Jang J, et al. Global, Regional, and National Trends in Liver Disease-Related Mortality Across 112 Countries From 1990 to. 2021, With Projections to 2050: Comprehensive Analysis of the WHO Mortality Database. J Korean Med Sci. 2024;39(e292) doi: 10.3346/jkms.2024.39.e292. - DOI - PMC - PubMed
    1. Sagnelli E, Macera M, Russo A, Coppola N, Sagnelli C. Epidemiological and etiological variations in hepatocellular carcinoma. Infection. 2020;48:7–17. doi: 10.1007/s15010-019-01345-y. - DOI - PubMed
    1. McGlynn KA, Petrick JL, El-Serag HB. Epidemiology of hepatocellular carcinoma. Hepatology. 2021;73:4–13. doi: 10.1002/hep.31288. - DOI - PMC - PubMed

LinkOut - more resources