. 2025 Jun 17:16:1607247.
doi: 10.3389/fimmu.2025.1607247. eCollection 2025.

Interferons and Toxoplasma gondii shape PD-L1 regulation in retinal barrier cells: the critical role of proteases

Affiliations

Interferons and Toxoplasma gondii shape PD-L1 regulation in retinal barrier cells: the critical role of proteases

Benjamin Geiller et al. Front Immunol. .

Abstract

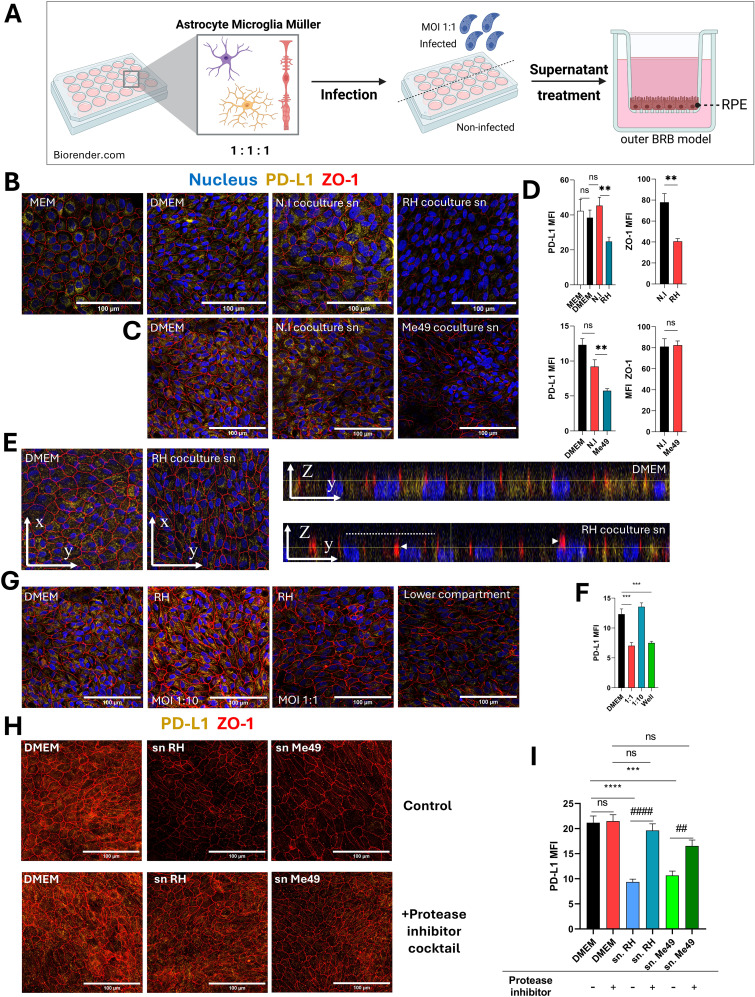
Introduction: The apicomplexan parasite Toxoplasma gondii establishes chronic infection in the central nervous system, including the retina, causing ocular toxoplasmosis (OT). This persistence relies on a fine balance between inflammatory and immunomodulatory mechanisms, especially in the immune-privileged ocular environment. We previously described the immunologic interactions between retinal cells, and particularly the roles of type I and III interferons. In this study, we investigated the regulatory dynamics of PD-L1, a central immunomodulatory receptor on immune cells.

Methods: We first investigated the mechanisms of PD-L1 regulation and the roles of type I and III interferons in an in vitro T. gondii infection model using mono- and co-culture systems of human microglia, astrocytes, and Müller cells. We also assessed PD-L1 expression in an outer blood-retina barrier model (oBRB) of differentiated retinal pigmented epithelial (RPE) cells. Additionally, we looked at retinal cell activation, PD-L1 expression and the roles of these interferons in a mouse model of OT.

Results: Our findings reveal new roles for type I and III interferons in regulating glial cell activation and PD-L1 expression in RPE, Müller, astrocytes and microglial cells. Notably, Müller cells, the most abundant glial cells in the retina, showed the highest baseline PD-L1 expression at both the mRNA and protein levels, and responded robustly to interferon stimulation. This points to a more prominent immunoregulatory role for Müller cells in the retina than previously recognized. Furthermore, we identified a parasite protease-dependent mechanism that reduces PD-L1 expression in our in vitro oBRB model potentially contributing to immune evasion and inflammation during OT. Finally, in a murine model of OT, we demonstrated that PD-L1 expression reached its peak on day 7 post-infection and that interferon neutralization plays a crucial role in regulating both PD-L1 expression and glial activation.

Discussion: The parasite T. gondii orchestrates the IFN type I and III dependent retinal immune interaction and downregulates PD-L1 in the oBRB by a protease-dependent mechanism, potentially contributing to immune evasion and inflammation in retinal infection. Our results can pave the way to fully elucidate retinal immune networks and PD-L1 regulation mechanisms, offering potential targets for therapeutic interventions in OT and other retinal inflammatory diseases.

Keywords: PD-L1; Toxoplasma gondii; immune privilege; interferons; ocular toxoplasmosis; retina.


Conflict of interest statement

The authors declare that the research was conducted in the absence of any commercial or financial relationships that could be construed as a potential conflict of interest. The author(s) declared that they were an editorial board member of Frontiers, at the time of submission. This had no impact on the peer review process and the final decision.

Figures

Figure 1
Figure 1
Modulation of PD-L1 mRNA and protein expression by T. gondii infection (A) Quantitative RT-qPCR analysis of PD-L1 mRNA expression levels in human microglia, astrocytes, Müller cells, and RPE cells following infection with Toxoplasma gondii RH or Me49 strains, or with 20 ng/mL IFN-γ. Data are presented as mean ± SEM of fold changes, normalized to the GAPDH housekeeping gene and to non-infected/non-stimulated controls. Results are pooled from three independent experiments, each with three replicates (n=9). Statistical analysis was performed using one-way ANOVA; *P < 0.05, **P < 0.01, ***P < 0.001, ****P < 0.0001 compared to control. (B) Western blot analysis showing PD-L1 and β-actin expression in membrane (m) and cytosolic (c) protein fractions isolated from human microglia, astrocytes, Müller cells, and RPE cells. (C) Western blot analysis of PD-L1 and β-actin expression in whole-cell lysates from human microglia, astrocytes, Müller cells, and RPE cells infected with T. gondii RH or Me49 strains (MOI 1:1). (D) Quantification of PD-L1 band intensity from western blots, normalized to β-actin and non-infected controls. Data are shown as mean ± SEM from three independent experiments (n=4). Statistical analysis: one-way ANOVA; *P < 0.05, **P < 0.01 compared to control. (E) Western blot analysis of PD-L1 and β-actin in membrane (m) and cytosolic (c) fractions from 8-week differentiated RPE cells infected with T. gondii RH. The experiment was repeated three times with consistent results. (F) Representative fluorescence microscopy images of PD-L1 expression in human astrocytes, microglia, and Müller cells infected with virulent T. gondii RH or less-virulent T. gondii Me49 strain (MOI 1:1). PD-L1 is shown in yellow, and nuclei are stained with Hoechst 33342 in blue. Images represent one of three independent replicates showing similar results. (G) Mean fluorescence intensity (MFI) analysis of PD-L1 expression in human microglia, astrocytes, and Müller cells infected with virulent T. gondii RH or less-virulent Me49 strain (MOI 1:1). Data are presented as mean ± SEM from three independent experiments (n=12). Statistical analysis was performed using a T-test; ns = not significant (P > 0.05), *P < 0.05 compared to control. (H) Analysis of PD-L1 fluorescence variability (standard deviation) reflecting average variability within each image. Data are presented as mean ± SEM from three independent experiments (n=12). Statistical analysis: one-way ANOVA; *P < 0.05 compared to control.
Figure 2
Figure 2
Regulation of PD-L1 in human microglia, astrocytes, Müller, and RPE cells by IFN stimulation. (A) RT-qPCR analysis of PD-L1 mRNA expression in human microglia, astrocytes, Müller cells, and RPE cells following stimulation with 20 ng/mL IFN-β, IFN-γ, or IFN-λ1. Data are presented as mean ± SEM from four independent experiments, each with four replicates (n=12). Statistical analysis was performed using one-way ANOVA; *P < 0.05, **P < 0.01, ***P < 0.001, ****P < 0.0001 compared to control. (B) Baseline PD-L1 mRNA expression in human microglia, astrocytes, Müller cells, and RPE cells measured by RT-qPCR. Results are shown as mean ± SEM of fold changes normalized to GAPDH and to RPE cells, which exhibited the lowest PD-L1 expression. Statistical analysis: one-way ANOVA; *P < 0.05, **P < 0.01, ***P < 0.001, ****P < 0.0001 compared to RPE cells. (C) Representative fluorescence microscopy images of PD-L1 expression in human astrocytes, microglia, and Müller cells following stimulation with 20 ng/mL IFN-β, IFN-γ, or IFN-λ1. PD-L1 is shown in yellow, nuclei in blue using Hoechst 33342. Images represent one of three independent replicates demonstrating consistent results. (D) Mean fluorescence intensity (MFI) analysis of PD-L1 expression in human microglia, astrocytes, and Müller cells following stimulation with 20 ng/mL IFN-β, IFN-γ, or IFN-λ1. Data are shown as mean ± SEM from three independent experiments (n=6 for IFN stimulation; n=12 for infection). Statistical analysis: one-way ANOVA; *P < 0.05, **P < 0.01, ***P < 0.001, ****P < 0.0001 compared to control. (E) Baseline analysis of PD-L1 MFI in human microglia, astrocytes, and Müller cells. Data are expressed as mean ± SEM from three independent experiments (n=6). Statistical analysis: one-way ANOVA; ns = not significant (P > 0.05), *P < 0.05 compared to control.
Figure 3
Figure 3
Protease-dependent reduction of PD-L1 expression on the outer blood-retinal barrier model by infected co-culture supernatants. (A) Schematic diagram of the experimental protocol. Astrocytes, microglia, and Müller cells are co-cultured for 48 hours, followed by infection with T. gondii RH or Me49 tachyzoites for 20 hours. Culture media is then centrifuged to remove parasites, and the supernatants are collected. The oBRB (outer blood-retinal barrier) model is treated with these supernatants for 24 hours, after which PD-L1 and ZO-1 expression are analyzed via confocal microscopy. Created in BioRender. Geiller, (B) (2025) https://BioRender.com/n37e493. (B, C) Confocal images of the oBRB model illustrating the effects of infected co-culture supernatants on ZO-1 tight junction localization (red) and PD-L1 expression (yellow). Cell nuclei are stained in blue. MEM-Nic is the medium used for RPE cell differentiation, while DMEM is the medium used to produce co-culture supernatants (sn). N.I refers to non-infected co-cultures, and T. gondii RH or Me49 denotes infected co-cultures. Images represent one of three independent replicates with similar results. (D) Mean fluorescence intensity (MFI) analysis of confocal images, quantifying the effects of infected co-culture supernatants on ZO-1 localization and PD-L1 expression in the oBRB model. Data are presented as mean ± SEM from a representative experiment (n=12), repeated three times with similar results. Statistical analysis by one-way ANOVA: ns P>0.05, *P<0.05, **P<0.005 as indicated on the graphs. (E) Confocal Z-stack and orthogonal views of the oBRB model reveal reduced PD-L1 expression and ZO-1 dislocation in response to treatment with infected co-culture supernatants. The dashed line indicates the apical cell side and arrowheads diffuse ZO-1 localization. (F) MFI analysis of confocal images quantifying the effects of direct T. gondii RH infection on PD-L1 expression in the oBRB model. Data are presented as mean ± SEM from a representative experiment (n=9), repeated twice with similar results. Statistical analysis by one-way ANOVA: ***P<0.0005 as indicated on the graphs. (G) Confocal images showing the effects of direct T. gondii RH infection on PD-L1 and ZO-1 expression in the oBRB model. Infections were performed with the multiplicity of infection (MOI) indicated in the figure. The "lower compartment" condition represents the placement of 3x10^5 T. gondii RH tachyzoites in the bottom compartment of the oBRB model without direct cell contact. Representative images are shown from one of three independent replicates. (H) Confocal images showing the effects of supernatants from T. gondii RH and Me49-infected co-cultures treated with a protease inhibitor cocktail on PD-L1 and ZO-1 expression in the oBRB model. Representative images are from one of three independent replicates. (I) MFI analysis of confocal images illustrating the effects of protease inhibitor-treated T. gondii RH and Me49 supernatants on PD-L1 expression in the oBRB model. Data are presented as mean ± SEM from three independent experiments (n=12). Statistical analysis by one-way ANOVA: ns P>0.05, ***P<0.001, ****P<0.0001 compared to DMEM control, ##P<0.01, ###P<0.001 compared to inhibitor-untreated parasite supernatant.
Figure 4
Figure 4
Impact of interferon neutralization on PD-L1 expression, GFAP levels, and CD11b+ cell distribution in a mouse model of ocular toxoplasmosis. (A) Confocal microscopy images of non-infected or T. gondii Me49 infected mouse retina cryosections at 1, 3, and 7 days post-injection of 20 ng of either isotype control, IFN-β, or IFN-λ2/3 neutralizing antibodies (arranged left to right for time points, top to bottom for antibody types). Retina layers are oriented from top to bottom as follows: RPE, outer nuclear layer (ONL), outer plexus layer (OPL), inner nuclear layer (INL), inner plexus layer (IPL), and ganglion cell layer (GCL). GFAP is labeled as described in green and CD11b in red. Nuclei are stained blue with Hoechst33342. (B) Confocal images of non-infected mouse retina cryosections at day 1 post-injection, comparing isotype control (left) and IFN-β (right) neutralizing antibody treatments. Retina layers are oriented and labeled as described. (C) Confocal microscopy images of non-infected or T. gondii Me49 infected mouse retina cryosections at 1, 3, and 7 days post-injection of 20 ng of either isotype control, IFN-β, or IFN-λ2/3 neutralizing antibodies (arranged left to right for time points, top to bottom for antibody types). Retina layers are oriented as previously described. GFAP is labeled as described in green and CD11b in red. Nuclei are stained blue with Hoechst33342. (D) Confocal images of non-infected mouse retina cryosections at day 1 post-injection, comparing isotype control (left) and IFN-λ2/3 (right) neutralizing antibody treatments. Retina layers are oriented and labeled as described. (E) Confocal Z-stack images of mouse retina cryosections at day 7 post-injection, comparing non-infected and T. gondii Me49-infected retinas treated with isotype control antibodies. Retina layers are oriented and labeled as described. (F) Confocal Z-stack image of T. gondii Me49-infected, isotype control antibody-treated retina sections at day 7 post-injection. Retina layers are oriented and labeled as described.

Similar articles

References

    1. Goh EJH, Putera I, La Distia Nora R, Mahendradas P, Biswas J, Chee SP, et al. Ocular toxoplasmosis. Ocular Immunol Inflammation. (2023) 31:134261. doi: 10.1080/09273948.2022.2117705 - DOI - PubMed
    1. Sun C, Mezzadra R, Schumacher TN. Regulation and function of the PD-L1 checkpoint. Immunity. (2018) 48:43452. doi: 10.1016/j.immuni.2018.03.014 - DOI - PMC - PubMed
    1. Charles E, Joshi S, Ash JD, Fox BA, Farris AD, Bzik DJ, et al. CD4 T-cell suppression by cells from toxoplasma gondii-infected retinas is mediated by surface protein PD-L1. Infect Immun. (2010) 78:348492. doi: 10.1128/IAI.00117-10 - DOI - PMC - PubMed
    1. Lüder CGK. IFNs in host defence and parasite immune evasion during Toxoplasma gondii infections. Front Immunol. (2024) 15:1356216. doi: 10.3389/fimmu.2024.1356216 - DOI - PMC - PubMed
    1. Lazear HM, Schoggins JW, Diamond MS. Shared and distinct functions of type I and type III interferons. Immunity. (2019) 50:90723. doi: 10.1016/j.immuni.2019.03.025 - DOI - PMC - PubMed

MeSH terms

LinkOut - more resources