. 2025 Jun 17:16:1580219.
doi: 10.3389/fimmu.2025.1580219. eCollection 2025.

Identification of potential prognostic biomarkers of thymoma with myasthenia gravis based on serum proteomics

Affiliations

Identification of potential prognostic biomarkers of thymoma with myasthenia gravis based on serum proteomics

Xiaoting Lin et al. Front Immunol. .

Erratum in

Abstract

Background: Thymoma is often associated with myasthenia gravis (MG), and the resection of thymoma improves myasthenic symptoms in patients with thymoma and MG (TMG), but some patients still have no relief. Through proteomic analysis, we examined preoperative serum samples from patients with TMG to identify key prognostic proteins that could serve as a foundation for clinically predicting postoperative efficacy and guiding treatment selection.

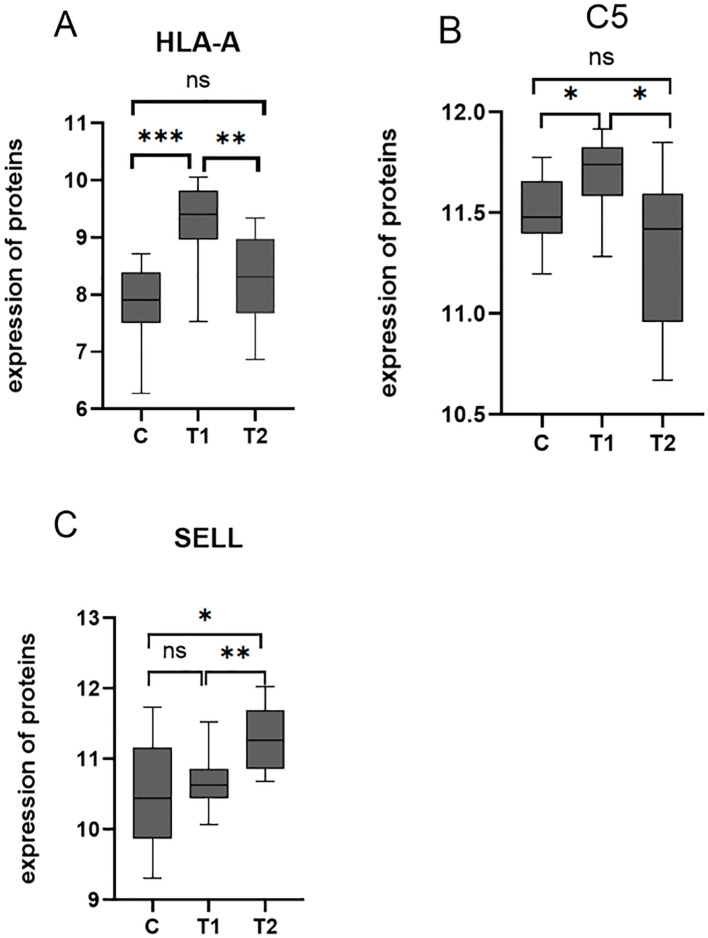
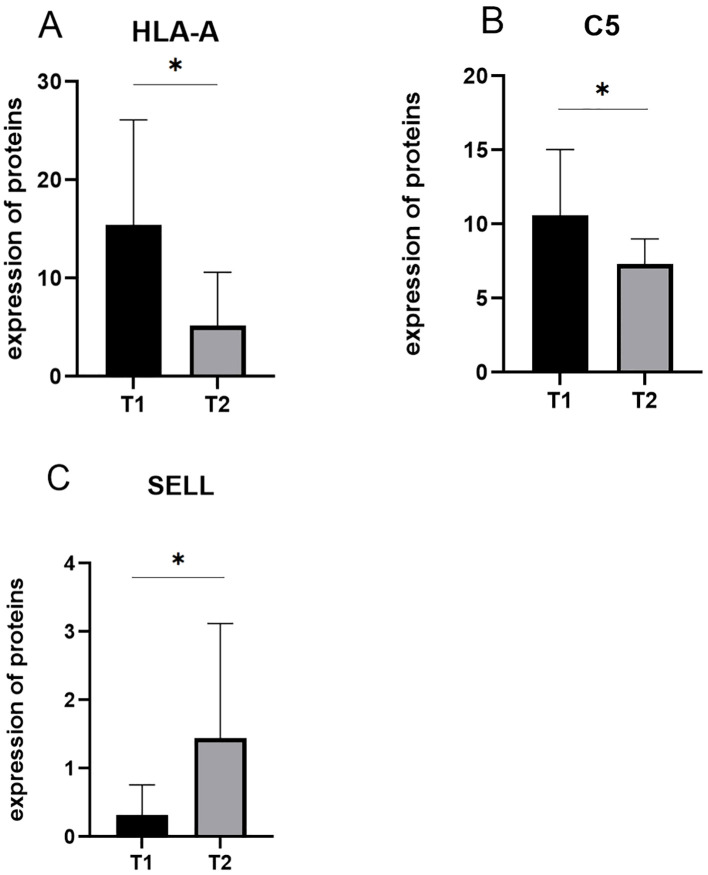
Method: According to the Clinical Research Guidelines of the Myasthenia Gravis Foundation of America (MGFA) for Post-Intervention Status (PIS), 20 patients with TMG were divided into an effective group (T1) [the PIS was minimal manifestation status (MMS) and above] and an ineffective group (T2) (the PIS did not reach MMS and above), with 10 cases each, and a healthy control group (C) with nine cases. Blood samples from the three groups were collected through data-independent acquisition (DIA) proteomic analysis performed by mass spectrometry to identify differentially expressed proteins and search for key proteins associated with myasthenia prognosis. Finally, the target proteins were validated through the utilization of enzyme-linked immunosorbent assay (ELISA).

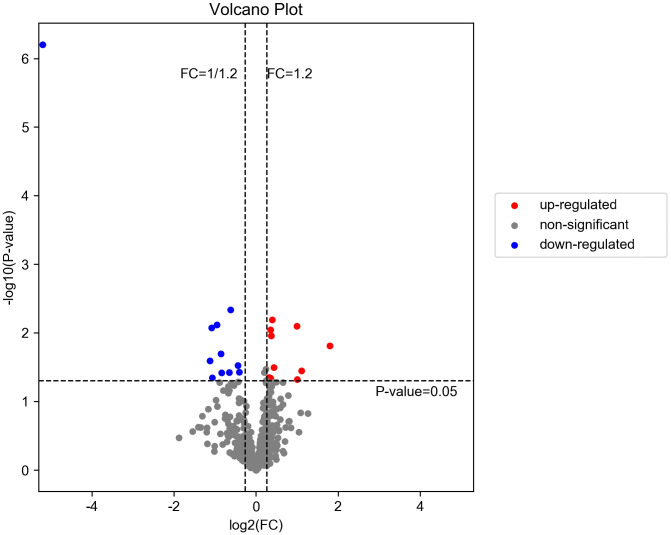
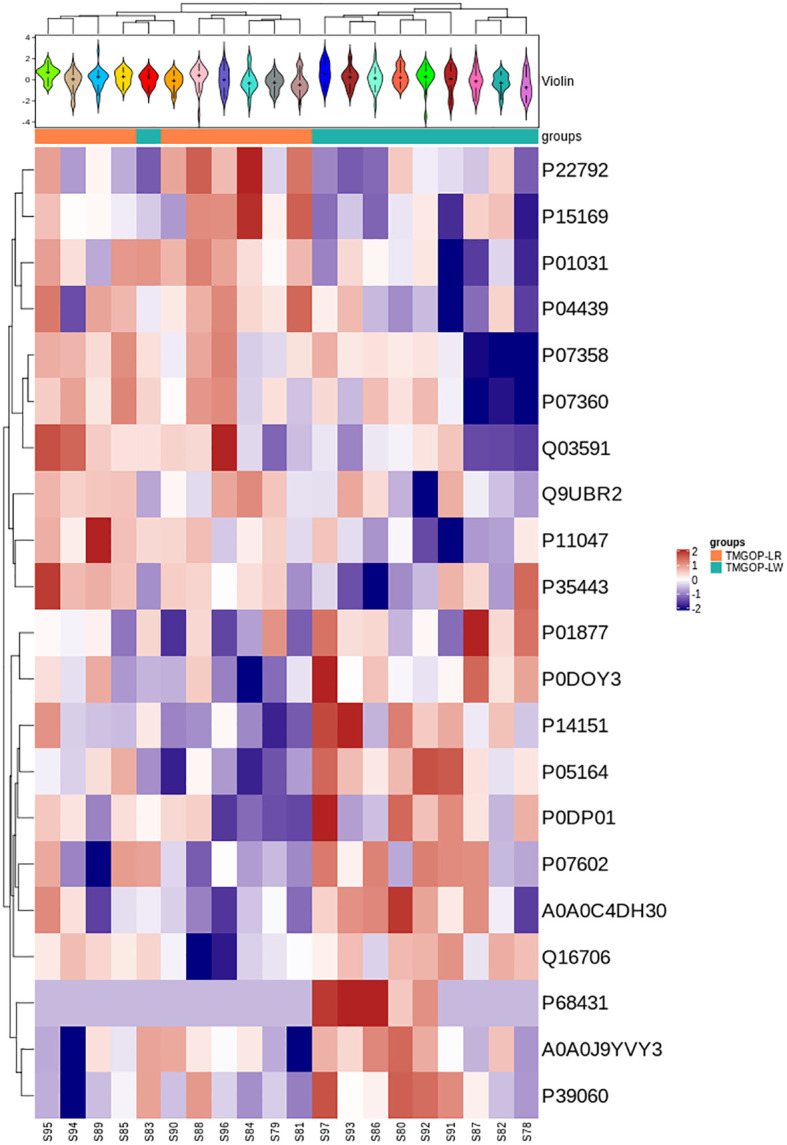
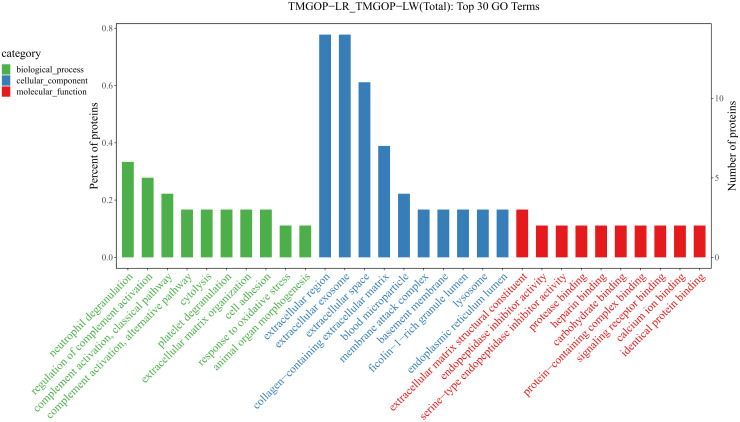
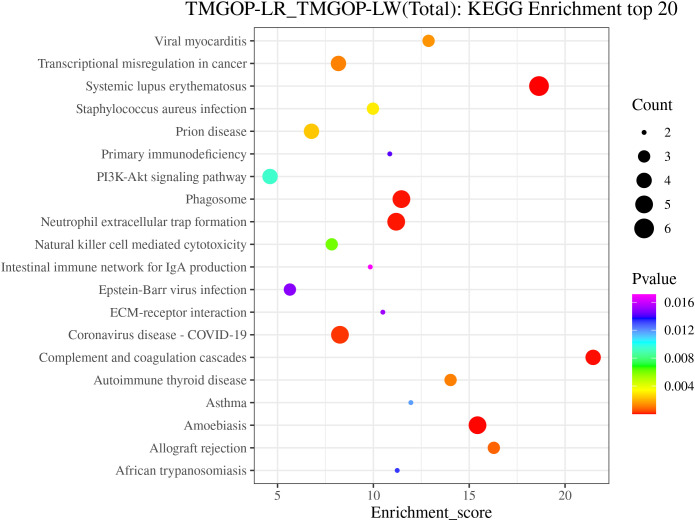
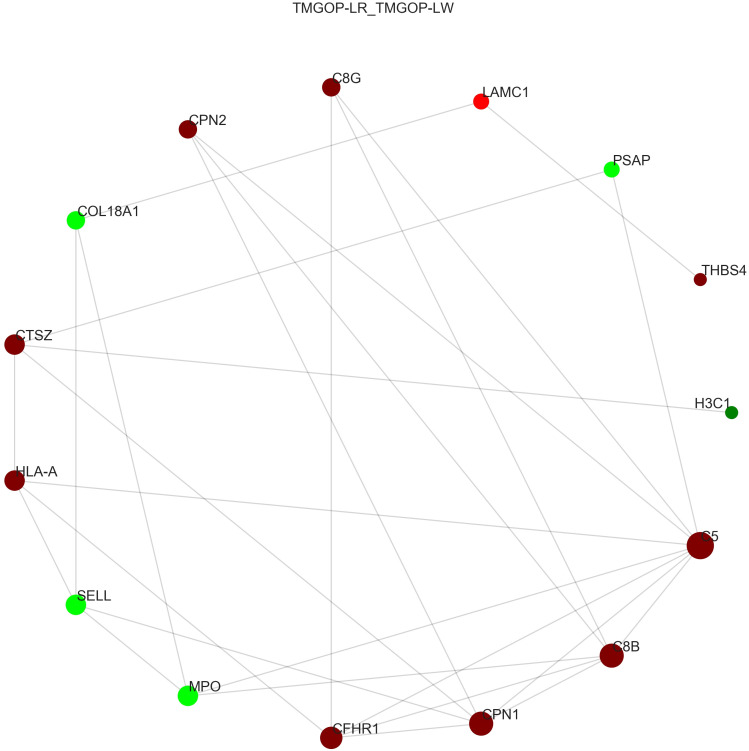
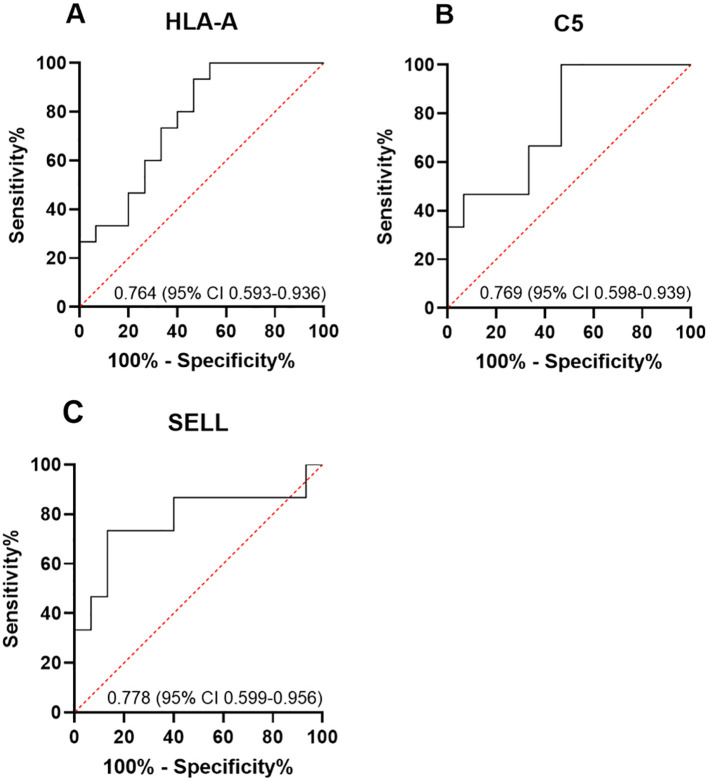
Results: A total of 514 proteins were identified in this research. Between the T1 and T2 groups, there were 20 proteins that exhibited differential expression, with 10 showing upregulation and 10 displaying downregulation. The Kyoto Encyclopedia of Genes and Genomes (KEGG) functional annotation indicated that these proteins were mainly involved in signaling pathways such as complement and coagulation cascade, prion disease, systemic lupus erythematosus, neutrophil extracellular trap formation, and transcription dysregulation in cancer. Three proteins were discovered to have a significant correlation with the prognosis of TMG: L-selectin (SELL) was downregulated, and human leukocyte antigen (HLA) class I histocompatibility antigen (HLA-A) and complement 5 (C5) were upregulated. ELISA results confirmed the proteomic results.

Conclusion: HLA-A, C5, and SELL may be potential prognostic biomarkers of TMG. This study may provide a more accurate prognostic risk assessment of TMG patients to help clinicians better individualize the initial treatment regimen for patients with different risk stratification, plan a more reasonable frequency of follow-up visits, and make more precise maintenance treatment decisions, thereby improving the overall prognosis of TMG patients.

Keywords: biomarkers; myasthenia gravis; prognostic; proteomics; thymoma.


Conflict of interest statement

The authors declare that the research was conducted in the absence of any commercial or financial relationships that could be construed as a potential conflict of interest.

Figures

Figure 1
Figure 1
Volcano diagram of DEPs in T1 vs. T2. The downregulated differentially expressed proteins (DEPs) are represented by the blue dot in the image, while the upregulated ones are indicated by the red dot. The non-significant differentially expressed proteins can be identified through the gray dot.
Figure 2
Figure 2
Expression pattern clustering heat map. At the top is the violin plot, combining a box plot and density plot. Flatter sections indicate higher data concentration, showing the probability distribution of protein expression values. Different colors represent distinct samples. The “+” symbol marks the median value, while the y-axis shows protein expression levels. At the bottom is a heat map with column annotations, where colored blocks indicate sample groups. The heat map clusters proteins by expression level, using red for high expression and blue for low expression.
Figure 3
Figure 3
Results of GO enrichment/GO enrichment and classification bar chart. The x-coordinate represents the GO entry’s name, whereas the y-coordinate indicates the count and proportion of proteins within that particular entry. GO, Gene Ontology.
Figure 4
Figure 4
KEGG annotation and enrichment analysis. The enrichment score is depicted on the x-coordinate, while the pathway information of the top 20 proteins is represented by the y-coordinate. The size of the bubbles corresponds directly to the amount of proteins that show differential expression, and their color gradient ranges from red to green, blue, and purple. More significant enrichments are indicated by smaller p-values. KEGG, Kyoto Encyclopedia of Genes and Genomes.
Figure 5
Figure 5
Protein interaction network diagram. The circle represents differential proteins, with red indicating upregulated proteins and green indicating downregulated proteins. The size of each circle corresponds to the degree of connectivity, with larger circles indicating higher levels of connectivity.
Figure 6
Figure 6
(A–C) Box plots of the expression of HLA-A, C5, and SELL in C, T1, and T2 groups (p-values were calculated using t-test; *p < 0.05, **p < 0.01, and ***p < 0.001) ns, not significant.
Figure 7
Figure 7
(A–C) The expression of candidate proteins was validated by ELISA. C5 and HLA-A were upregulated in the T1 group, while SELL was downregulated in the T1 group (p-values were calculated using t-test; *p < 0.05).
Figure 8
Figure 8
(A–C) ROC curve analysis of DEPs. The area under the curve (AUC) value was obtained by constructing the receiver operating characteristic (ROC) curve of differentially expressed proteins (DEPs). The AUC values of HLA-A, C5, and SELL were 0.764 (95% CI 0.593–0.936), 0.769 (95% CI 0.598–0.939), and 0.778 (95% CI 0.599–0.956), respectively.

Similar articles

References

    1. Marx A, Hohenberger P, Hoffmann H, Pfannschmidt J, Schnabel P, Hofmann HS, et al. The autoimmune regulator AIRE in thymoma biology: autoimmunity and beyond. J Thorac Oncol. (2010) 5:S266–72. doi: 10.1097/JTO.0b013e3181f1f63f - DOI - PubMed
    1. Querol L, Illa I. Myasthenia gravis and the neuromuscular junction. Curr Opin Neurol. (2013) 26:459–65. doi: 10.1097/WCO.0b013e328364c079 - DOI - PubMed
    1. Na KJ, Hyun K, Kang CH, Park S, Lee HJ, Park IK, et al. Predictors of post-thymectomy long-term neurological remission in thymomatous myasthenia gravis: an analysis from a multi-institutional database. Eur J Cardiothorac Surg. (2020) 57:867–73. doi: 10.1093/ejcts/ezz334 - DOI - PubMed
    1. Wiendl H, Abicht A, Chan A, Della Marina A, Hagenacker T, Hekmat K, et al. Guideline for the management of myasthenic syndromes. Ther Adv Neurol Disord. (2023) 16:17562864231213240. doi: 10.1177/17562864241246400 - DOI - PMC - PubMed
    1. Gripp S, Hilgers K, Wurm R, Schmitt G. Thymoma: prognostic factors and treatment outcomes. Cancer. (1998) 83:1495–503. doi: 10.1002/(SICI)1097-0142(19981015)83:8<1495::AID-CNCR4>3.0.CO;2-O - DOI - PubMed