. 2025 Jun 17:16:1602831.
doi: 10.3389/fimmu.2025.1602831. eCollection 2025.

Identification of anoikis-related subtypes and a risk score prognosis model, the association with TME landscapes and therapeutic responses in hepatocellular carcinoma

Affiliations

Identification of anoikis-related subtypes and a risk score prognosis model, the association with TME landscapes and therapeutic responses in hepatocellular carcinoma

Xiangyu Zhai et al. Front Immunol. .

Abstract

Introduction: Anoikis is a distinct form of programmed cell death, differing from classical apoptosis, and its role in malignant tumor progression, particularly in hepatocellular carcinoma (HCC), remains insufficiently understood. This study aims to elucidate the prognostic significance and therapeutic relevance of anoikis-related genes (ARGs) in HCC.

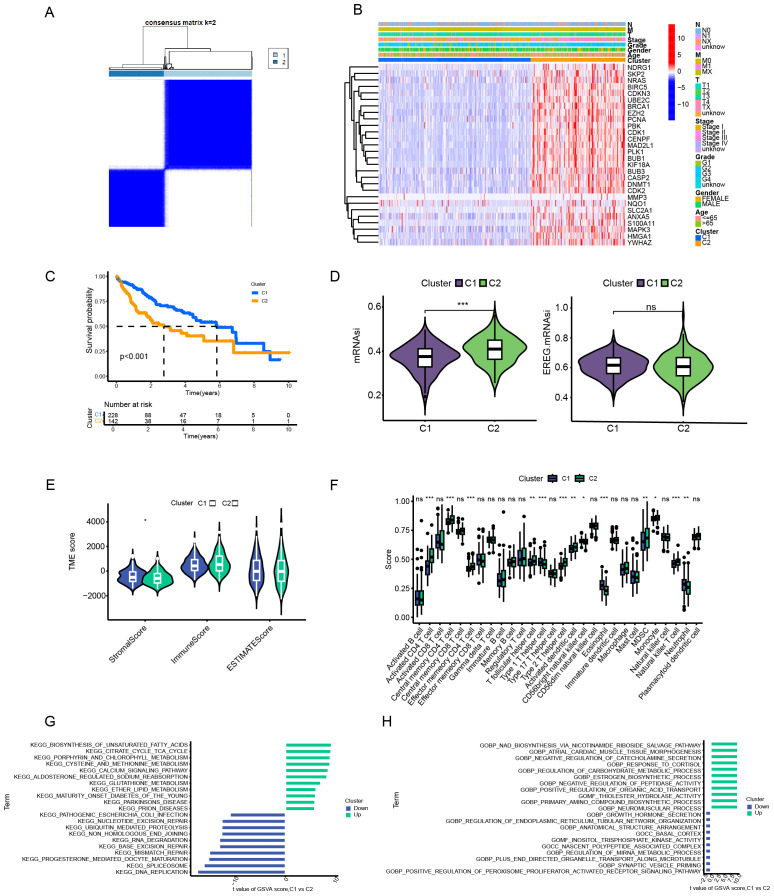
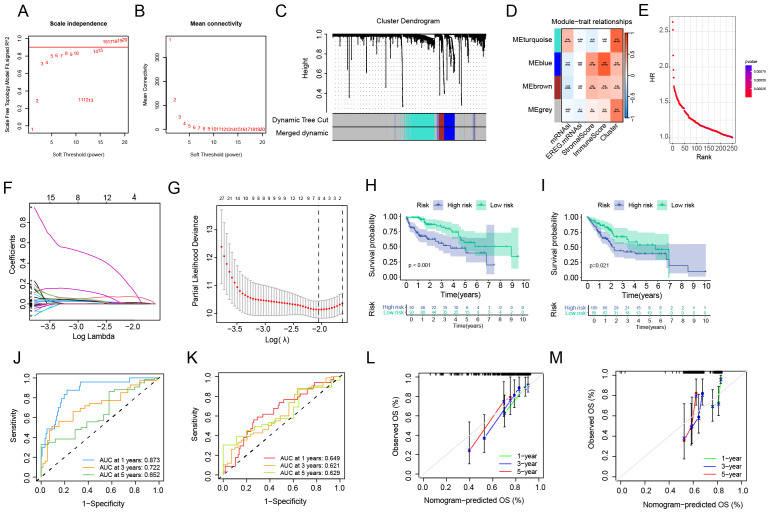
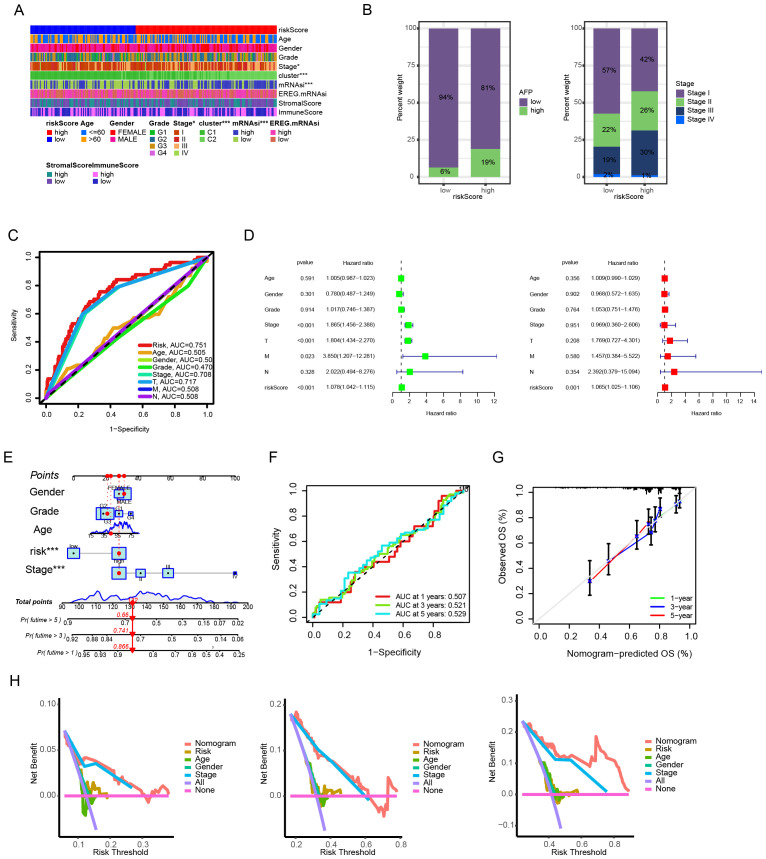
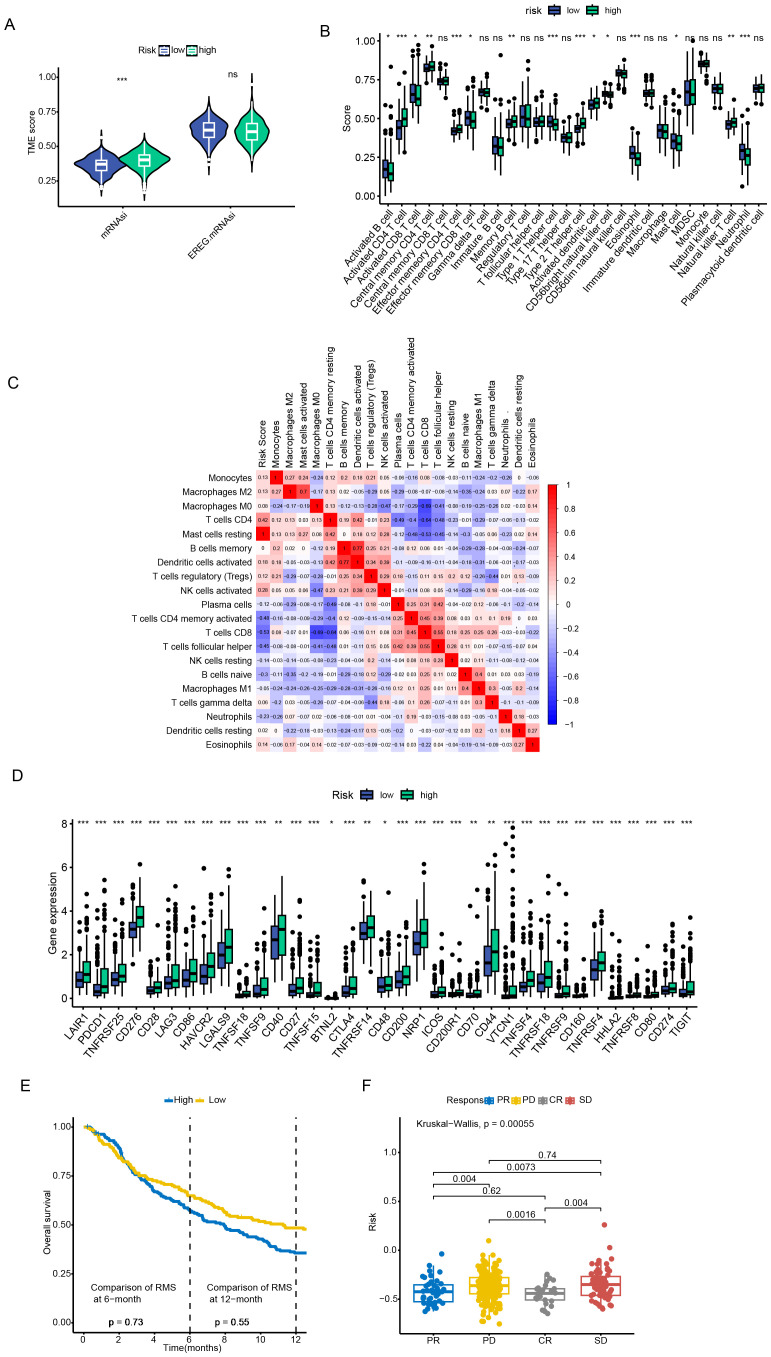
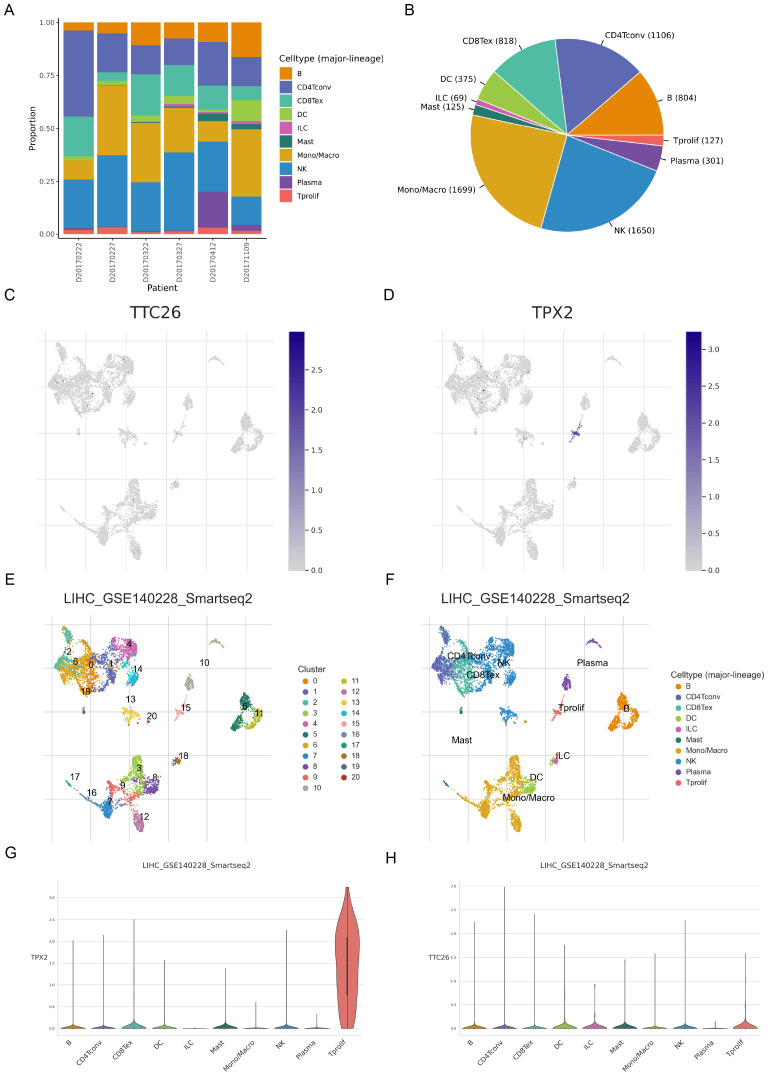
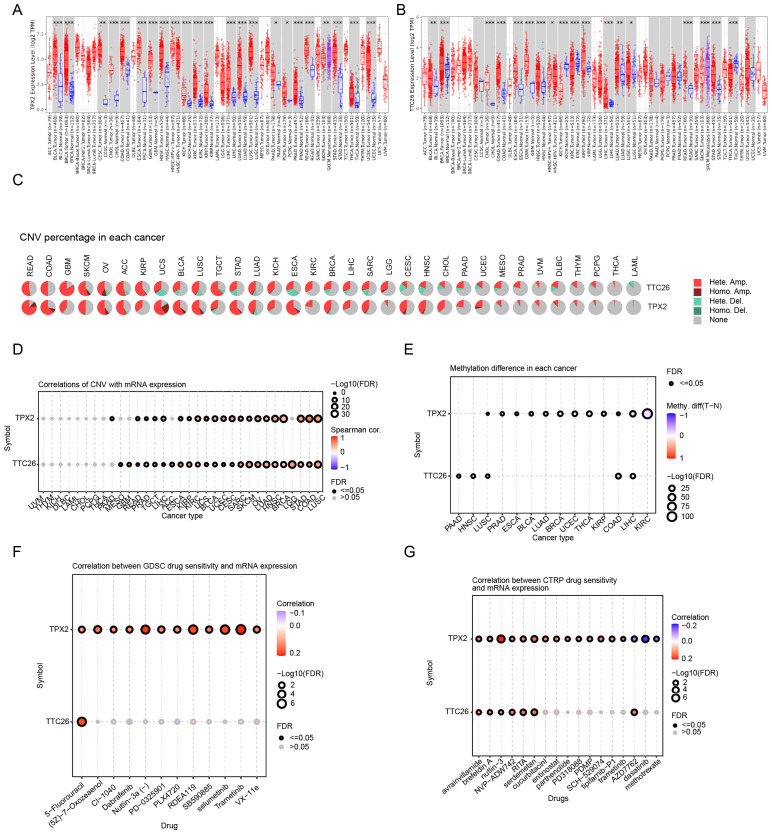
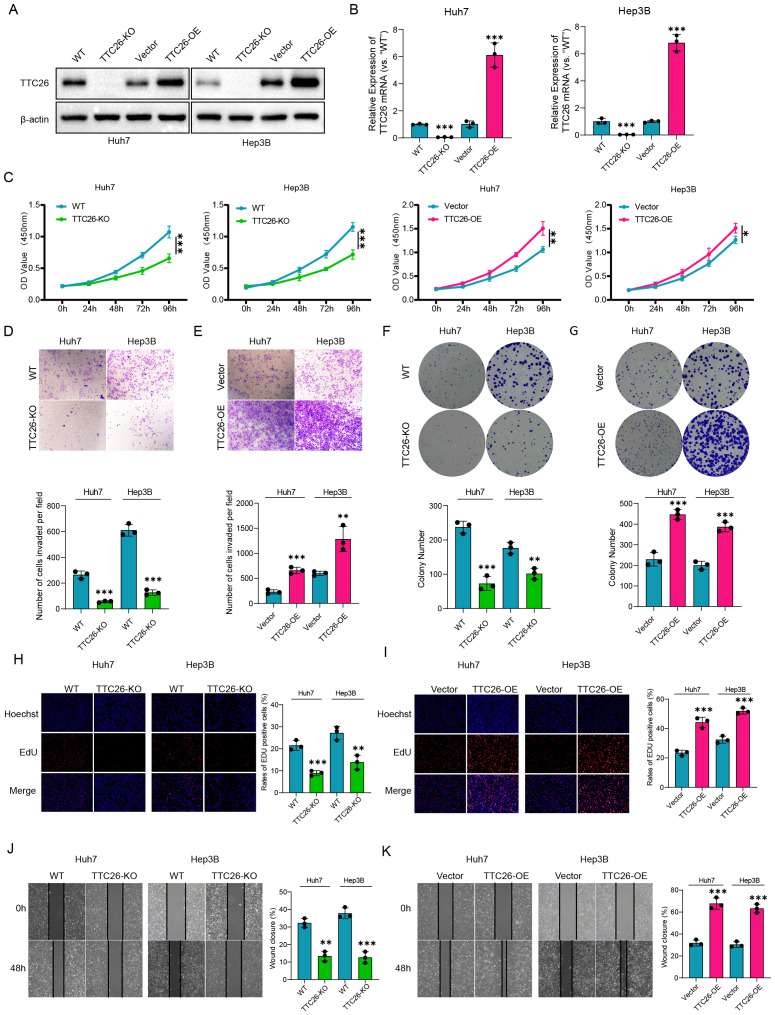
Methods: We systematically analyzed the expression, mutation, and copy number variation profiles of 27 known ARGs in HCC using public datasets. Unsupervised consensus clustering was performed to classify patients into anoikis subtypes. Weighted Gene Co-expression Network Analysis (WGCNA) identified hub gene modules, and LASSO Cox regression was applied to construct a prognostic risk score model. Correlations between the risk model and clinical outcomes, tumor microenvironment (TME) characteristics, and immunotherapy responses were evaluated. Single-cell RNA-seq and pan-cancer analyses were conducted to explore gene expression across cell types and cancer types. Finally, in vitro experiments were performed to validate the biological function of model genes.

Results: Two distinct anoikis subtypes with differing prognoses and TME features were identified in HCC. A two-gene prognostic model (TTC26 and TPX2) was developed, demonstrating robust performance in predicting patient outcomes. High-risk patients exhibited lower overall survival and distinct immune infiltration profiles. Pan-cancer analysis showed widespread dysregulation of TTC26 and TPX2. In vitro experiments confirmed that TTC26 promotes HCC cell proliferation, migration, and invasion.

Discussion: Our findings reveal that anoikis-related molecular classification is closely linked to HCC prognosis and immune landscape. The established prognostic model has potential clinical utility for risk stratification and treatment guidance. TTC26 may serve as a novel biomarker and therapeutic target in HCC.

Keywords: anoikis; hepatocellular carcinoma; immunotherapy response; prognostic signature; tumor microenvironment.


Conflict of interest statement

The authors declare that the research was conducted in the absence of any commercial or financial relationships that could be construed as a potential conflict of interest.

Figures

Figure 1
Figure 1
Analytical approaches for characterizing anoikis-related genetic alterations in hepatocellular carcinoma. (A) Network analysis of gene-prognosis interactions. (B) Somatic mutation frequency profiling. (C) Chromosomal localization mapping. (D) Copy number variation (CNV) landscape. (E) Differential gene expression analysis between tumor and normal tissues. (F) Survival correlation assessment using integrated GEO datasets. Data are expressed as mean ± SEM. Statistical significance was determined by a two-tailed Student’s t-test. *p < 0.05, ***p < 0.001.
Figure 2
Figure 2
Analytical framework for anoikis-related molecular subtyping in hepatocellular carcinoma. (A) Consensus clustering analysis. (B) Gene expression profiling by subtype. (C) Survival probability assessment (Kaplan-Meier). (D) Tumor stemness evaluation (mRNAsi scoring). (E) Tumor microenvironment characterization (ESTIMATE algorithm). (F) Immune cell infiltration analysis. (G, H) Pathway enrichment analysis (GSVA) based on KEGG/GO gene sets. Data are expressed as mean ± SEM. Statistical significance was determined by a two-tailed Student’s t-test. *p < 0.05, **p < 0.01, ***p < 0.001, ns: not significant.
Figure 3
Figure 3
Construction and validation of the anoikis-related prognostic risk model. (A, B) Identification of the optimal soft-thresholding power. (C) Differential gene expression analysis between molecular subtypes. (D) Weighted gene co-expression network (WGCNA) module-trait correlation analysis. (E) Univariate Cox regression for preliminary prognostic gene screening. (F, G) LASSO regression-based gene selection and model optimization. (H, I) Survival probability stratification (Kaplan-Meier curves). (J, K) Predictive performance evaluation (ROC curves). (L, M) Model calibration analysis.
Figure 4
Figure 4
Clinical correlation and prognostic utility of the anoikis-based risk model. (A) Clinicopathological feature stratification by risk groups. (B) Distribution patterns of AFP levels and TNM stages. (C) Prognostic predictive performance comparison across variables. (D) Univariate and multivariate Cox regression analyses for prognostic independence. (E) Nomogram integrating risk scores and clinical parameters. (F) Time-dependent predictive accuracy evaluation (ROC curves). (G) Model calibration assessment. (H) Clinical benefit analysis via decision curve methodology.
Figure 5
Figure 5
Tumor microenvironment characterization and immunotherapy response evaluation. (A) Stromal and immune score comparison between risk groups. (B, C) Immune cell infiltration profiling via ssGSEA algorithm. (D) Immune checkpoint genes were significantly upregulated in patients in the high-risk group. (E, F) Survival outcomes stratification by risk groups in ICI-treated cohorts. Data are expressed as mean ± SEM. Statistical significance was determined by a two-tailed Student’s t-test. *p < 0.05, **p < 0.01, ***p < 0.001, ns: not significant.
Figure 6
Figure 6
Single-cell transcriptomic profiling of anoikis-related genes in hepatocellular carcinoma. (A–D) Single-cell clustering and cell type annotation using the TISCH database (GSE140228 dataset). (E–H) Cell type-specific expression patterns of ARGs in the tumor microenvironment.
Figure 7
Figure 7
Pan-cancer genomic and pharmacogenomic characterization of prognostic genes. (A, B) Pan-cancer expression profiling of TPX2 and TTC26. (C, D) CNV association analysis across cancer types. (E) Association with DNA methylation levels. (F, G) Drug sensitivity correlation analysis (GDSC and CTRP databases). Data are expressed as mean ± SEM. Statistical significance was determined by a two-tailed Student’s t-test. *p < 0.05, **p < 0.01, ***p < 0.001.
Figure 8
Figure 8
Experimental validation and functional characterization of TTC26 in HCC models. (A) Western blot validation of genetic modifications. (B) qRT-PCR confirmation of TTC26 expression levels. (C) Cell proliferation assessment (CCK-8 assay). (D, E) Invasion capacity evaluation (Transwell assay). (F, G) Clonogenic potential analysis. (H, I) Proliferative activity quantification (EdU assay). (J, K) Migration capability assessment (scratch wound healing assay). Data are expressed as mean ± SEM of three independent experiments. Significance was determined by two-tailed Student’s t-test. *p < 0.05, **p < 0.01, ***p < 0.001.

Similar articles

References

    1. Sung H, Ferlay J, Siegel RL, Laversanne M, Soerjomataram I, Jemal A, et al. Global cancer statistics 2020: GLOBOCAN estimates of incidence and mortality worldwide for 36 cancers in 185 countries. CA Cancer J Clin. (2021) 71:209–49. doi: 10.3322/caac.21660 - DOI - PubMed
    1. Ma X, Yuan T, Yang C, Wang Z, Zang Y, Wu L, et al. X-inactive-specific transcript of peripheral blood cells is regulated by exosomal Jpx and acts as a biomarker for female patients with hepatocellular carcinoma. Ther Adv Med Oncol. (2017) 9:665–77. doi: 10.1177/1758834017731052 - DOI - PMC - PubMed
    1. Tsai YF, Liu FC, Chen CY, Lin JR, Yu HP. Effect of mycophenolate mofetil therapy on recurrence of hepatocellular carcinoma after liver transplantation: A population-based cohort study. J Clin Med. (2021) 10(8):1558. doi: 10.3390/jcm10081558 - DOI - PMC - PubMed
    1. Yang JD, Hainaut P, Gores GJ, Amadou A, Plymoth A, Roberts LR. A global view of hepatocellular carcinoma: trends, risk, prevention and management. Nat Rev Gastroenterol Hepatol. (2019) 16:589–604. doi: 10.1038/s41575-019-0186-y - DOI - PMC - PubMed
    1. Guizhen Z, Guanchang J, Liwen L, Huifen W, Zhigang R, Ranran S, et al. The tumor microenvironment of hepatocellular carcinoma and its targeting strategy by CAR-T cell immunotherapy. Front Endocrinol (Lausanne). (2022) 13:918869. doi: 10.3389/fendo.2022.918869 - DOI - PMC - PubMed

MeSH terms

Substances

LinkOut - more resources