. 2025 Jun 17:16:1578669.
doi: 10.3389/fimmu.2025.1578669. eCollection 2025.

Subclinical ketosis in postpartum dairy cows alters the adipose tissue immunological profile in a depot-specific manner

Affiliations

Subclinical ketosis in postpartum dairy cows alters the adipose tissue immunological profile in a depot-specific manner

Tainara C Michelotti et al. Front Immunol. .

Abstract

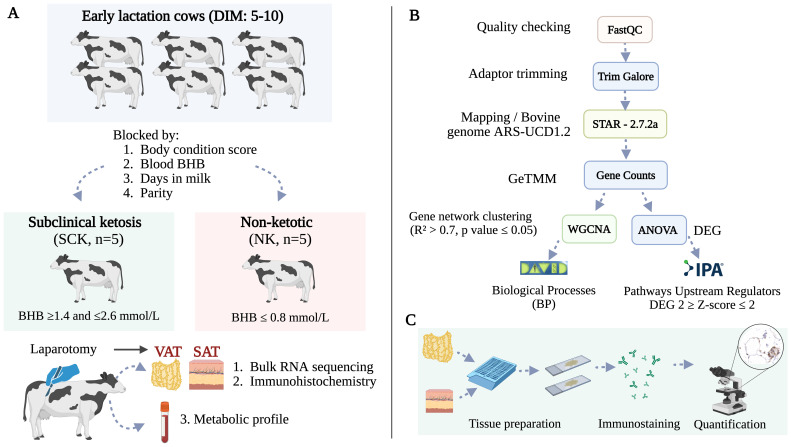
Introduction: Subclinical ketosis (SCK) is a common metabolic disorder linked to adipose tissue (AT) dysfunction in periparturient dairy cows. While subcutaneous AT (SAT) and visceral AT (VAT) differ in structure, cellularity, and function, depot-specific responses to ketosis remain poorly understood. This study aimed to determine the transcriptional differences of flank SAT and omental VAT in early lactation dairy cows in response to SCK.

Methods: Multiparous Holstein dairy cows within the first 10 days postpartum were screened for SCK. Subclinical ketosis was defined as blood β-hydroxybutyrate (BHB) concentrations between 1.4 and 2.6 mmol/L, while control, non-ketotic animals (NK) had BHB equal to or lower than 0.8 mmol/L. Adipose tissue biopsies were obtained from flank SAT and omental VAT from five SCK and five NK cows for RNA sequencing and immunohistochemistry analyses.

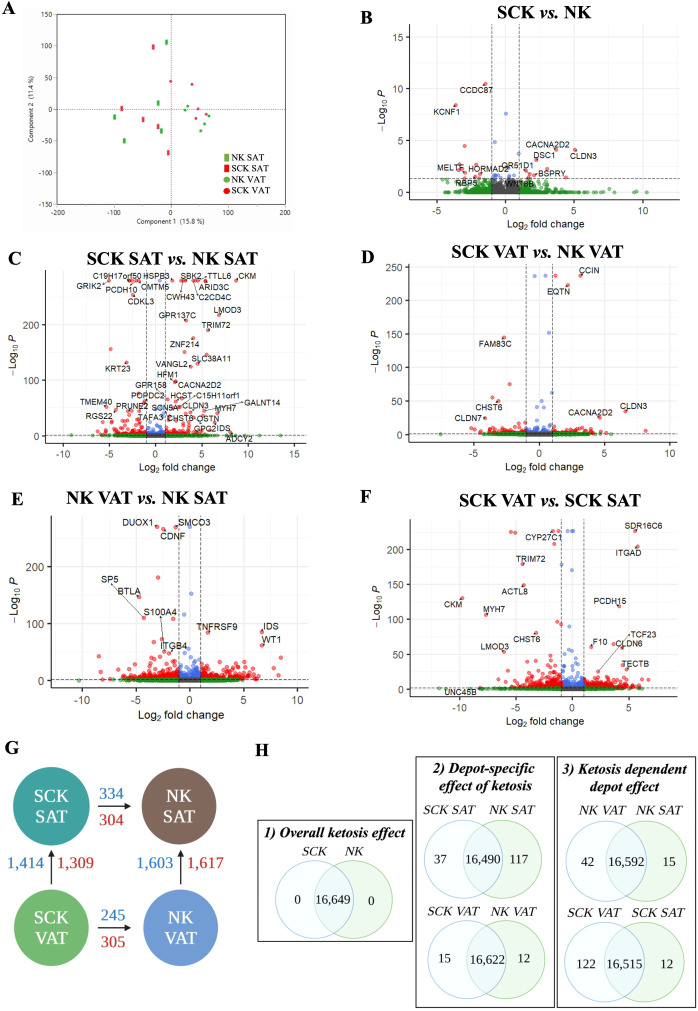
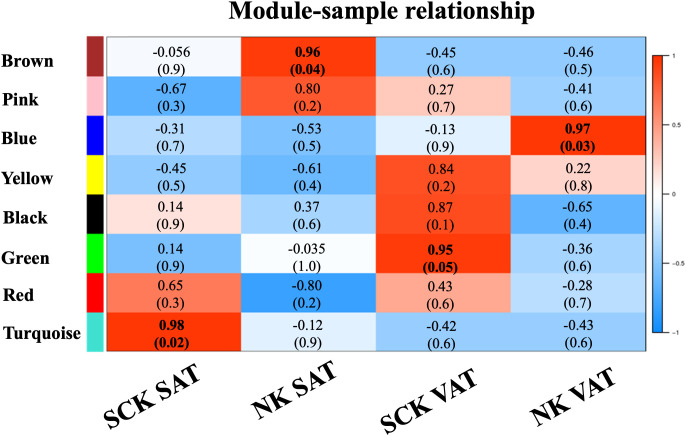
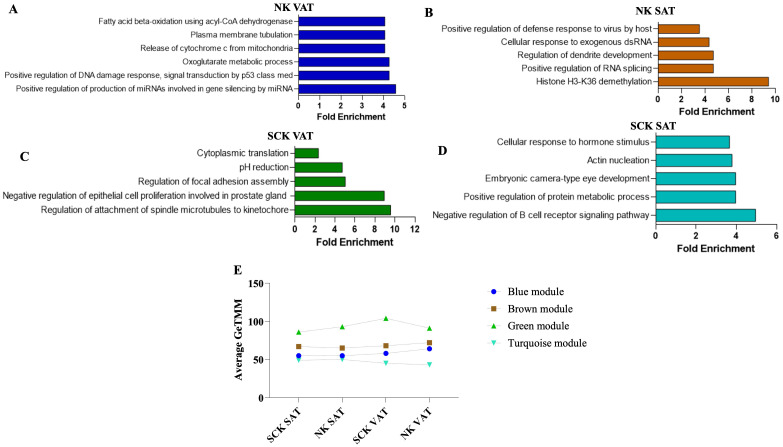
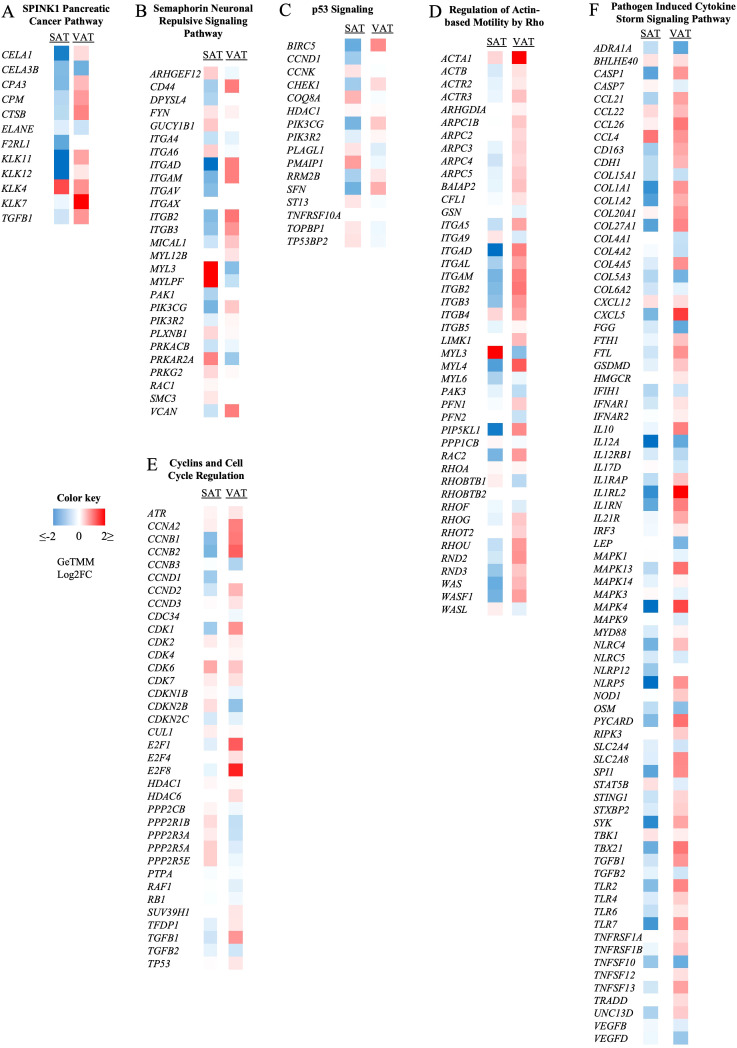
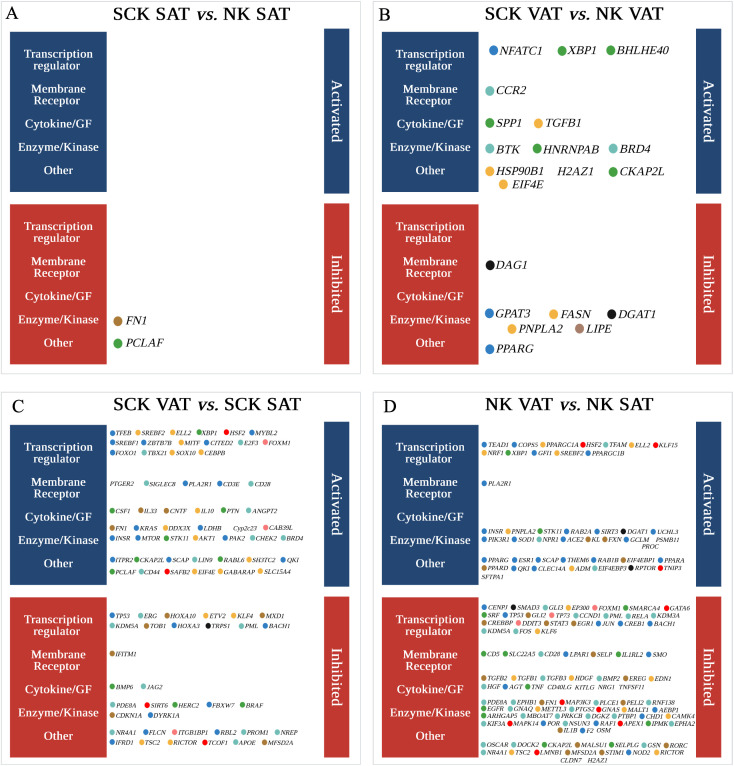
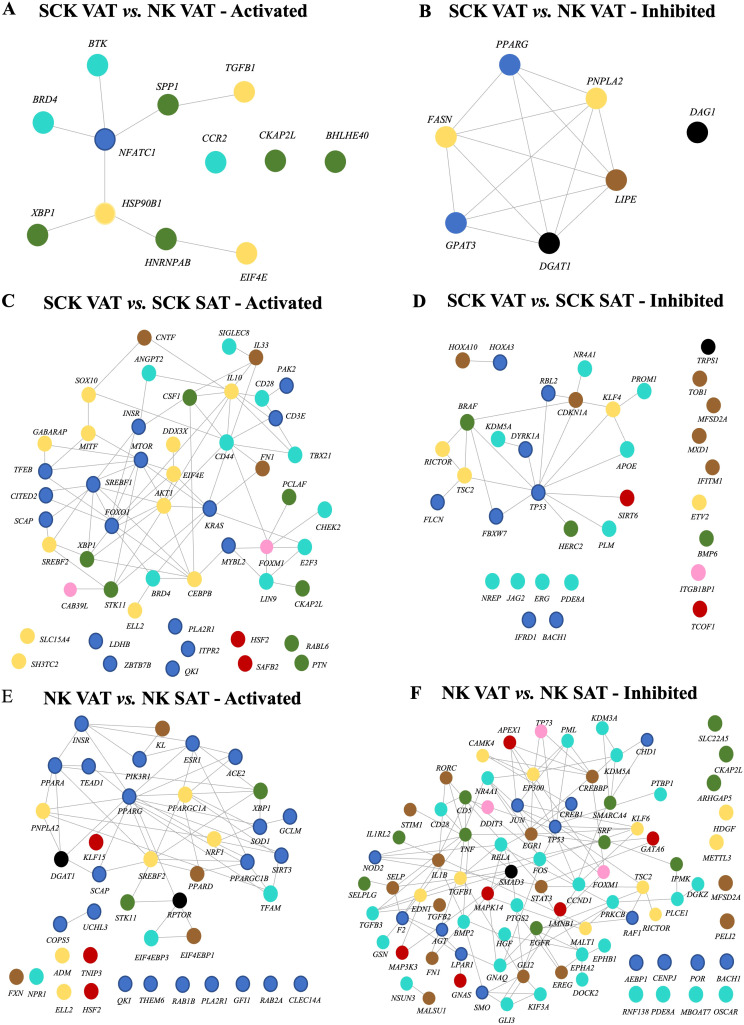
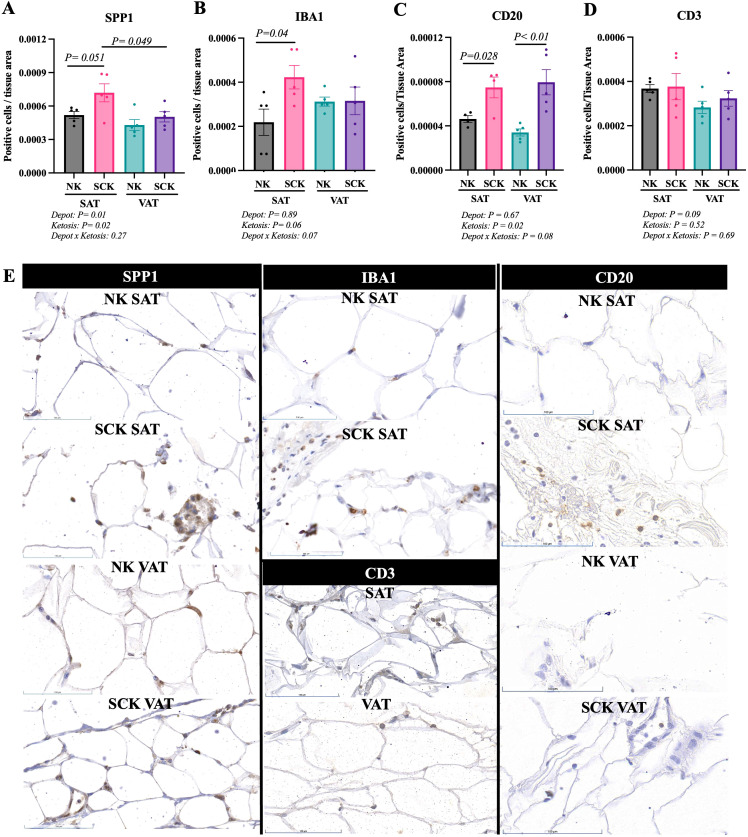
Results and discussion: Subclinical ketosis affected AT transcriptional profiles in a depot-specific manner. In SAT, transcriptional changes related to SCK reflected homeostatic AT remodeling and immune cell infiltration indicative of inflammatory responses, fibroplasia, and the negative regulation of adaptive immunity responses. In VAT, SCK-related transcriptional changes reflected increased pro-inflammatory responses linked to impaired lipid metabolism and dysregulation of focal adhesion and endocytosis. Tissue expression of proteins coded by genes differentially expressed between SCK and NK revealed a depot-dependent response on AT, indicating a higher infiltration of macrophages and B cells in SCK cows. Overall, our study provides new insights into molecular mechanisms underlying ketosis pathogenesis, highlighting the dysregulation of inflammatory responses, lipid metabolism, and insulin signaling in both SAT and VAT of postpartum dairy cows.

Keywords: immune response; ketosis; subcutaneous adipose tissue; transcriptome; visceral adipose tissue.


Conflict of interest statement

The authors declare that the research was conducted in the absence of any commercial or financial relationships that could be construed as a potential conflict of interest.

Figures

Figure 1
Figure 1
(A) Study design. Ten multiparous Holstein dairy cows in early lactation were enrolled in the study based on the diagnosis of subclinical ketosis (n = 5, BHB ≥ 1.4 and ≤ 2.6 mmol/L). Non-ketotic (NK, n = 5, BHB ≤ 0.8 mmol/L) cows were matched with SCK animals according to parity, days in milk, and body condition score. Blood samples for a metabolic profile and AT biopsies from flank subcutaneous AT (SAT) and omental visceral AT (VAT) were obtained for transcriptomics and immunohistochemistry at the time of ketosis diagnosis via right flank laparotomy. (B) Bioinformatics pipeline used for RNA sequencing, quantification, and analysis. (C) Immunohistochemistry analysis of visceral and subcutaneous AT immune markers. Created using BioRender.
Figure 2
Figure 2
Gene expression contrasts. (A) Principal component analysis from differently expressed genes (DEGs) in NK SAT (green rectangle), SCK SAT (red rectangle), NK VAT (green circle), and SCK VAT (red circle). Each shape in the graph represents an individual sample. Volcano plots showing downregulated (red left quadrant) and upregulated (red right quadrant) DEGs in (B) SCK vs. NK, (C) SCK SAT vs. NK SAT, (D) SCK VAT vs. NK VAT, (E) NK VAT vs. NK SAT, and (F) SCK VAT vs. SCK SAT. (G) Schematic of differences in gene expression considering the studied contrasts, depicting the number of DEGs between SCK and NK within the same depot (SAT or VAT, horizontal comparisons), and between depots within the same condition (SCK or NK, vertical comparisons). The number of upregulated genes is represented in blue and downregulated genes are shown in red. Arrows indicate the sense of the comparison, e.g., SCK VAT showed 245 upregulated and 305 downregulated DEGs compared to NK VAT. DEG were identified by one-way ANOVA with a Huber M-estimation to control for outliers. Significance between samples was based on a Benjamini–Hochberg corrected false discovery rate (FDR) p-value < 0.05. The entire list of DEGs can be found in Supplementary Table 1 . (H) Venn diagrams illustrating the intersection and uniqueness.
Figure 3
Figure 3
Weighted gene co-expression network analysis (WGCNA): Module–sample relationships. WGCNA of 16,649 genes in AT identified eight module eigengenes (ME), four of which exhibited positive association (R² ≥ 0.7, top; p-value ≤ 0.05, bottom between parenthesis) with the assigned traits (SCK SAT, NK SAT, SCK VAT, and NK VAT). The turquoise ME was associated with SCK SAT, the brown ME was associated with NK SAT, the green ME was associated with SCK VAT, and the blue ME was associated with NK VAT.
Figure 4
Figure 4
Expression profile, gene ontology enrichment, and overrepresented biological processes within dominant modules. The blue module was positively associated with NK VAT, the brown was positively associated with NK SAT, the green was positively associated with SCK VAT, and the turquoise was positively associated with SCK SAT. Top significant overrepresented Biological Processes (BP) in the (A) blue, (B) brown, (C) green, and (D) turquoise modules and their corresponding fold enrichment. (E) Mean expression profiles of significant modules considering genes with the highest intramodular connectivity (hub genes, R2 > 0.90) of each module. There was an increased mean expression of the homeostatic/pro-resolving blue and brown modules in NK samples (A, B), while the pro-inflammatory green and turquoise modules were positively associated with SCK samples (C, D). The complete list of significant BPs and their respective gene list are presented in Supplementary Table 4 .
Figure 5
Figure 5
Effect of subclinical ketosis on the expression patterns of genes involved in different signaling pathways. Colors represent the fold change (GeTMM Log2FC) of gene expression in subclinical (SCK) compared to non-ketotic (NK) samples in subcutaneous (SAT, left column) and visceral (VAT, right column) AT. Red shows gene upregulation in SCK, while blue shows downregulation in SCK when in contrast with NK. SPINK1 pancreatic cancer (A), semaphorin neuronal repulsive (B), and p53 signaling (C) are the most activated pathways in SAT when comparing SCK to NK. Regulation of actin-based motility by rho (D), cyclins and cell cycle regulation (E), and pathogen-induced cytokine storm signaling pathway (F) are the most activated pathways in VAT when comparing SCK to NK. The full list of activated and inactivated pathways is available in Supplementary Table 5 .
Figure 6
Figure 6
Potential upstream regulators of genes differentially expressed in (A) SCK SAT vs. NK SAT, (B) SCK VAT vs. NK VAT, (C) SCK VAT vs. SCK SAT, and (D) NK VAT vs. NK SAT. Upstream regulators were identified by analysis of the DEGs using Ingenuity Pathway Analysis (IPA). Colored circles are upstream regulators identified for each comparison with an activation or inhibition Z-score (>2.0 or <−2.0), respectively ( Supplementary Table 6 ). The colors of the circles correspond to the colors of the module eigengene from WGCNA to which that specific gene is associated. Upstream regulators were grouped into five categories: transcription regulator, membrane receptor, cytokine/growth factor (GF), enzyme/kinase, and other.
Figure 7
Figure 7
Interaction network among activated (left) and inhibited (right) upstream regulators based on the effects of ketosis within VAT (A, B) and ketosis-dependent (C, D) and -independent (E, F) effects on depot. Color coding of nodes relate to the corresponding module eigengene from WGCNA.
Figure 8
Figure 8
Immunohistochemistry of subcutaneous AT (SAT) and visceral AT (VAT) of postpartum dairy cows with subclinical ketosis (SCK) and non-ketotic (NK) animal. Scatterplots for SPP1 (A), IBA1 (B), CD20 (C), CD3 (D). Data are presented as number of positive cells normalized to tissue area (mean ± SEM). Each dot in the scatterplot represents the results for each individual dairy cow. (E) Representative sections of SAT and VAT of NK and SCK dairy cows for each marker analyzed. Positive and negative controls are shown in Supplementary Figure 1 .

Similar articles

References

    1. Overton TR, Waldron MR. Nutritional management of transition dairy cows: stratagies to optimize metabolic health. J Dairy Cows. (2004) 87:E105–E19. doi: 10.3168/jds.S0022-0302(04)70066-1 - DOI
    1. Grummer RR. Impact of changes in organic nutrient metabolism on feeding the transition dairy cow. J Anim Sci. (1995) 73:2820–33. doi: 10.2527/1995.7392820x - DOI - PubMed
    1. Drackley JK. Biology of dairy cows during the transition period: the final frontier? J Dairy Sci. (1999) 82:2259–73. doi: 10.3168/jds.S0022-0302(99)75474-3 - DOI - PubMed
    1. Esposito G, Irons PC, Webb EC, Chapwanya A. Interactions between negative energy balance, metabolic diseases, uterine health and immune response in transition dairy cows. Anim Reprod Sci. (2014) 144:60–71. doi: 10.1016/j.anireprosci.2013.11.007 - DOI - PubMed
    1. Lopreiato V, Mezzetti M, Cattaneo L, Ferronato G, Minuti A, Trevisi E. Role of nutraceuticals during the transition period of dairy cows: A review. J Anim Sci Biotechnol. (2020) 11:1–18. doi: 10.1186/s40104-020-00501-x - DOI - PMC - PubMed

Substances