. 2025 Jun 24:2025:9595651.
doi: 10.1155/ijog/9595651. eCollection 2025.

Investigating Overlapping Genetic Factors and Novel Causal Genes in Autoimmune Diseases: A Transcriptome-Wide Association and Multiomics Study

Affiliations

Investigating Overlapping Genetic Factors and Novel Causal Genes in Autoimmune Diseases: A Transcriptome-Wide Association and Multiomics Study

Leihua Fu et al. Int J Genomics. .

Abstract

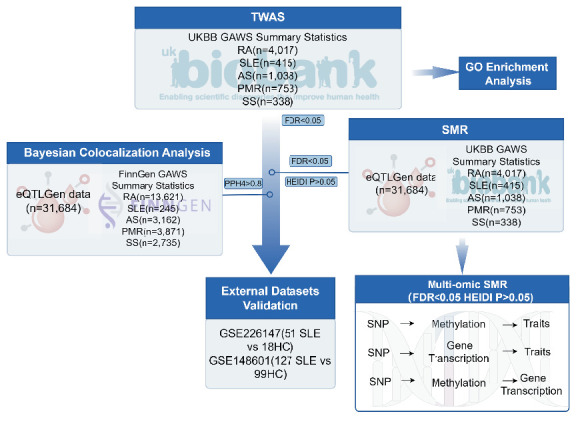
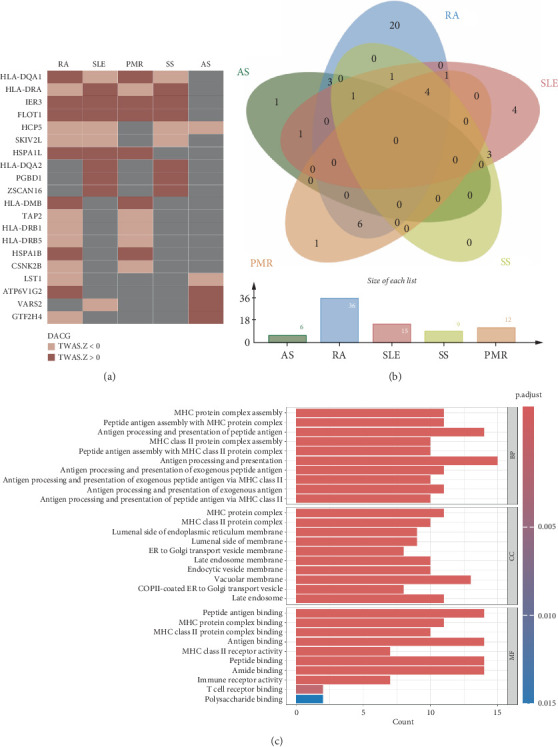
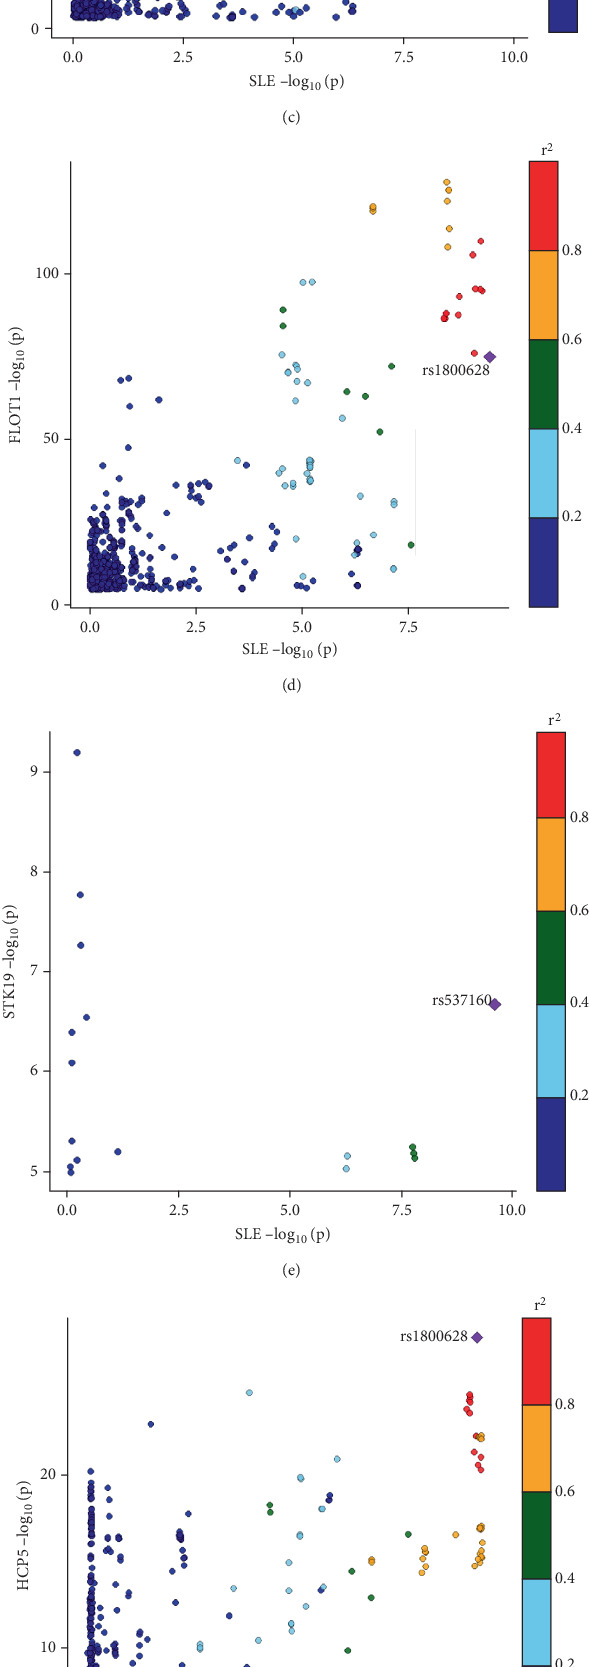
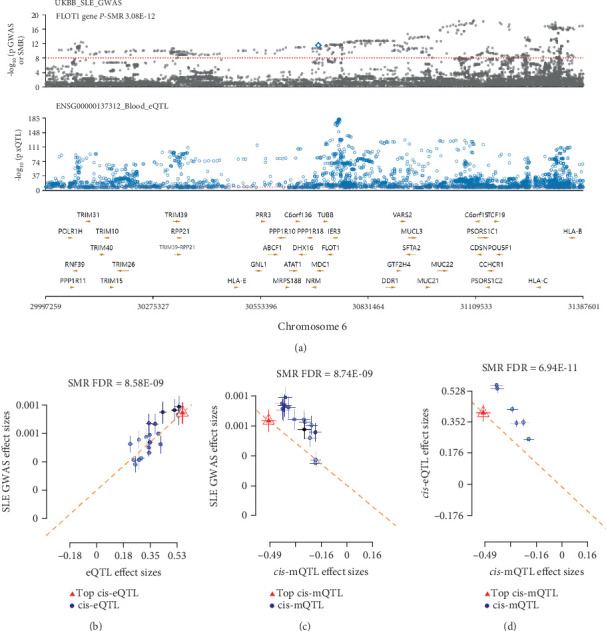
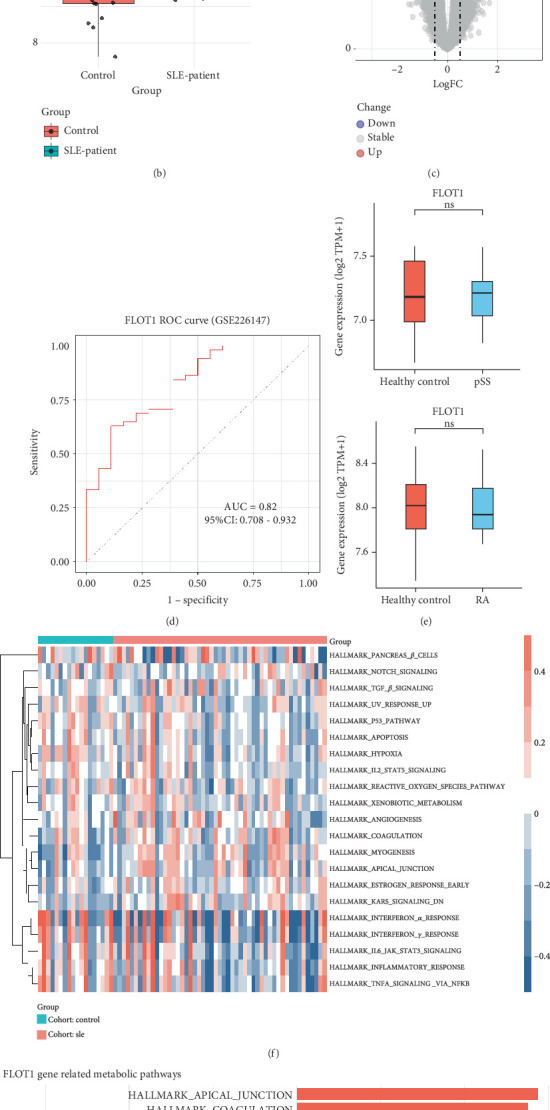
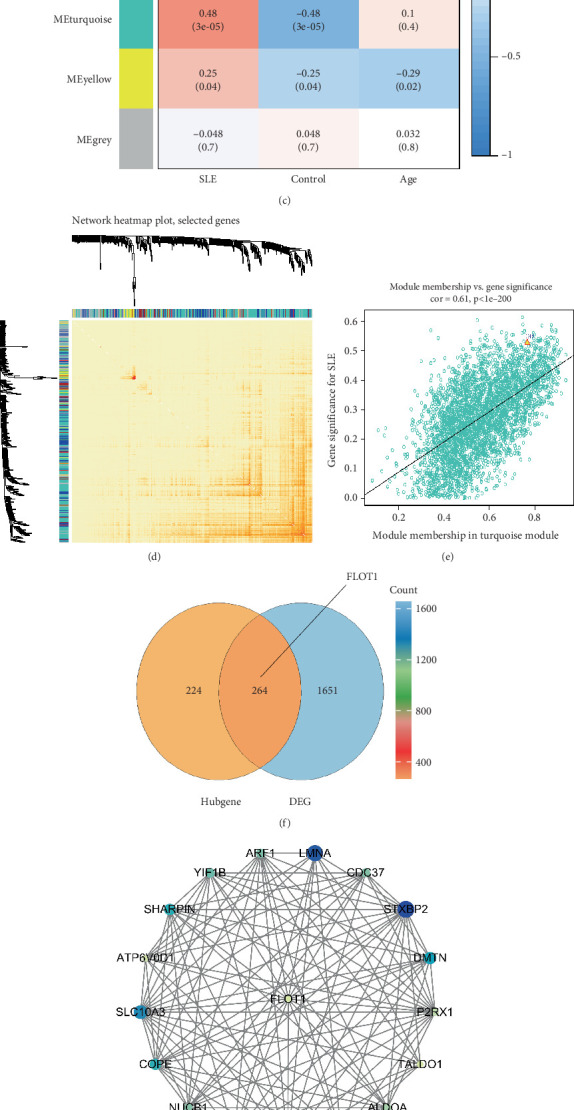
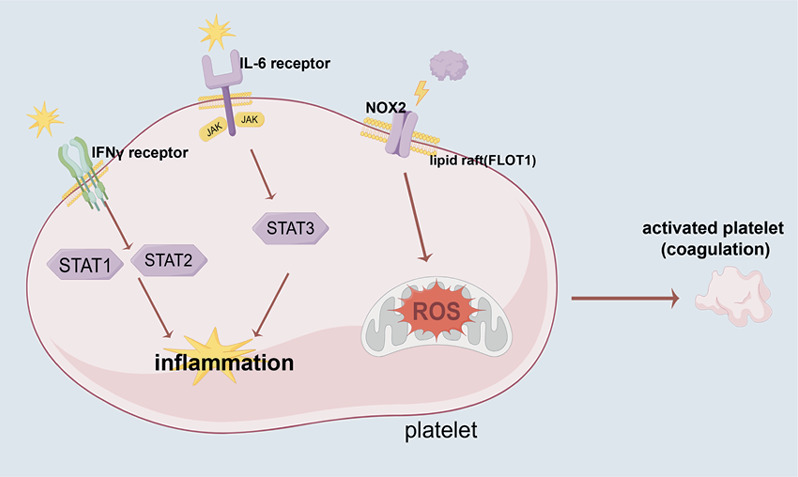
Background: Autoimmune diseases exhibit familial clustering and co-occurrence, suggesting the presence of shared genetic risk factors. However, the overlapping genetic factors across these diseases have yet to be fully elucidated. This study aimed to identify shared genetic factors across five autoimmune diseases: systemic lupus erythematosus (SLE), rheumatoid arthritis (RA), ankylosing spondylitis (AS), Sjögren's syndrome (SS), and polymyalgia rheumatica (PMR). Methods: A blood tissue-based transcriptome-wide association study (TWAS) was conducted to identify candidate genes. Bayesian colocalization analysis was employed to pinpoint genetic variants shared across diseases. Multiomics summary data-based Mendelian randomization (SMR) was used to identify causal risk genes, while transcriptomic analysis, gene set variation analysis (GSVA), and weighted gene coexpression network analysis (WGCNA) were applied to further investigate the functional roles of these genes. Results: The TWAS identified 78 candidate genes across the five autoimmune diseases. Bayesian colocalization analysis revealed five genes, GTF2H4, FLOT1, HCP5, IER3, and STK19, that share genetic variants across these disorders. Specifically, RA and AS shared independent variants of GTF2H4 (rs2230365 and rs147708689, respectively). HCP5 variants were shared with SS (rs1800628) and SLE (rs1150757), and rs1800628 was also identified as a shared locus in FLOT1 for SLE. SMR analysis highlighted FLOT1 as a strong causal risk gene for SLE. Transcriptomic analysis showed that FLOT1 is highly expressed in T cells and platelets, with involvement in multiple metabolic pathways. WGCNA identified four key neighboring genes, EHD1, SLC10A3, LMNA, and STXBP2, associated with FLOT1. Conclusion: This study uncovers shared genetic factors across five autoimmune diseases, with FLOT1 identified as a novel causal risk gene for SLE. These findings suggest that platelet-mediated pathogenic mechanisms may contribute to SLE, providing a potential target for future therapeutic interventions.

Keywords: SLE; autoimmune disease; flotillin-1 (FLOT1); platelet; summary data–based Mendelian randomization (SMR).


Conflict of interest statement

The authors declare no conflicts of interest.

Figures

Figure 1
Figure 1
Workflow of the study. TWAS was first performed using GWAS summary statistics. Bayesian colocalization analysis was then conducted with GWAS and eQTL data to identify shared genetic variants (PPH4 > 0.8). SMR and multiomics SMR analyses were subsequently used to infer causal gene–disease relationships and explore underlying molecular mechanisms. Finally, external transcriptome datasets were used for validation, and network-based approaches were employed to characterize the biological functions of the identified causal genes.
Figure 2
Figure 2
TWAS and functional annotation of DACGs in autoimmune diseases. (a) Heatmap showing overlapping DACGs identified by TWAS across five autoimmune diseases: RA, SLE, AS, PMR, and SS. TWAS Z score < 0 indicates a negative association between gene expression and disease risk, whereas a Z score > 0 indicates a positive association. (b) Venn diagram illustrating the overlap of DACGs across the five autoimmune diseases. The bar plot below displays the total number of DACGs identified in each disease. (c) GO enrichment analysis of the identified DACGs. Enriched terms are classified into biological processes (BPs), cellular components (CCs), and molecular functions (MFs). The bar length indicates the number of genes associated with each term, and the color represents the adjusted p value, with deeper shades indicating greater significance.
Figure 3
Figure 3
Bayesian colocalization analysis of DACG eQTLs and autoimmune disease GWAS signals. (a) Dot plot showing the colocalization posterior probabilities between DACG eQTL signals and GWAS loci from five autoimmune diseases. The size and color of the dots represent the posterior probabilities for shared genetic signals: PP.H4 (shared causal variant between eQTL and GWAS signal) and PP.H3 (distinct causal variants). Larger and darker dots indicate higher posterior probabilities. (b–h) Regional plots showing colocalization between DACG eQTLs and GWAS signals for specific gene–disease pairs with strong evidence of a shared causal variant. Each dot represents a genetic variant; the color scale denotes LD (r2) with the lead SNP.
Figure 4
Figure 4
Multiomics SMR analysis reveals causal associations between FLOT1 and SLE. (a) LocusZoom plot showing the genomic position of the FLOT1 gene on Chromosome 6 based on UK Biobank SLE GWAS summary statistics (top panel) and blood eQTL data from the eQTLGen consortium (bottom panel). (b–d) Multiomics SMR analyses evaluating the causal relationships among FLOT1 expression, DNA methylation, and SLE susceptibility. (b) SMR analysis between FLOT1 expression and SLE GWAS data demonstrates a significant positive association (FDR = 8.58 × 10⁻⁹), supporting FLOT1 as a potential risk gene for SLE. (c) SMR analysis between FLOT1 methylation and SLE GWAS reveals a significant inverse association (FDR = 8.74 × 10⁻⁹), suggesting that FLOT1 DNA methylation may serve as a protective factor against SLE. (d) SMR analysis between FLOT1 methylation and gene expression (FDR = 6.94 × 10⁻¹¹) indicates a strong negative correlation, implying that increased DNA methylation is causally negatively associated with FLOT1 expression.
Figure 5
Figure 5
Expression pattern and functional annotation of FLOT1 in SLE. (a) FLOT1 expression across major immune cell subsets in PBMCs from SLE patients and healthy controls (GSE148601). Significantly elevated expression was observed in T cells from SLE patients. (b) FLOT1 expression in platelets from SLE patients versus healthy controls (GSE226147), showing marked upregulation in the SLE group. (c) Volcano plot of DEGs in SLE platelets (GSE226147), with FLOT1 highlighted among the significantly upregulated genes. (d) ROC curve demonstrating the diagnostic potential of FLOT1 expression in distinguishing SLE patients from healthy controls. (e) Box plots showing FLOT1 expression in primary SS versus healthy controls (top, GSE173670) and in RA versus healthy controls (bottom, GSE117769). No significant difference in FLOT1 expression was observed in either pSS or RA compared to healthy controls. (f) Heatmap displaying significantly enriched metabolic pathways in SLE platelets (GSE226147). (g) Pearson correlation analysis between FLOT1 expression and hallmark metabolic pathways.
Figure 6
Figure 6
WGCNA and FLOT1-centered gene network analysis in SLE platelets. (a–e) WGCNA performed on the GSE226147 dataset (SLE platelet transcriptome). (a) Gene clustering dendrogram and identification of gene coexpression modules, each represented by a unique color. (b) Analysis of scale-free topology model fit to determine the optimal soft-thresholding power. (c) Module–trait correlation heatmap showing Pearson correlations between each module eigengene and SLE. The turquoise module exhibited the strongest positive correlation with SLE. (d) Heatmap of gene connectivity within modules, highlighting the turquoise module. (e) Scatterplot showing the relationship between module membership and gene significance for genes in the turquoise module, indicating a strong positive correlation (cor = 0.61, p < 2 × 10−200). (f) Venn diagram showing the overlap between DEGs and hub genes from the turquoise module; FLOT1 is included in the intersecting set. (g) Gene network centered on FLOT1, showing its top coexpressed neighboring genes within the turquoise module. (h) Pearson correlation analysis between FLOT1 and representative neighboring genes, indicating strong coexpression relationships.
Figure 7
Figure 7
FLOT1 integrates interferon, ROS, and coagulation signaling pathways in SLE platelets. This schematic illustrates the central role of FLOT1, a lipid raft–associated scaffolding protein, in coordinating key signaling events in SLE platelets. Transcriptomic analysis revealed significant upregulation of FLOT1 in platelets from SLE patients, with positive correlations to interferon-related, IL6/STAT3, ROS, and coagulation pathways. NOX2: NADPH oxidase 2. STAT: signal transducer and activator of transcription.

Similar articles

References

    1. Cho J. H., Feldman M. Heterogeneity of Autoimmune Diseases: Pathophysiologic Insights From Genetics and Implications for New Therapies. Nature Medicine . 2015;21(7):730–738. doi: 10.1038/nm.3897. - DOI - PMC - PubMed
    1. Harroud A., Hafler D. A. Common Genetic Factors Among Autoimmune Diseases. Science . 2023;380(6644):485–490. doi: 10.1126/science.adg2992. - DOI - PubMed
    1. Royrvik E. C., Husebye E. S. The Genetics of Autoimmune Addison Disease: Past, Present and Future. Nature Reviews. Endocrinology . 2022;18(7):399–412. doi: 10.1038/s41574-022-00653-y. - DOI - PubMed
    1. Lincoln M. R., Connally N., Axisa P. P., et al. Genetic Mapping Across Autoimmune Diseases Reveals Shared Associations and Mechanisms. Nature Genetics . 2024;56(5):838–845. doi: 10.1038/s41588-024-01732-8. - DOI - PubMed
    1. Wainberg M., Sinnott-Armstrong N., Mancuso N., et al. Opportunities and Challenges for Transcriptome-Wide Association Studies. Nature Genetics . 2019;51(4):592–599. doi: 10.1038/s41588-019-0385-z. - DOI - PMC - PubMed

LinkOut - more resources