. 2025 Jun 4;36(3):102584.
doi: 10.1016/j.omtn.2025.102584. eCollection 2025 Sep 9.

miR-107 represses DMPK and is sequestered by CUG repeats triggering the MSI2/miR-7 pathogenesis axis in myotonic dystrophy

Affiliations

miR-107 represses DMPK and is sequestered by CUG repeats triggering the MSI2/miR-7 pathogenesis axis in myotonic dystrophy

N Moreno et al. Mol Ther Nucleic Acids. .

Abstract

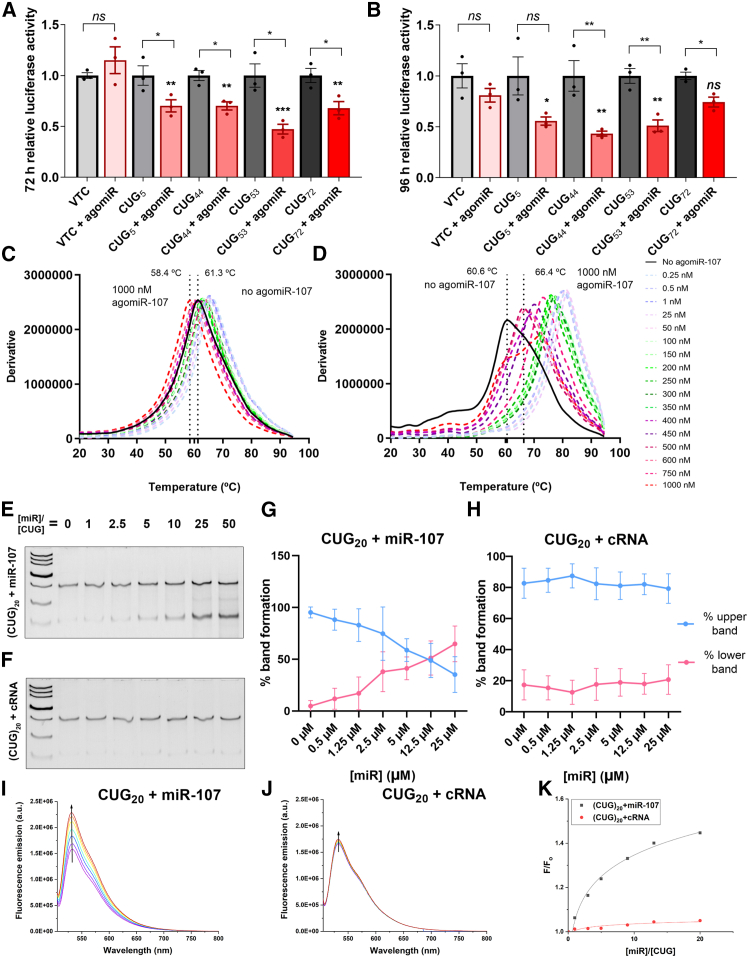
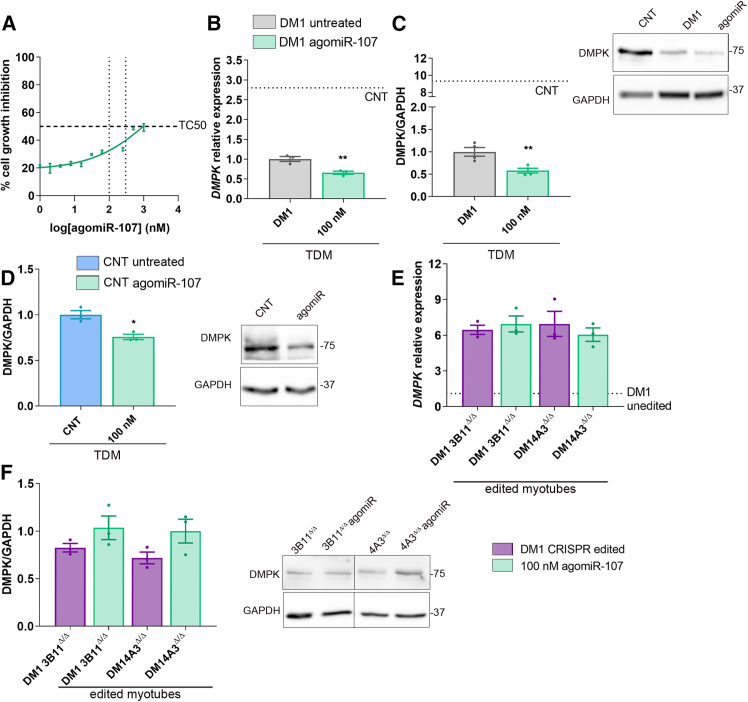
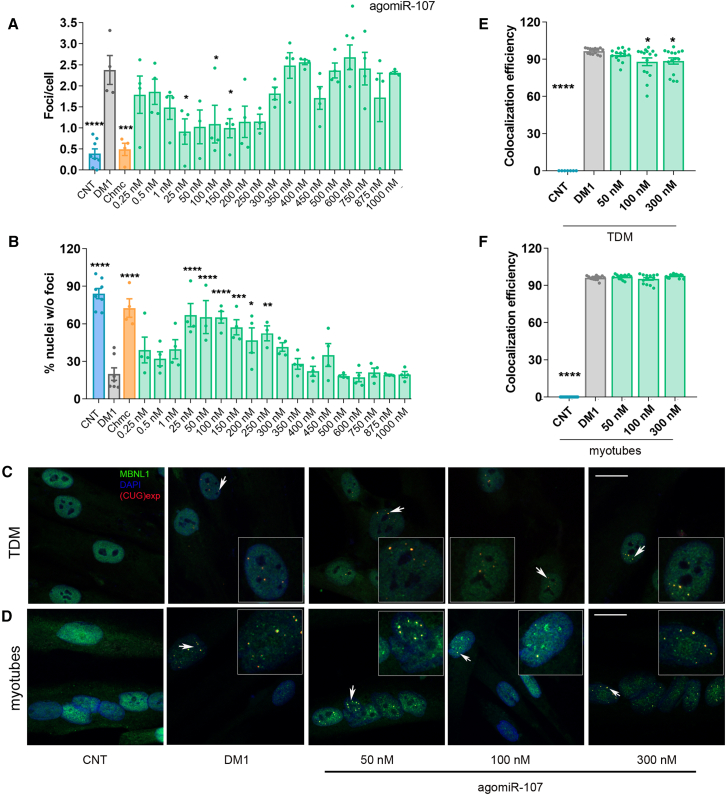
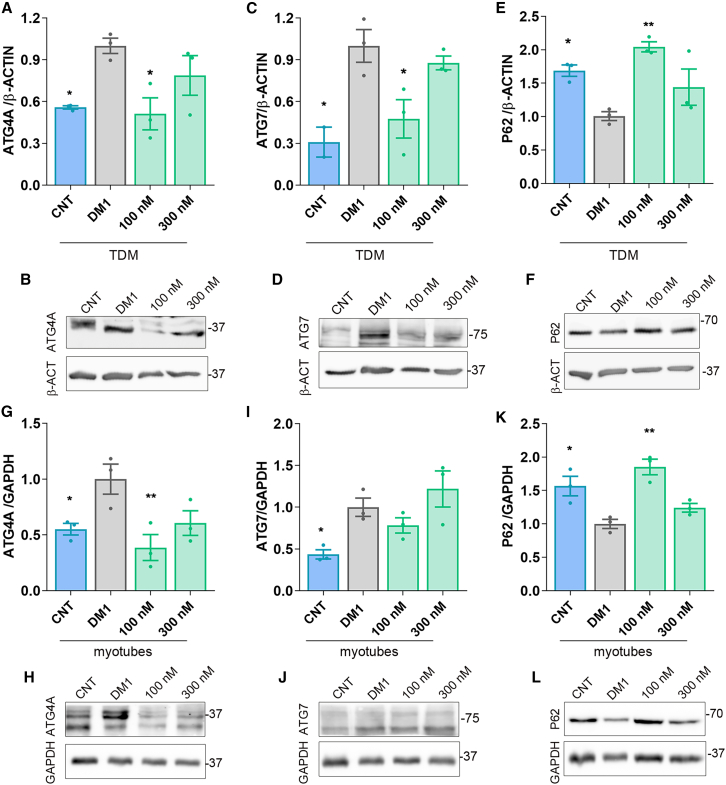
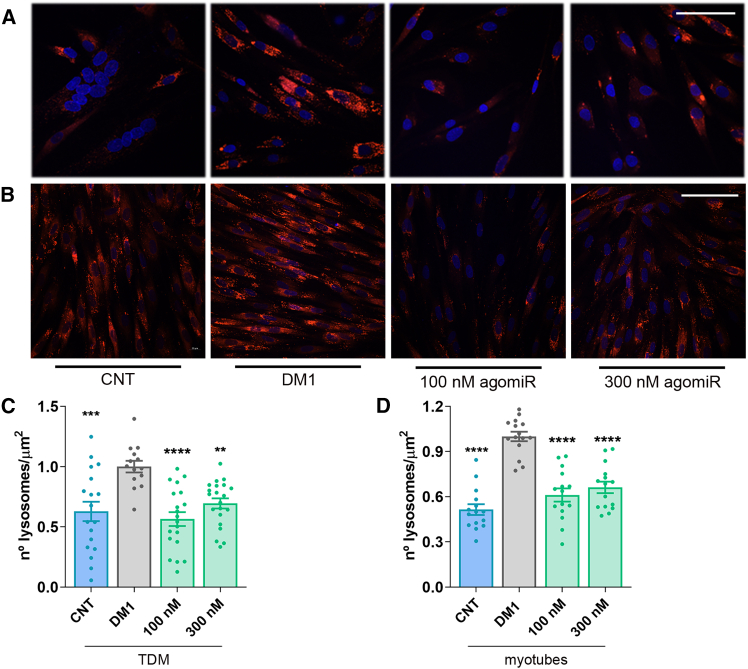
Myotonic dystrophy type 1 (DM1) is a multisystem genetic disorder characterized by muscle disease, including muscle atrophy partially originating from excessive autophagy. We have previously demonstrated that excessive Musashi-2 (MSI2) repressed the biogenesis of miR-7, which derepressed autophagy, ultimately contributing to muscle atrophy, but the root cause of MSI2 dysregulation is unknown. Herein, we investigate the intricate role of miR-107 in DM1 pathogenesis, focusing on its involvement in the MSI2>miR-7>autophagy axis as this microRNA (miRNA) directly regulates MSI2. We found that in DM1, miR-107 function is impaired because expanded CUG repeats sequester it, causing an increase in the expression of its targets, including MSI2. Through different experimental approaches, including luciferase reporter assays, differential scanning fluorimetry, and electrophoretic mobility shift assay (EMSA), we confirm that miR-107 directly binds to CUG repeats in mutant DMPK transcripts. DMPK posttranscriptional regulation by miR-107 was also demonstrated. Modulation of miR-107 in a DM1 cell model context significantly affects its downstream targets, MSI2 and miR-7, thus decreasing excessive autophagic markers and restoring pathological phenotypes such as ribonuclear foci and impaired fusion capacity. These findings underscore the critical role of miR-107 in regulating the MSI2>miR-7>autophagy axis and support this miRNA as a promising therapeutic target for correcting muscle dysfunction in DM1.

Keywords: ASO; CUG repeats; DM1; DMPK; MSI2; MT: Oligonucleotides: Therapies and Applications; miR-107; miRNA; muscle atrophy.


Conflict of interest statement

The authors declare no competing interests.

Figures

None
Graphical abstract
Figure 1
Figure 1
miR-107 dysregulation in DM1 (A) Illustration depicting the complementarity between miR-107 and 20 CUG triplets. (B) Representation of the mean expression of miR-107 targets in DM1 TDMs differentiated over 4 (n = 3) or 8 days (n = 3) and in patient biopsies (n = 5 CNT and 22 DM1) was plotted as a bar. Individual gene expression was denoted as a point. Counts were represented on a logarithmic scale. To evaluate enrichment in upregulated genes, a binary contingency table between up- and downregulated genes, miR-107 and non-miR-107 targets was constructed to perform a Fisher's exact test for each type of sample. Only genes with a log fold change over 0 and an adjusted p value < 0.05 were considered. (C) The boxplot represents normalized MSI2 expression levels (log-transformed normalized counts). Statistical analysis was performed using the quasi-likelihood F-test implemented in the edgeR package, with statistical significance denoted as NS p > 0.05, ∗∗p < 0.01, and ∗∗∗p < 0.001. The horizontal line within each box represents the median expression level, while the upper and lower edges of the box correspond to the third and first quartiles, respectively, capturing the interquartile range (IQR). Whiskers extend to the smallest and largest values within 1.5 times the IQR, and any points beyond these are considered outliers. (D) Interaction plot showing the relative expression of miR-107 in the nucleus and cytoplasm from CNT and DM1 myoblasts obtained from RNA-seq data (n = 5). (E–G) Quantification of relative miR-107 levels in TDMs at 0 and 7 (n = 4) days of differentiation, in immortalized myoblasts at day 0 and 7 of differentiation (n = 4), and biopsies (n = 14) by RT-qPCR. The bar graphs show mean ± SEM. ∗p < 0.05, ∗∗∗p < 0.001, and ∗∗∗∗p < 0.0001 according to Fisher's exact test (B), Student’s t test (G), or one-way ANOVA test (E and F) with post hoc tests when necessary.
Figure 2
Figure 2
miR-107 represses DMPK expression and directly binds CUG repeats (A and B) Relative luciferase activity measured after 72 h (A) or 96 h (B) of co-transfection of HEK293 cells with reporter constructs containing 0 (VTC), 5, 44, 53, or 72 CTG repeats, along with 100 nM miR-107 mimic. The asterisks above the bars indicate the level of statistical significance obtained by comparing the condition marked with the asterisk to the VTC + agomiR group (∗p < 0.05, ∗∗p < 0.01, and ∗∗∗p < 0.001), according to a one-way ANOVA test followed by and Tukey’s HSD post hoc correction. Asterisks over the brackets indicate comparisons of each condition with the corresponding CUG repeats without the miR-107 mimic (∗p < 0.05 and ∗∗p < 0.001, according to Student’s t test). Firefly luciferase activity was normalized to Renilla luciferase. The bar graphs show mean ± SEM. calculated from three independent experiments. (C and D) Normalized fluorescence intensity of RiboGreen fluorescence versus temperature at different miR-107 concentrations with CUG20 (C) or CGA20 as a control (D). (E and F) Representative EMSA blots of CUG20 with increasing concentrations of miR-107 (E) or control RNA (cRNA) (F). (G and H) Quantification of the percentage of each band in EMSAs combining CUG20 probe, and miR-107 mimic (G) or cRNA control (H). The results presented in EMSA assay are the average of three (G) and two (H) independent experiments. (I and J) Fluorimetric titration of CUG20-TO with agomiR-107 (I) or cRNA (J) in NaCac buffer (10 mM NaCac [pH 7.4], λexc = 495 nm). Each spectrum corresponds to different ratios between 2 μM CUG20 and agomiR-107 and cRNA ranging from 0.25 (purple) to 20 (red) equivalents. (K) Plot of the ratio between fluorescence emission and initial fluorescence emission (F/Fo) versus molar ratio ([miR]/[CUG20]).
Figure 3
Figure 3
CUG repeats exert a repressive effect on DMPK expression mediated by miR-107 (A) Cell growth inhibition assay by MTS/PMS method. DM1 TDM were transfected with agomiR-107 ranging from 1 nM to 1 μM (n = 4). TC50 (2,106 nM) was obtained using the least-squares non-linear regression model. Vertical dashed lines denote agomiR concentrations used for further studies: 100 and 300 nM. (B–F) Quantification of DMPK transcripts (B and E) or protein (C, D, and F) in DM1 (B and C) or CNT (D) TDM differentiated for 7 days (n = 3/4) and CRISPR-edited myotubes (3B11Δ/Δ and 4A3 Δ/Δ) (E and F) untreated or treated with 100 nM agomiR-107 (n = 3). Unedited myotubes are missing in (F) since DMPK protein levels were below the detection capacity of the technique. Representative blots are next to protein quantification graphs. DMPK transcripts were normalized to the endogenous expression of the mean of GAPDH and GPI, while DMPK protein was relative to GAPDH expression. The bar graphs show mean ± SEM. ∗p < 0.05 and ∗∗p < 0.01 according to Student’s t test (B, C, and D) or one-way ANOVA test (E and F) and post hoc tests when necessary.
Figure 4
Figure 4
Modulating miR-107 levels in DM1 ameliorates foci-related phenotypes (A and B) Quantification of foci number per cell (A) and the percentage of nuclei without foci (B) obtained from in situ hybridization in CNT and DM1 TDM untreated or treated with the indicated concentrations of miR-107 mimic. Chromomycin (chmc) (4 μM) was used as a positive control. (C and D) Representative confocal images of MBNL1 (green) immunostaining and fluorescent in situ hybridization showing the ribonuclear foci using a CAG probe (red) in control and DM1 TDM (C) or immortalized myotubes (D) untreated or supplemented with the indicated concentrations of agomiR-107. Nuclei were counterstained with DAPI and white arrows indicate ribonuclear foci. Between 100 and 200 nuclei were analyzed per condition. Scale bars, 20 μm. (E and F) Percentage of colocalization between foci (measured as Cy3 positive pixels) and MBNL1 (FITC positive pixels) and normalized to the total number of pixels in TDM (E) or immortalized myotubes (F) per image. The bar graphs show mean ± SEM. ∗p < 0.05, ∗∗p < 0.01, ∗∗∗p < 0.001, and ∗∗∗∗p < 0.0001 according to a one-way ANOVA test and Tukey’s HSD post hoc test when necessary (A, B, E, and F).
Figure 5
Figure 5
AgomiR-107 treatment in DM1 cells restores MSI2 and miR-7 levels (A–C) Quantification (A) and representative blots (B and C) of MSI2 protein in 7-day-differentiated TDM and immortalized myotubes treated with miR-107 mimic at the indicated concentrations (n = 3). (D and E) Quantification of MSI2 transcripts (D) and relative miR-7 (E) levels by RT-qPCR in the same experimental conditions as in (A). miR-7 quantification is relative to endogenous U1 and U6 levels, and MSI2 transcripts were normalized to endogenous expression of the mean of GAPDH and GPI. Asterisks indicate statistically significant differences between untreated DM1 cells and the conditions indicated in the graphs. The bar graphs show mean ± SEM. ∗p < 0.05, ∗∗p < 0.01, and ∗∗∗p < 0.001, according to one-way ANOVA test and Tukey’s HSD post hoc test when necessary (A, D, and E).
Figure 6
Figure 6
Replenishing miR-107 in DM1 cells restores autophagic pathway activity Quantification (A, C, E, G, I, and K) and representative blots (B, D, F, H, J, and L) of immunoreactive bands with indication of molecular weight sizes to the right in kDa. ATG4A, ATG7, and P62 were immunodetected in control (CNT) and DM1 TDMs (A–F) or myotubes (G–L) untreated or treated with the indicated concentrations of agomiR-107 (n = 3) and differentiated for 7 days. Proteins were normalized to endogenous expression of β-ACT (A–F) or GAPDH (G–L). All comparisons were performed against untreated DM1 cells. The bar graphs show mean ± SEM. In all graphs, ∗p < 0.05 and ∗∗p < 0.01 according to one-way ANOVA test and Tukey’s HSD post hoc test when necessary (A, C, E, G, I, and K).
Figure 7
Figure 7
AgomiR-107 restores autophagic activity in DM1 cells (A and B) Representative confocal images of LysoTracker staining (red) in CNT, untreated DM1 or DM1 supplemented with the indicated concentrations of miR-107 mimic in TDM (A) or myotubes (B). Nuclei were counterstained with DAPI. Scale bars, 100 μm. (C and D) Quantification of the number of lysosomes per μm2 in each of the conditions described in A (C) or B (D) (between 14 and 22 images were analyzed per condition). All comparisons were performed against untreated DM1 cells. The bar graphs show mean ± SEM. In all graphs, ∗∗p < 0.01, ∗∗∗p < 0.001, and ∗∗∗∗p < 0.0001 according to one-way ANOVA test and Tukey’s HSD post hoc test when necessary (C and D).
Figure 8
Figure 8
Replenishing miR-107 promotes muscle cell differentiation in DM1 cells (A and B) Representative confocal microscopy images of immunofluorescence using an anti-desmin antibody (green) in CNT and DM1 TDM (A) or myotubes (B). The DM1 lines were treated with 100 or 300 nM agomiR-107 for 48 h. In all cases, cells were differentiated for 7 days. Nuclei were counterstained with DAPI. Scale bars, 100 μm. (C–F) Quantification of fusion index (C and D) and myotube diameter (E and F) in TDMs (C and E) and myotube (D and F). The bar graphs show mean ± SEM. ∗p < 0.05, ∗∗p < 0.01, ∗∗∗p < 0.001, and ∗∗∗∗p < 0.0001 according to one-way ANOVA test and Tukey’s HSD post hoc test when necessary (C, D, E, and F).

References

    1. André L.M., Ausems C.R.M., Wansink D.G., Wieringa B. Abnormalities in Skeletal Muscle Myogenesis, Growth, and Regeneration in Myotonic Dystrophy. Front. Neurol. 2018;9 doi: 10.3389/FNEUR.2018.00368. - DOI - PMC - PubMed
    1. Hamel J.I. Myotonic Dystrophy. Continuum. 2022;28:1715–1734. doi: 10.1212/CON.0000000000001184. - DOI - PubMed
    1. Rosado Bartolomé A., Puertas Martín V., Domínguez González C., Ramos Miranda M. [Cognitive impairment in myotonic dystrophy type 1 (Steinert’s disease)] SEMERGEN, Soc. Esp. Med. Rural Generalista. 2022;48:208–213. doi: 10.1016/J.SEMERG.2022.01.013. - DOI - PubMed
    1. Brook J.D., McCurrach M.E., Harley H.G., Buckler A.J., Church D., Aburatani H., Hunter K., Stanton V.P., Thirion J.P., Hudson T., et al. Molecular basis of myotonic dystrophy: expansion of a trinucleotide (CTG) repeat at the 3’ end of a transcript encoding a protein kinase family member. Cell. 1992;68:799–808. doi: 10.1016/0092-8674(92)90154-5. - DOI - PubMed
    1. Taylor K., Sznajder L.J., Cywoniuk P., Thomas J.D., Swanson M.S., Sobczak K. MBNL splicing activity depends on RNA binding site structural context. Nucleic Acids Res. 2018;46:9119–9133. doi: 10.1093/NAR/GKY565. - DOI - PMC - PubMed

LinkOut - more resources