

Beyond the label "major depressive disorder"-detailed characterization of study population matters for EEG-biomarker research
- PMID: 40600188
- PMCID: PMC12209243
- DOI: 10.3389/fnins.2025.1595221
Beyond the label "major depressive disorder"-detailed characterization of study population matters for EEG-biomarker research
Abstract
Introduction: Major Depressive Disorder (MDD) is a prevalent, multi-faceted psychiatric disorder influenced by a plethora of physiological and environmental factors. Neuroimaging biomarkers such as diagnosis support systems based on electroencephalography (EEG) recordings have the potential to substantially improve its diagnostic procedure. Research on these biomarkers, however, provides inconsistent findings regarding the robustness of specific markers. One potential source of these contradictions that is frequently neglected may arise from the variability in study populations.
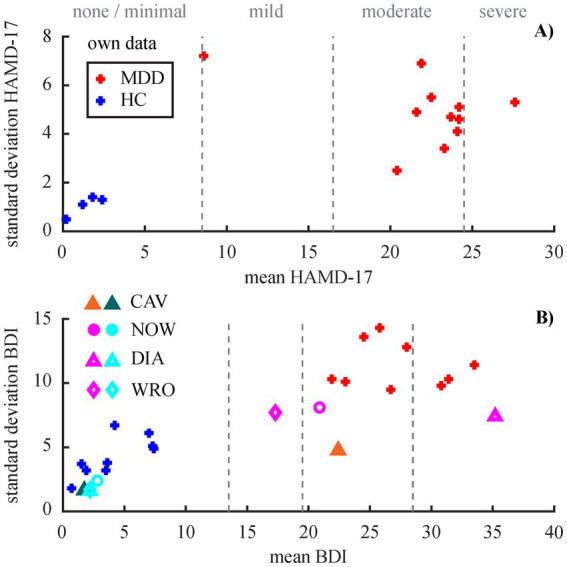
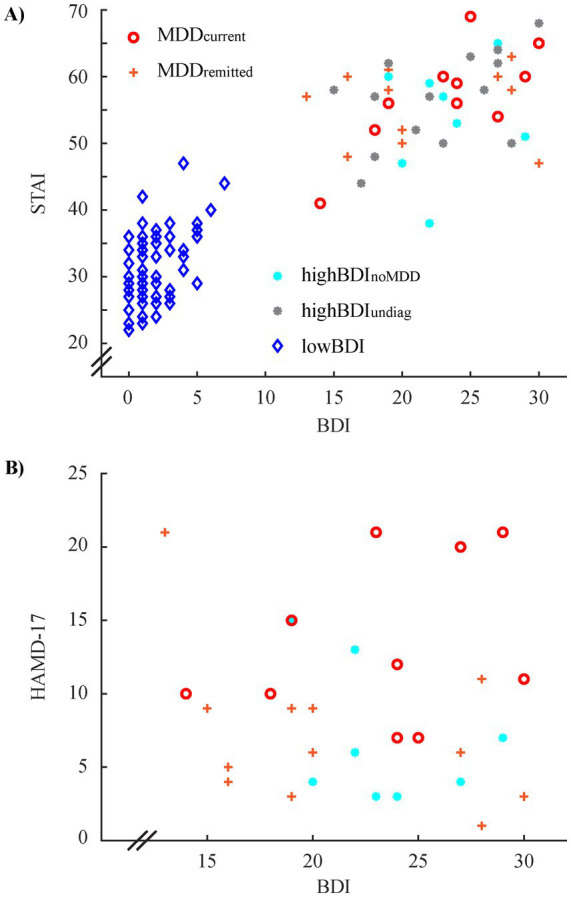
Methods: This study systematically reviews 66 original studies from the last 5 years that investigate resting-state EEG-biomarker for MDD detection or diagnosis. The study populations are compared regarding demographic factors, diagnostic procedures and medication, as well as neuropsychological characteristics. Furthermore, we investigate the impact these factors have on the biomarkers, if they were included in the analysis. Finally, we provide further insights into the impact of diagnostic choices and the heterogeneity of a study population based on exploratory analyses in two publicly available data sets.
Results: We find indeed a large variability in the study populations with respect to all factors included in the review. Furthermore, these factors are often neglected in analyses even though the studies that include them tend to find effects.
Discussion: In light of the variability in diagnostic procedures and heterogeneity in neuropsychological characteristics of the study populations, we advocate for more differentiated target variables in biomarker research then simply MDD and healthy control. Furthermore, the study populations need to be more extensively described and analyses need to include this information in order to provide comparable findings.
Keywords: biomarker; diagnosis; electroencephalography; label; major depressive disorder; study population.
Copyright © 2025 Mähler and Reichenbach.
Conflict of interest statement
The authors declare that the research was conducted in the absence of any commercial or financial relationships that could be construed as a potential conflict of interest. The author(s) declared that they were an editorial board member of Frontiers, at the time of submission. This had no impact on the peer review process and the final decision.
Figures


Similar articles
-
Signs and symptoms to determine if a patient presenting in primary care or hospital outpatient settings has COVID-19.Cochrane Database Syst Rev. 2022 May 20;5(5):CD013665. doi: 10.1002/14651858.CD013665.pub3. Cochrane Database Syst Rev. 2022. PMID: 35593186 Free PMC article.
-
Home treatment for mental health problems: a systematic review.Health Technol Assess. 2001;5(15):1-139. doi: 10.3310/hta5150. Health Technol Assess. 2001. PMID: 11532236
-
Behavioral interventions to reduce risk for sexual transmission of HIV among men who have sex with men.Cochrane Database Syst Rev. 2008 Jul 16;(3):CD001230. doi: 10.1002/14651858.CD001230.pub2. Cochrane Database Syst Rev. 2008. PMID: 18646068
-
Omega-3 fatty acids for depression in adults.Cochrane Database Syst Rev. 2021 Nov 24;11(11):CD004692. doi: 10.1002/14651858.CD004692.pub5. Cochrane Database Syst Rev. 2021. PMID: 34817851 Free PMC article.
-
Antidepressants for the treatment of depression in people with cancer.Cochrane Database Syst Rev. 2018 Apr 23;4(4):CD011006. doi: 10.1002/14651858.CD011006.pub3. Cochrane Database Syst Rev. 2018. Update in: Cochrane Database Syst Rev. 2023 Mar 31;3:CD011006. doi: 10.1002/14651858.CD011006.pub4. PMID: 29683474 Free PMC article. Updated.
References
-
- American Psychiatric Association (2013). Diagnostic and statistical manual of mental disorders. Washington, DC: American psychiatric association.
-
- Beck A. T., Steer R. A., Brown G. (1996). Beck depression inventory–II. Psychol. Assess.
Publication types
LinkOut - more resources
Full Text Sources