

Early and Late ERP Correlates of Conscivousness- A Direct Comparison Between Visual and Auditory Modalities
- PMID: 40600519
- PMCID: PMC12217428
- DOI: 10.1111/psyp.70099
Early and Late ERP Correlates of Conscivousness- A Direct Comparison Between Visual and Auditory Modalities
Abstract
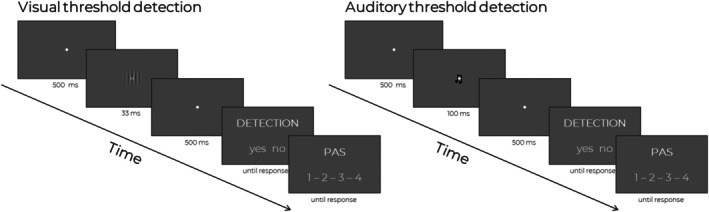
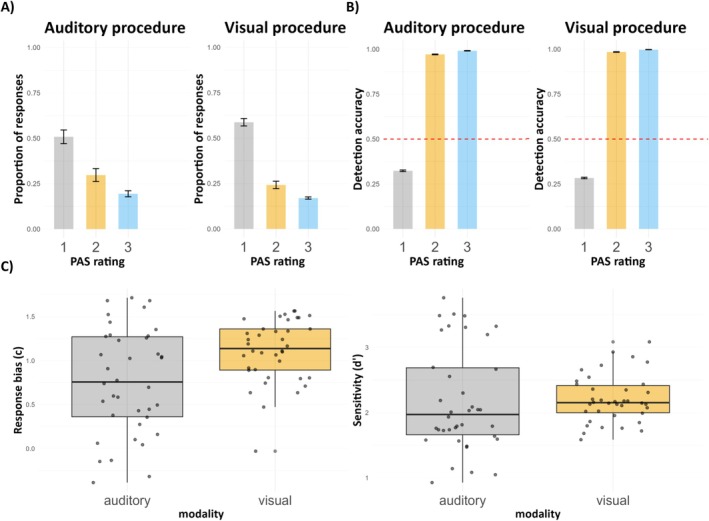
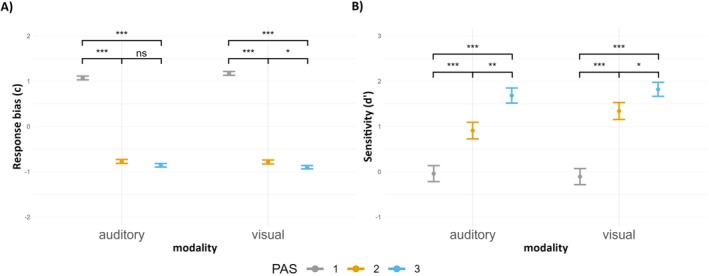
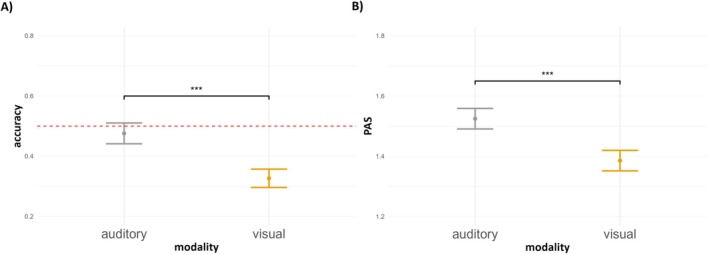
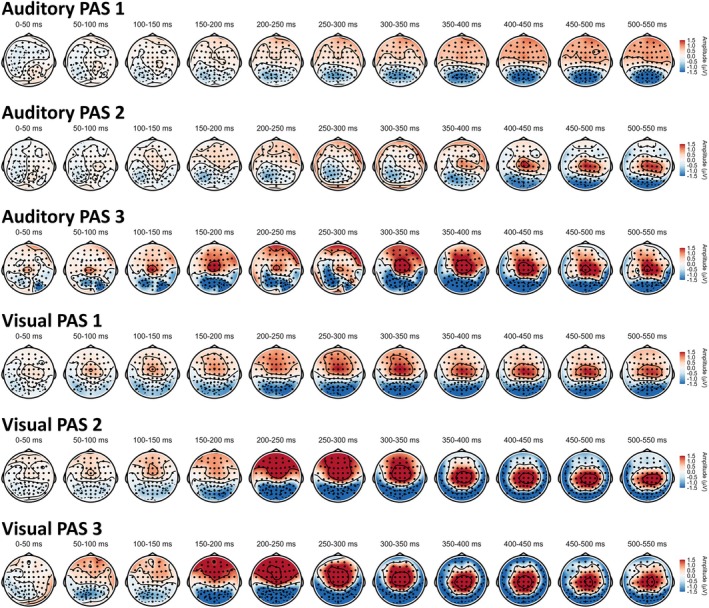
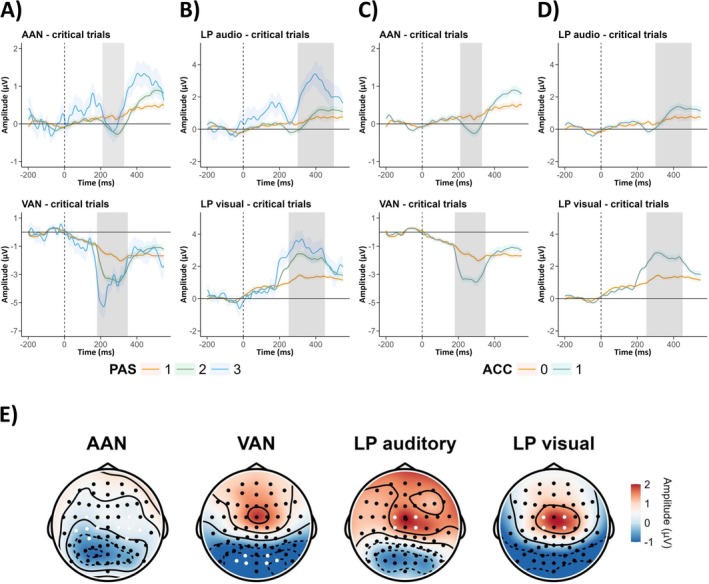
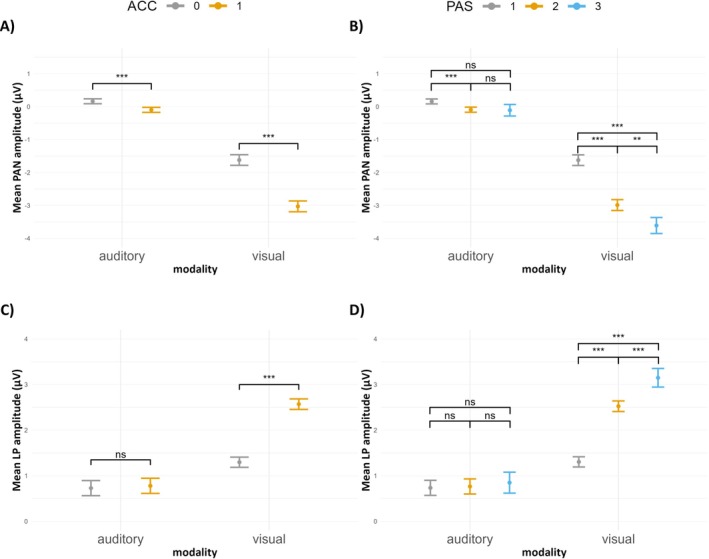
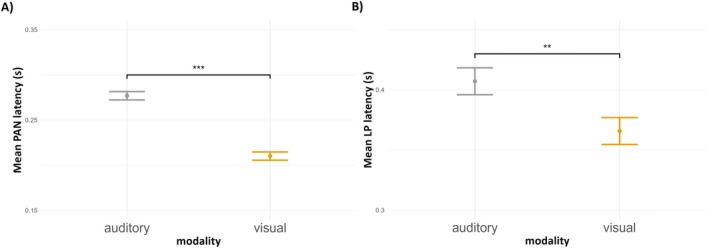
The majority of previous research on neural correlates of consciousness (NCC) have used the visual system as a model. However, to what extent reported findings generalize to other sensory modalities has not been comprehensively investigated. To fill this gap we directly compared visual and auditory NCCs by testing the same group of participants with two analogous procedures. Participants were presented with near-threshold visual and auditory stimuli followed by a detection task and Perceptual Awareness Scale (PAS). On the behavioral level, as expected from visual awareness studies, PAS ratings were highly correlated with accuracy in the detection task. Analysis of EEG data revealed that analogous ERP components-early visual or auditory awareness negativity (VAN and AAN) were related to perceptual awareness, but regarding late positivity (LP), it was related to perceptual awareness only in the visual modality. Further, we found that VAN and visual LP exhibited shorter latencies than respective auditory components suggesting earlier access of visual stimuli to consciousness, compared to auditory ones. Finally, neither estimated perceptual thresholds nor amplitudes and latencies of the awareness-related ERPs components were correlated between modalities, suggesting a lack of a close link between visual and auditory perceptual mechanisms. Therefore, the observed differences between visual and auditory modalities indicate the investigated NCC are rather modality-specific, and thus that neither of the proposed measures track consciousness independently to the content-related processing.
Keywords: auditory awareness negativity; awareness; late positivity; perception; visual awareness negativity.
© 2025 The Author(s). Psychophysiology published by Wiley Periodicals LLC on behalf of Society for Psychophysiological Research.
Conflict of interest statement
The authors declare no conflicts of interest.
Figures
Similar articles
-
Predicted Sensory Modality Determines the Timing and Topographies of Omitted Stimulus Potentials.Psychophysiology. 2025 Jun;62(6):e70097. doi: 10.1111/psyp.70097. Psychophysiology. 2025. PMID: 40556508 Free PMC article.
-
Behavioral interventions to reduce risk for sexual transmission of HIV among men who have sex with men.Cochrane Database Syst Rev. 2008 Jul 16;(3):CD001230. doi: 10.1002/14651858.CD001230.pub2. Cochrane Database Syst Rev. 2008. PMID: 18646068
-
Systemic pharmacological treatments for chronic plaque psoriasis: a network meta-analysis.Cochrane Database Syst Rev. 2017 Dec 22;12(12):CD011535. doi: 10.1002/14651858.CD011535.pub2. Cochrane Database Syst Rev. 2017. Update in: Cochrane Database Syst Rev. 2020 Jan 9;1:CD011535. doi: 10.1002/14651858.CD011535.pub3. PMID: 29271481 Free PMC article. Updated.
-
From Sound to Sight: The Cross-Modal Spread of Location-Based Inhibition of Return.Psychophysiology. 2025 Aug;62(8):e70123. doi: 10.1111/psyp.70123. Psychophysiology. 2025. PMID: 40762121
-
Event-related potential correlates of consciousness in simple auditory hallucinations.Neuroimage. 2025 Apr 15;310:121168. doi: 10.1016/j.neuroimage.2025.121168. Epub 2025 Mar 22. Neuroimage. 2025. PMID: 40127874
References
-
- Bates, D. , Mächler M., Bolker B., and Walker S.. 2014. “Fitting Linear Mixed‐Effects Models Using lme4.” arXiv Preprint arXiv:1406.5823. 10.48550/arXiv.1406.5823. - DOI
-
- Benjamini, Y. , and Hochberg Y.. 1995. “Controlling the False Discovery Rate: A Practical and Powerful Approach to Multiple Testing.” Journal of the Royal Statistical Society: Series B: Methodological 57, no. 1: 289–300. 10.1111/j.2517-6161.1995.tb02031. - DOI
Publication types
MeSH terms
Grants and funding
LinkOut - more resources
Full Text Sources
Miscellaneous
