. 2025 Jul;14(13):e71008.
doi: 10.1002/cam4.71008.

Identification of Crucial Genes Associated With MYCN-Driven Neuroblastoma Based on Single-Cell Analysis and Machine Learning

Affiliations

Identification of Crucial Genes Associated With MYCN-Driven Neuroblastoma Based on Single-Cell Analysis and Machine Learning

Jiasi Zhang et al. Cancer Med. 2025 Jul.

Abstract

Background: Neuroblastoma (NB) with MYCN amplification is strongly correlated with high-risk stratification and poor prognosis. However, the underlying mechanisms remain incompletely understood. Elucidating these pathways is critical for advancing personalized treatments for MYCN-driven NB.

Methods: We performed single-cell transcriptomic analysis comparing NB samples with and without MYCN. Key genes were then identified using machine learning based random survival forest (RSF) and nomogram analyses. The influence of key genes on immune infiltration and molecular mechanisms driving NB progression were further investigated. Finally, we visualized the expression levels and global function of these genes in single-cell datasets and validated their expression in patient samples through RT-qPCR.

Results: Single-cell transcriptome analysis of GSE218450 identified marker genes specific to NB cells. RSF and nomogram analyses revealed that overexpression of CKB, PCSK1N, OTUB1, and VGF is associated with poor prognosis, whereas upregulation of NTRK3 indicates a favorable prognosis. These genes are significantly associated with immune cell infiltration and play an important role in modulating the immune microenvironment. Pathway analysis further showed that these genes influence critical signaling pathways, including the Wnt pathway, and interact with tumor-related genes. Additionally, we confirmed that CKB and PCSK1N are positively correlated with MYCN in NB cell lines and are significantly overexpressed in MYCN-amplified NB patients.

Conclusions: Our results provide molecular insights into the transcriptional changes associated with MYCN amplification in NB. In particular, the identification of CKB and PCSK1N suggests their potential role in driving tumor progression, making them promising targets for novel treatments in MYCN-driven NB.

Keywords: MYCN amplification; neuroblastoma; nomogram model; random survival forests; single‐cell transcriptome.


Conflict of interest statement

The authors declare no conflicts of interest.

Figures
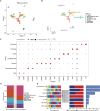
FIGURE 1
FIGURE 1
Uniform Manifold Approximation and Projection (UMAP) analysis and cell types annotations between MYCN‐amplified and non‐amplified NB samples. A total of 12 NB samples (5 MYCN‐amplified and 7 MYCN non‐amplified) was obtained from GEO database, with accession number GSE218450. (A) The spatial relationships of 10 distinct cell clusters were visualized using UMAP analysis. (B) Annotation assigned 10 clusters into seven distinct cell types: T cells, neuroblastoma cells, neurons, endothelial cells, B cells, fibroblasts, and monocytes. (C) A bubble chart displaying classic markers of seven cell types. (D) A bar chart comparing seven cell proportions between MYCN‐amplified and non‐amplified groups. (E) A bar chart showing seven cell proportions in 12 NB samples.
FIGURE 2
FIGURE 2
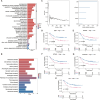
Key genes associated with MYCN amplification were identified by random survival forest (RSF) and survival analyses. 405 marker genes of NB cells were employed for pathway analysis. (A) Gene Ontology (GO) analysis revealed enrichment in pathways such as the regulation of neuron projection development, developmental cell growth, and the synaptic vesicle cycle. (B) Kyoto Encyclopedia of Genes and Genomes (KEGG) analysis indicated enrichment in pathways including cell adhesion molecules, oxidative phosphorylation, and the cell cycle pathway. (C) Marker genes were analyzed by the RSF method to identify key genes associated with poor prognosis in NB. Genes with a relative importance score greater than 0.8 were designated as final markers, and the order of importance was illustrated in right figure. (D‐H) Survival analyses were performed on the five high‐importance genes, including creatine kinase B (CKB) (D), neurotrophin receptor tyrosine kinase 3 (NTRK3) (E), OTU domain‐containing ubiquitin aldehyde‐binding protein 1 (OTUB1) (F), proprotein convertase subtilisin/kexin type 1 inhibitor (PCSK1N) (G), and nerve growth factor inducible (VGF) (H).
FIGURE 3
FIGURE 3
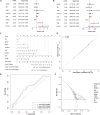
Single‐factor, multifactorial, and nomogram prediction model analyses. (A) The single‐factor Cox regression analyses on key genes including PCSK1N, VGF, NTRK3, CKB, and OTUB1. Hazard ratio > 1 indicates a risk factors, while hazard ratio < 1 indicates a protective factor. (B) The multifactorial Cox regression analyses on key genes including PCSK1N, VGF, NTRK3, CKB, and OTUB1. Hazard ratio > 1 indicates a risk factors, while hazard ratio < 1 indicates a protective factor. (C) Logistic regression analyses were performed by two groups, high and low expression, based on the median values of key genes. (D) Predictive analyses were performed for both 3‐year and 5‐year outcomes in NB. (E) Receiver operating characteristic (ROC) curves were plotted with the corresponding area under curve (AUC) values. (F) Decision curve analysis (DCA) results were conducted on key genes including PCSK1N, VGF, NTRK3, CKB, and OTUB1.
FIGURE 4
FIGURE 4
The impact of key genes on immune infiltration and associations. (A‐B) The proportions of immune cell content in NB patients with and without MYCN amplification (A), as well as the correlations among immune cells (B). (C) The differences in the levels of various immune cells between the MYCN‐amplificated and non‐amplificated groups. (D–H) The specific relationships between key genes, including CKB (D), NTRK3 (E), OTUB1 (F), PCSK1N (G), and VGF (H), and immune cells analyzed based on bulk transcriptomic data of NB patients. (I–M) The associations between five key genes and various immune factors, including receptors (I), major histocompatibility complex (MHC) molecules (J), immune stimulatory factors (K), immunoinhibitor factors (L), and chemokines (M) analyzed by TISIDB database.
FIGURE 5
FIGURE 5
The molecular mechanisms of key genes on NB progression by MYCN amplification. (A‐E) Gene Set Enrichment Analysis (GSEA) of key genes, including CKB (A), NTRK3 (B), OTUB1 (C), PCSK1N (D), and VGF (E) based on NB bulk transcriptome. (F–J) Gene Set Variation Analysis (GSVA) of key genes, including CKB (F), NTRK3 (G), OTUB1 (H), PCSK1N (I), and VGF (J) based on NB bulk transcriptome. (K) Common transcription factors regulating these five key genes and performed enrichment analysis using cumulative recovery curves. (L) Enriched motifs of these key genes and their corresponding transcription factors. (M) Significant intergroup expression differences for genes such as MYCN, KIF1B, NBAT1, TP53, MYCNOS, MYC, PTPN11, LMO1, PIK3CA, NME1, SNHG16, and SMARCA4. (N) Correlation analysis between key genes VGF or CKB and tumor‐related genes.
FIGURE 6
FIGURE 6
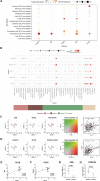
Expression level and global function analysis of key genes in scRNA‐Seq dataset and patient samples. (A) The analyses of gene expression profiles based on patient samples with and without MYCN amplification across seven cell types, including T cells, neuroblastoma cells, neurons, endothelial cells, B cells, fibroblasts, and monocytes. (B) The global analyses of immune and metabolic pathways using single‐cell data, employing the AUCell function. Bubble plots were used to visualize differences in pathway activity related to immune‐metabolic and other signaling pathways. (C, D) The co‐expression patterns and correlation analyses between the expression level of key genes CKB (C) or PCSK1N (D) and tumor‐related MYCN gene. (E, F) The correlation analyses between the expression level of key genes CKB (E) or PCSK1N (F) and tumor‐related MYCN gene in the Cancer Cell Line Encyclopedia (CCLE) database. (G, H) The relative mRNA levels of key genes CKB (G) or PCSK1N (H) in the samples of NB patients with MYCN amplification or not.

Similar articles

References

    1. Zeineldin M., Patel A. G., and Dyer M. A., “Neuroblastoma: When Differentiation Goes Awry,” Neuron 110, no. 18 (2022): 2916–2928. - PMC - PubMed
    1. Gomez R. L., Ibragimova S., Ramachandran R., Philpott A., and Ali F. R., “Tumoral Heterogeneity in Neuroblastoma,” Biochimica Et Biophysica Acta. Reviews on Cancer 1877, no. 6 (2022): 188805. - PubMed
    1. Pinto N. R., Applebaum M. A., Volchenboum S. L., et al., “Advances in Risk Classification and Treatment Strategies for Neuroblastoma,” Journal of Clinical Oncology 33, no. 27 (2015): 3008–3017. - PMC - PubMed
    1. Glocker E. O., Kotlarz D., Boztug K., et al., “Inflammatory Bowel Disease and Mutations Affecting the Interleukin‐10 Receptor,” New England Journal of Medicine 361, no. 21 (2009): 2033–2045. - PMC - PubMed
    1. Corrigendum: Molecular Targeting Therapies for Neuroblastoma: Progress and Challenges,” Medicinal Research Reviews 42, no. 1 (2022): 641. - PMC - PubMed