

Retinal Angiogenesis in Methamphetamine Self-Administration Rats
- PMID: 40600761
- PMCID: PMC12227027
- DOI: 10.1167/iovs.66.9.8
Retinal Angiogenesis in Methamphetamine Self-Administration Rats
Abstract
Purpose: Given the evidence of a link between methamphetamine (METH) exposure and retinal vascular abnormalities, this study aims to investigate the molecular and cellular mechanisms underlying METH-induced retinal angiogenesis using a unique self-administration rat model and primary rat retinal microvascular endothelial cells (RRMECs).
Method: To model the impact of compulsive use of METH, rats underwent an 8-week METH long-access self-administration protocol, with retinal tissues analyzed using whole retinal flatmount imaging and vascular network quantification. Proteomic analysis via liquid chromatography/tandem mass spectrometry identified differentially expressed proteins, while RRMECs were treated with METH to assess molecular changes through immunoblotting and quantitative RT-PCR.
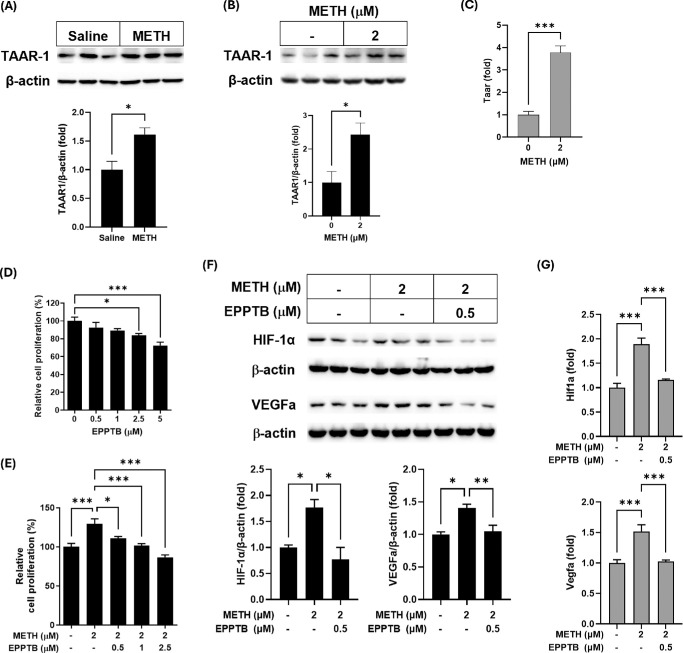
Results: Consistent with compulsive use of METH in humans and our previous experience with this model, rats self-administered high levels of METH. METH self-administration elevated dopamine levels in the vitreous humor and increased vascular density in both superficial and deep capillary layers across central, mid-peripheral, and peripheral retina regions. Proteomic analysis revealed 148 differentially expressed retinal proteins, with gene ontology enrichment highlighting pathways related to abiotic stimuli, hypoxia, and ischemia. Increased hypoxia inducible factor-1α (HIF-1α) and vascular endothelial growth factor a (VEGFa) expression confirmed a hypoxia-driven angiogenesis process, further supported by in vitro experiments showing enhanced endothelial cell proliferation and HIF-1α/VEGFa expression. Additionally, TAAR-1 upregulation in both the retina and endothelial cells was observed, with TAAR-1 antagonism reducing METH-induced endothelial cell proliferation and modulating HIF-1α/VEGFa signaling.
Conclusions: METH self-administration leads to significant retinal vascular changes and angiogenesis, driven by upregulation of hypoxia-related pathways. TAAR-1 plays a critical role in endothelial cell proliferation through the HIF-1α/VEGFa pathway, potentially contributing to pathological retinal conditions.
Conflict of interest statement
Disclosure:
Figures


Similar articles
-
Inhibition of Endothelial HIF-1α by IDF-11774 Attenuates Retinal Neovascularization and Vascular Leakage.Invest Ophthalmol Vis Sci. 2025 Jul 1;66(9):47. doi: 10.1167/iovs.66.9.47. Invest Ophthalmol Vis Sci. 2025. PMID: 40668060 Free PMC article.
-
Neuroprotective effects of Rosavin via HIF-1α signaling in a rat model of ischemic stroke.Phytomedicine. 2025 Sep;145:157068. doi: 10.1016/j.phymed.2025.157068. Epub 2025 Jul 13. Phytomedicine. 2025. PMID: 40682944
-
[Buyang Huanwu Decoction promotes angiogenesis after oxygen-glucose deprivation/reoxygenation injury of bEnd.3 cells by regulating YAP1/HIF-1α signaling pathway via caveolin-1].Zhongguo Zhong Yao Za Zhi. 2025 Jul;50(14):3847-3856. doi: 10.19540/j.cnki.cjcmm.20250213.705. Zhongguo Zhong Yao Za Zhi. 2025. PMID: 40904071 Chinese.
-
Clinicopathological and prognostic significance of hypoxia-inducible factor-1 alpha in lung cancer: a systematic review with meta-analysis.J Huazhong Univ Sci Technolog Med Sci. 2016 Jun;36(3):321-327. doi: 10.1007/s11596-016-1586-7. Epub 2016 Jul 5. J Huazhong Univ Sci Technolog Med Sci. 2016. PMID: 27376798
-
Anti-vascular endothelial growth factor for neovascular glaucoma.Cochrane Database Syst Rev. 2023 Apr 3;4(4):CD007920. doi: 10.1002/14651858.CD007920.pub4. Cochrane Database Syst Rev. 2023. PMID: 37010901 Free PMC article.
References
-
- Substance Abuse and Mental Health Services Administration. Key Substance Use and Mental Health Indicators in the United States: Results from the 2022 National Survey on Drug Use and Health. HHS Publication No. PEP23-07-01-006, NSDUH Series H-58. Rockville, MD: Center for Behavioral Health Statistics and Quality, Substance Abuse and Mental Health Services Administration; 2023.
-
- Talebnejad MR, Khazaei P, Jahanbani-Ardakani H, Saberikia Z, Moghimi Sarani E, Khalili MR. Effects of chronic methamphetamine abuse on the retinal nerve fiber layer, ganglion cell layer and Bruch's membrane opening minimum rim width. Neurotoxicology. 2020; 80: 140–143. - PubMed
-
- Mahjoob M, Maleki AR, Askarizadeh F, Heydarian S, Rakhshandadi T. Macula and optic disk features in methamphetamine and crystal methamphetamine addicts using optical coherence tomography. Int Ophthalmol. 2022; 42: 2055–2062. - PubMed
-
- Mahjoob M, Heydarian S. Changes in corneal and anterior chamber indices due to methamphetamine abuse. Clin Exp Optom. 2022; 105: 721–725. - PubMed
MeSH terms
Substances
Grants and funding
LinkOut - more resources
Full Text Sources
Medical
