

The genome of Hippophae salicifolia provides new insights into the sexual differentiation of sea buckthorn
- PMID: 40601420
- PMCID: PMC12218201
- DOI: 10.1093/gigascience/giaf046
The genome of Hippophae salicifolia provides new insights into the sexual differentiation of sea buckthorn
Abstract
Background: Dioecy, a common reproductive strategy in angiosperms, has evolved independently in various plant lineages, and this has resulted in the evolution of diverse sex chromosome systems and sex determination mechanisms. Hippophae is a genus of dioecious plants with an XY sex determination system, but the molecular underpinnings of this process have not yet been clarified. Most previously published sea buckthorn genome data have been derived from females, yet genomic data on males are critically important for clarifying our understanding of sex determination in this genus. Comparative genomic analyses of male and female sea buckthorn plants can shed light on the origins and evolution of sex. These studies can also enhance our understanding of the molecular mechanisms underlying sexual differentiation and provide novel insights and data for future research on sexual reproduction in plants.
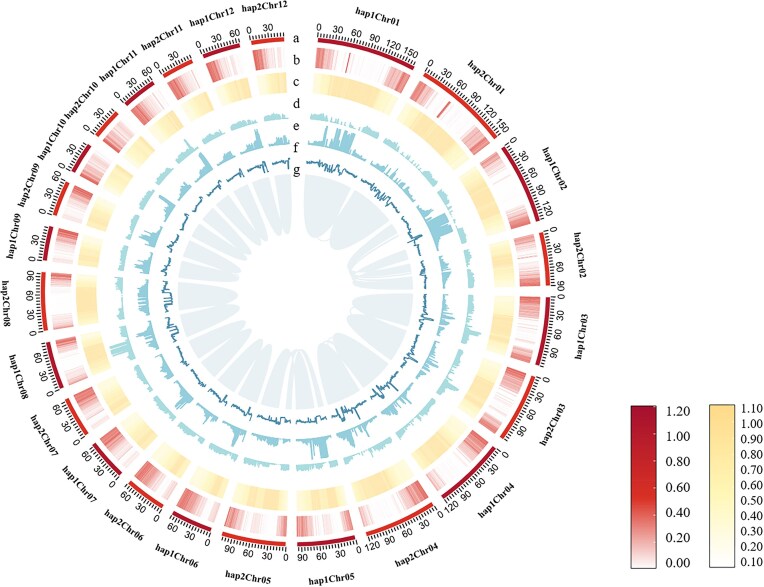
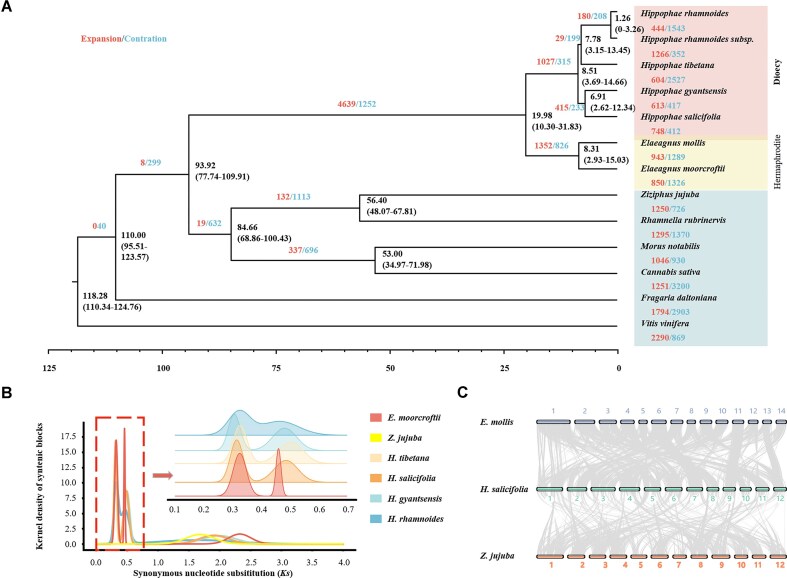
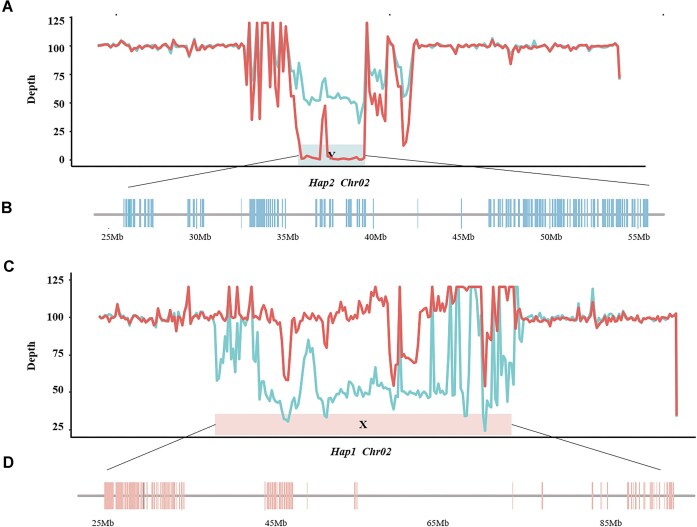
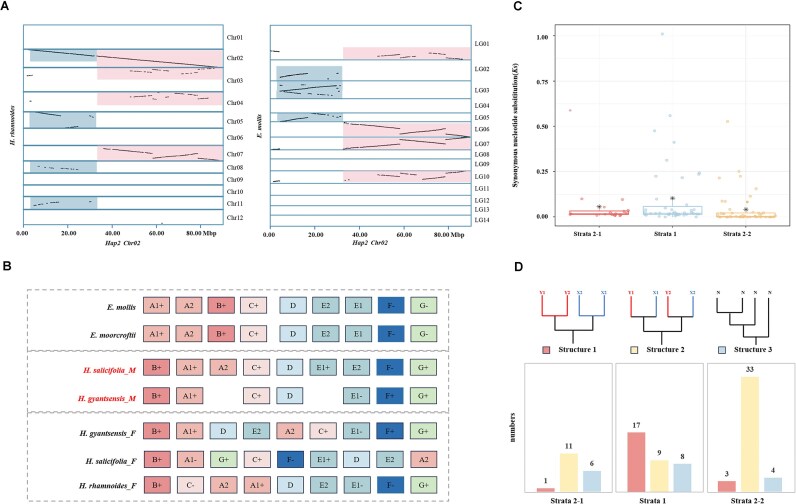
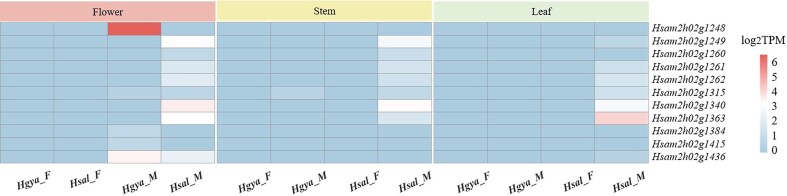
Results: We conducted an in-depth analysis of the genomes of 2 sea buckthorn species, including a male Hippophae gyantsensis, a female Hippophae salicifolia, and 2 haplotypes of male H. salicifolia. The genome size of H. gyantsensis was 704.35 Mb, and that of the female H. salicifolia was 788.28 Mb. The sizes of the 2 haplotype genomes were 1,139.99 Mb and 1,097.34 Mb. The sex-determining region (SDR) of H. salicifolia was 29.71 Mb and contained 249 genes. A comparative analysis of the haplotypes of Chr02 of H. salicifolia revealed that the Y chromosome was shorter than the X chromosome. Chromosomal evolution analysis indicated that Hippophae has experienced significant chromosomal rearrangements following 2 whole-genome duplication events, and the fusion of 2 chromosomes has potentially led to the early formation of sex chromosomes in sea buckthorn. Multiple structural variations between Y and X sex-linked regions might have facilitated the rapid evolution of sex chromosomes in H. salicifolia. Comparison of the transcriptome data of male and female flower buds from H. gyantsensis and H. salicifolia revealed 11 genes specifically expressed in males. Three of these were identified as candidate genes involved in the sex determination of sea buckthorn. These findings will aid future studies of the sex determination mechanisms in sea buckthorn.
Conclusion: A comparative genomic analysis was performed to identify the SDR in H. salicifolia. The origins and evolutionary trajectories of sex chromosomes within Hippophae were also determined. Three potential candidate genes associated with sea buckthorn sex determination were identified. Overall, our findings will aid future studies aimed at clarifying the mechanisms of sex determination.
Keywords: Hippophae; chromosomal assembly; sex chromosomes; sex determination.
© The Author(s) 2025. Published by Oxford University Press on behalf of GigaScience.
Conflict of interest statement
The authors declare that they have no competing interests.
Figures
Similar articles
-
Systemic pharmacological treatments for chronic plaque psoriasis: a network meta-analysis.Cochrane Database Syst Rev. 2021 Apr 19;4(4):CD011535. doi: 10.1002/14651858.CD011535.pub4. Cochrane Database Syst Rev. 2021. Update in: Cochrane Database Syst Rev. 2022 May 23;5:CD011535. doi: 10.1002/14651858.CD011535.pub5. PMID: 33871055 Free PMC article. Updated.
-
Systemic pharmacological treatments for chronic plaque psoriasis: a network meta-analysis.Cochrane Database Syst Rev. 2017 Dec 22;12(12):CD011535. doi: 10.1002/14651858.CD011535.pub2. Cochrane Database Syst Rev. 2017. Update in: Cochrane Database Syst Rev. 2020 Jan 9;1:CD011535. doi: 10.1002/14651858.CD011535.pub3. PMID: 29271481 Free PMC article. Updated.
-
Behavioral interventions to reduce risk for sexual transmission of HIV among men who have sex with men.Cochrane Database Syst Rev. 2008 Jul 16;(3):CD001230. doi: 10.1002/14651858.CD001230.pub2. Cochrane Database Syst Rev. 2008. PMID: 18646068
-
Assembly and Analysis of the Mitochondrial Genome of Hippophae rhamnoides subsp. sinensis, an Important Ecological and Economic Forest Tree Species in China.Plants (Basel). 2025 Jul 14;14(14):2170. doi: 10.3390/plants14142170. Plants (Basel). 2025. PMID: 40733405 Free PMC article.
-
Single-incision sling operations for urinary incontinence in women.Cochrane Database Syst Rev. 2017 Jul 26;7(7):CD008709. doi: 10.1002/14651858.CD008709.pub3. Cochrane Database Syst Rev. 2017. Update in: Cochrane Database Syst Rev. 2023 Oct 27;10:CD008709. doi: 10.1002/14651858.CD008709.pub4. PMID: 28746980 Free PMC article. Updated.
References
MeSH terms
Grants and funding
LinkOut - more resources
Full Text Sources
Miscellaneous
