. 2025 Jul 2:14:RP105017.
doi: 10.7554/eLife.105017.

Negative regulation of miRNA sorting into EVs is mediated by the capacity of RBP PCBP2 to impair the SYNCRIP-dependent miRNA loading

Affiliations

Negative regulation of miRNA sorting into EVs is mediated by the capacity of RBP PCBP2 to impair the SYNCRIP-dependent miRNA loading

Francesco Marocco et al. Elife. .

Abstract

While it is accepted that extracellular vesicles (EVs)-mediated transfer of microRNAs contributes to intercellular communication, the knowledge about molecular mechanisms controlling the selective and dynamic miRNA-loading in EVs is still limited to few specific RNA-binding proteins interacting with sequence determinants. Moreover, although mutagenesis analysis demonstrated the presence/function of specific intracellular retention motifs, the interacting protein/s remained unknown. Here, PCBP2 was identified as a direct interactor of an intracellular retention motif: CLIP coupled to RNA pull-down and proteomic analysis demonstrated that it binds to miRNAs embedding this motif and mutagenesis proved the binding specificity. Notably, PCBP2 binding requires SYNCRIP, a previously characterized miRNA EV-loader as indicated by SYNCRIP knock-down. SYNCRIP and PCBP2 may contemporarily bind to miRNAs as demonstrated by EMSA assays and PCBP2 knock-down causes EV loading of intracellular microRNAs. This evidence highlights that multiple proteins/miRNA interactions govern miRNA compartmentalization and identifies PCBP2 as a dominant inhibitor of SYNCRIP function in murine hepatocytes.

Keywords: RNA-binding proteins; cell biology; extracellular vesicles; miRNA; mouse.


Conflict of interest statement

FM, SG, CM, AC, LQ, GG, GS, CC, ML, AC, RP, GT, CB, MT No competing interests declared

Figures
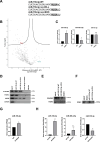
Figure 1.
Figure 1.. PCBP2 recognizes the CELL motifs and has a functional role in intracellular retention of miRNA-155-3p.
(A) Sequences of biotinylated oligos used as bait in pull-down experiment; Core CELL motifs (WT and mutated) are in gray, hEXO motifs (WT and mutated) are underlined. miRNA devoid of CELL motif (no-CELL), miRNA devoid of hEXO (no-hEXO). (B) Volcano plot comparing proteins bound to miRNA-155-3p no-CELL vs WT. Black curves represent the significant threshold at a false discovery rate (FDR) of 0.05 and S0 of 0.1. PCBP2 and SYNCRIP proteins are labeled in the plot. (C) CLIP of PCBP2 protein in murine hepatocytes. RT-qPCR analysis for miR-155-3p, miR-365-2-5p (CELL motif-devoid), and miR-31-3p (hEXO motif-devoid) is shown as IP/IgG. Data are the mean ± SEM of three independent experiments. (D) RNA pull-down with the WT and mutated (no-CELL, no-hEXO) (sequences are reported in A) miR-155-3p followed by western blot for the indicated proteins (HSP90 is used as positive and GAPDH as negative controls, respectively). Data are representative of three independent experiments. (E) RNA pull-down with the WT and mutated (+CELL) miR-365-2-5p followed by western blot for the indicated proteins. Data are representative of three independent experiments. (F) RNA pull-down by using the recombinant PCBP2 protein and with WT and mutated miR-155-3p (no-CELL) followed by western blot for PCBP2. Data are representative of three independent experiments. (G) CLIP of SYNCRIP protein in murine hepatocytes. RT-qPCR analysis for miR-155-3p is shown as IP/IgG. Data are the mean ± SEM of three independent experiments. (H) (Left and middle panels) EV miRNA-155-3p and miR-365-2-5p levels in shCTR and shPCBP2 cells analyzed by RT-qPCR. Data are expressed as ratio of miRNA expression in EVs with respect to the intracellular compartment (shCTR arbitrary value 1). Results are shown as the mean ± SEM of three independent experiments. (right panel) EV miRNA-155-3p levels in shCTR and shSYNCRIP cells analyzed by RT-qPCR. Data are expressed as ratio of miRNA expression in EVs with respect to the intracellular compartment (shCTR arbitrary value 1). Results are shown as the mean ± SEM of three independent experiments. Data are considered statistically significant with p<0.05 (Student’s t-test). *p<0.05; **p<0.01.
Figure 1—figure supplement 1.
Figure 1—figure supplement 1.. PCBP2 and SYNCRIP silencing.
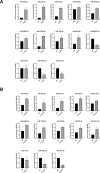
(A) Expression levels of PCBP2 in shCTR and shPCBP2 murine hepatocytes. Data are shown as the mean ± SEM of three independent experiments. (B) (Left panel) Western blot analysis for PCBP2 on protein extracts from hepatocytes silenced for PCBP2 (3A shPCBP2) and relative control (3A shCTR). GAPDH has been used as loading control. The figure is representative of three independent experiments. (Right panel) Densitometric analysis of western blot signals. Data are shown as the mean ± SEM of three independent experiments. (C) Expression levels of SYNCRIP in shCTR and shSYNCRIP murine hepatocytes. Data are shown as the mean ± SEM of three independent experiments. (D) (Left panel) Western blot analysis for SYNCRIP on protein extracts from hepatocytes silenced for SYNCRIP (3A shSYNCRIP) and relative control (3A shCTR). GAPDH has been used as loading control. The figure is representative of three independent experiments. (Right panel) Densitometric analysis of Western-blot signals. Data are shown as the mean ± SEM of three independent experiments.
Figure 1—figure supplement 2.
Figure 1—figure supplement 2.. shCTR, shPCBP2, and shSYNCRIP EV characterization.
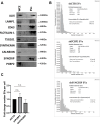
(A) Western blot analysis for EV-specific (Alix, LAMP1, CD63, Flotillin-1, TSG101, Synthenin), intracellular (calnexin) markers, and SYNCRIP and PCBP2 on protein extracts from hepatocytes (WCE, whole cell extract) and hepatocyte-derived EVs (EVs). (B) Particle diameter (nm) and concentration (particles/ml) of EVs evaluated by Exoid (IZON) (top: shCTR EVs, Middle: shPCBP2 EVs, bottom: shSYNCRIP EVs). (C) Quantification of number of EVs per cell in shCTR, shPCBP2 and shSYNCRIP conditions.
Figure 2.
Figure 2.. PCBP2 binding to miR-155-3p is SYNCRIP-dependent.
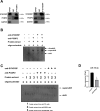
(A) Co-immunoprecipitation of PCBP2 and SYNCRIP. Immunoprecipitations with rabbit polyclonal anti-PCBP2, mouse monoclonal anti-SYNCRIP, and the relative preimmune IgG were performed on protein extracts from hepatocytes. GAPDH is used as negative control. Immunoblots representative of three independent experiments are shown. (B) Electrophoretic mobility shift assay (EMSA): interactions of miR-155-3p with the indicated protein extracts (shifts) and Abs (anti-SYNCRIP and anti-PCBP2) (supershift) are shown. Ultrashift shown in lane 5 demonstrates concurrent binding of SYNCRIP and PCBP2 to miR-155-3p. (C) EMSA: interactions of miR-155-3p with protein extracts from shCTR (1), shPCBP2 (2), and shSYNCRIP (3) cells (shifts) and Abs (anti-SYNCRIP and anti-PCBP2) (supershift) are shown. (D) CLIP of PCBP2 protein in murine hepatocytes both WT (shCTR) and silenced for SYNCRIP (shSYNCRIP). RT-qPCR analysis for the expression of miR-155-3p is shown as IP/IgG. Data are the mean ± SEM of three independent experiments.
Figure 3.
Figure 3.. PCBP2 binding to miR-155-3p is sequence dependent.
(A) RNA pull-down with the WT and mutated (sequences are reported above) miR-26b-3p followed by western blot for the indicated proteins. Data are representative of three independent experiments. (B) RNA pull-down with the WT and mutated (sequences are reported above) miR-31-3p followed by western blot for the indicated proteins. Data are representative of three independent experiments. (A, B) Core CELL motifs (WT and mutated) are in gray, hEXO motifs (WT and mutated) are underlined.
Figure 4.
Figure 4.. PCBP2 functionally dominates on SYNCRIP EV-loading activity on a repertoire of miRNAs embedding CELL and hEXO motifs.
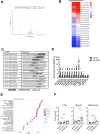
(A) Volcano plot comparing miRNAs differentially expressed from NGS data; miRNAs with Log2FC > 1 and Log2FC < -1 and p-value ≤ 0.10 were considered differentially expressed. Downregulated miRNAs in shPCBP2 respect to shCTRL are represented as blue dots, upregulated miRNAs are represented as red dots. (B) Heatmap showing the Log2 fold enrichment (EV/CELL) of mature miRNAs in small extracellular vesicles derived from shCTRL cells versus shPCBP2 cells. miRNAs with Log2FE ≥ 1.0 and p-value ≤ 0.10 were considered to be differentially enriched. (C) List of selected miRNAs embedding CELL and/or hEXO motifs; consensus sequences are highlighted in gray or underlined respectively. (D) EV miRNA levels in shCTR and shPCBP2 cells analyzed by RT-qPCR. Data are expressed as ratio of miRNA expression in EVs with respect to the intracellular compartment (shCTR arbitrary value 1). Results are shown as the mean ± SEM of three independent experiments. Data are considered statistically significant with p<0.05 (Student’s t-test). *p<0.05; **p<0.01. (E) Gene Ontology enrichment analysis on validated and predicted targets. The X-axis represents the gene ratio, whereas the Y-axis represents the enriched GO terms. Colors indicate the statistical significance after multiple test correction, while circle size represents the number of genes associated with each term. (F) Liver-isolated leukocytes cultured either alone (NO EVs) or in the presence of control EVs (shCTR EVs) or shPCBP2 EVs (shPCBP2 EVs) for 24 h. The expression of IFN-γ was analyzed on CD3+, NK1.1+ CD11b+, and CD11b+ cells by flow cytometry. The dot plots show the percentage of cytokine-positive T cells, NK cells, and myeloid cells. T cells and NK cells graphs are representative of five independent experiments, while myeloid cells graph is representative of four independent experiments. Each symbol represents data obtained from an individual mouse. Data are considered statistically significant with p<0.05 (Student’s t-test). *p<0.05; **p<0.01.
Figure 4—figure supplement 1.
Figure 4—figure supplement 1.. miRNAs EV export upon SYNCRIP silencing.
EV miRNA levels in shCTR and shSYNCRIP cells analyzed by RT-qPCR. Data are expressed as ratio of miRNA expression in EVs with respect to the intracellular compartment (shCTR arbitrary value 1). Results are shown as the mean ± SEM of three independent experiments. Data are considered statistically significant with p<0.05 (Student’s t-test). *p<0.05; **p<0.01; ****p<0.0001.
Figure 4—figure supplement 2.
Figure 4—figure supplement 2.. Gene Ontology analysis on miRNA targets.
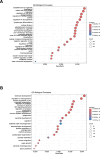
(A) Gene Ontology enrichment analysis on validated targets. The X-axis represents the gene ratio, whereas the Y-axis represents the enriched GO terms. Colors indicate the statistical significance after multiple test correction, while circle size represents the number of genes associated with each term. (B) Gene Ontology enrichment analysis on predicted targets. The X-axis represents the gene ratio, whereas the Y-axis represents the enriched GO terms. Colors indicate the statistical significance after multiple test correction, while circle size represents the number of genes associated with each term.
Figure 4—figure supplement 3.
Figure 4—figure supplement 3.. Flow cytometric analysis on EVs recipient cells.
Leukocytes selected according to SSC-A and FSC-A morphological parameters. Live cells were identified excluding APC-H7+ cells. CD45.2+ cells were gated and then segregated into NK1.1+ CD11b+, NK1.1- CD11b+, NK1.1- CD11b- CD3+ cells to discriminate NK cells, myeloid cells, and T cells, respectively. These gated cells were then analyzed for the expression of IFN-γ.
Figure 5.
Figure 5.. PCBP2 and SYNCRIP bind to several miRNAs embedding CELL and hEXO motif sequences.
(A) CLIP of PCBP2 protein in murine hepatocytes. RT-qPCR analysis for the indicated miRNAs is shown as IP/IgG for each independent experiment (IgG arbitrary value 1). Data are the mean ± SEM of three independent experiments. Data are considered statistically significant with p<0.05 (Student’s t-test). *p<0.05; **p<0.01. (B) CLIP of SYNCRIP protein in murine hepatocytes. RT-qPCR analysis for the indicated miRNAs is shown as IP/IgG for each independent experiment (IgG arbitrary value 1). Data are the mean ± SEM of three independent experiments. Data are considered statistically significant with p<0.05 (Student’s t-test). *p<0.05; **p<0.01; ***p<0.001.
Figure 6.
Figure 6.. PCBP2 binding to miRNAs requires SYNCRIP.
CLIP of PCBP2 protein in murine hepatocytes both WT (shCTR) and silenced for SYNCRIP (shSYNCRIP). RT-qPCR analysis for the indicated miRNAs is shown as IP/IgG. Data are the mean ± SEM of three independent experiments. Data are considered statistically significant with p<0.05 (Student’s t-test). *p<0.05; ***p<0.001.
Figure 7.
Figure 7.. Schematic model of PCBP2/SYNCRIP-dependent miRNAs compartmentalization.
hEXO-SYNCRIP interaction promotes miRNAs secretion into EVs. SYNCRIP-dependent PCBP2-CELL motif interaction promotes miRNAs intracellular retentio.
Author response image 1.
Author response image 2.

Update of

  • doi: 10.1101/2024.11.15.623754
  • doi: 10.7554/eLife.105017.1
  • doi: 10.7554/eLife.105017.2
  • doi: 10.7554/eLife.105017.3

Similar articles

References

    1. BaseSpace Labs . Illumina; 2023. https://www.illumina.com/products/by-type/informatics-products/basespace...
    1. Battistelli C, Garbo S, Riccioni V, Montaldo C, Santangelo L, Vandelli A, Strippoli R, Tartaglia GG, Tripodi M, Cicchini C. Design and functional validation of a mutant variant of the LncRNA HOTAIR to counteract snail function in epithelial-to-mesenchymal transition. Cancer Research. 2021;81:103–113. doi: 10.1158/0008-5472.CAN-20-1764. - DOI - PMC - PubMed
    1. Broermann A, Schmid R, Gabrielyan O, Sakowski M, Eisele C, Keller S, Wolff M, Baum P, Stierstorfer B, Huber J, Krämer BK, Hocher B, Streicher R, Delić D. Exosomal miRNAs as potential biomarkers to monitor phosphodiesterase 5 inhibitor induced anti-fibrotic effects on CCl4 treated rats. International Journal of Molecular Sciences. 2020;22:382. doi: 10.3390/ijms22010382. - DOI - PMC - PubMed
    1. Chaudhury A, Chander P, Howe PH. Heterogeneous nuclear ribonucleoproteins (hnRNPs) in cellular processes: Focus on hnRNP E1’s multifunctional regulatory roles. RNA. 2010;16:1449–1462. doi: 10.1261/rna.2254110. - DOI - PMC - PubMed
    1. Conigliaro A, Amicone L, Costa V, De Santis Puzzonia M, Mancone C, Sacchetti B, Cicchini C, Garibaldi F, Brenner DA, Kisseleva T, Bianco P, Tripodi M. Evidence for a common progenitor of epithelial and mesenchymal components of the liver. Cell Death and Differentiation. 2013;20:1116–1123. doi: 10.1038/cdd.2013.49. - DOI - PMC - PubMed

Associated data

LinkOut - more resources