. 2025 Jul 4;11(27):eadr4620.
doi: 10.1126/sciadv.adr4620. Epub 2025 Jul 2.

Orbitofrontal cortex influences dopamine dynamics associated with alloparental behavioral acquisition in female mice

Affiliations

Orbitofrontal cortex influences dopamine dynamics associated with alloparental behavioral acquisition in female mice

Gen-Ichi Tasaka et al. Sci Adv. .

Abstract

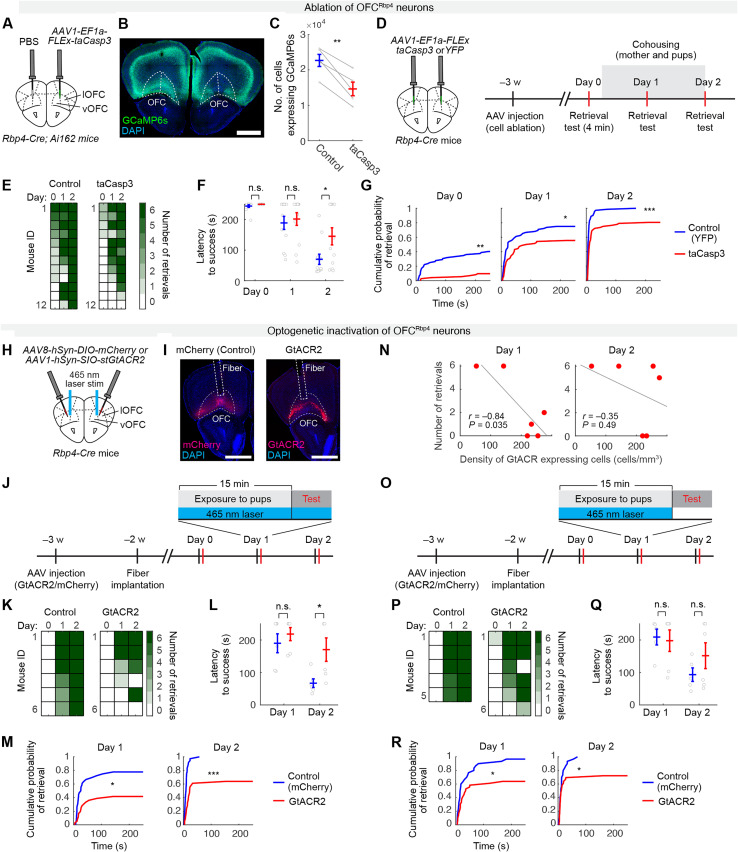
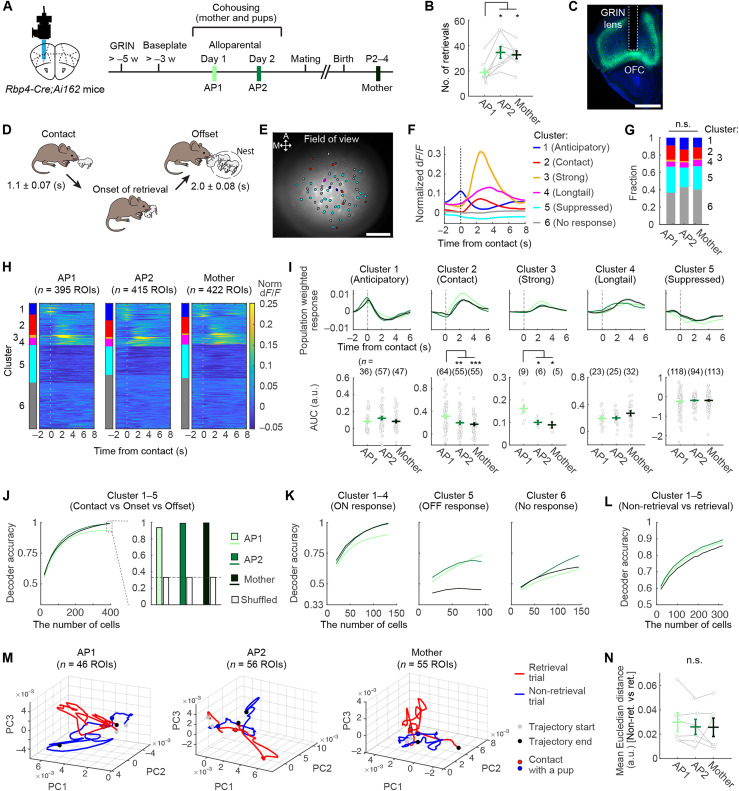
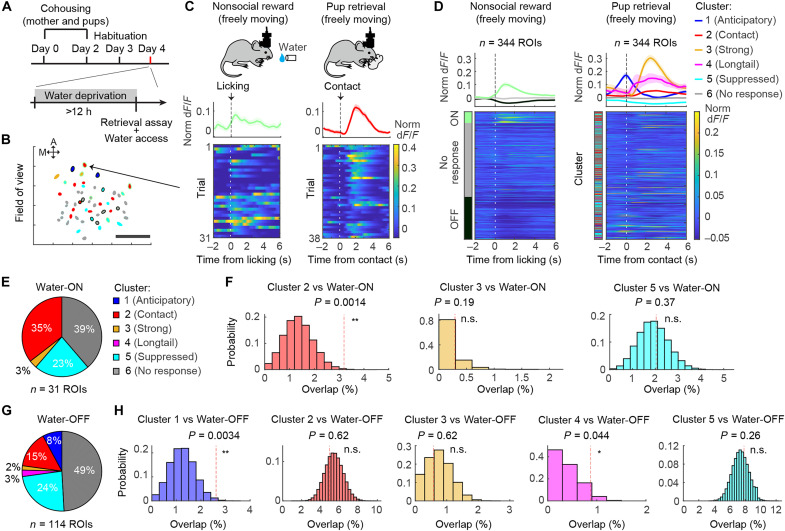
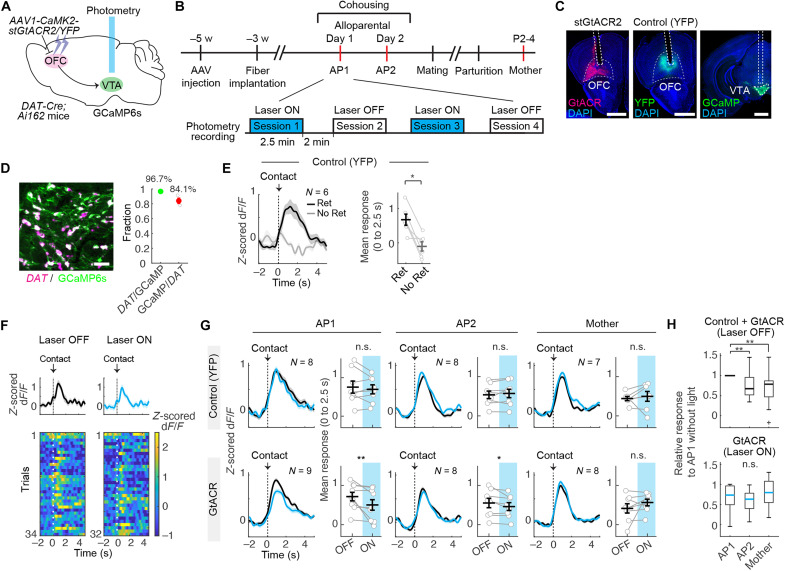
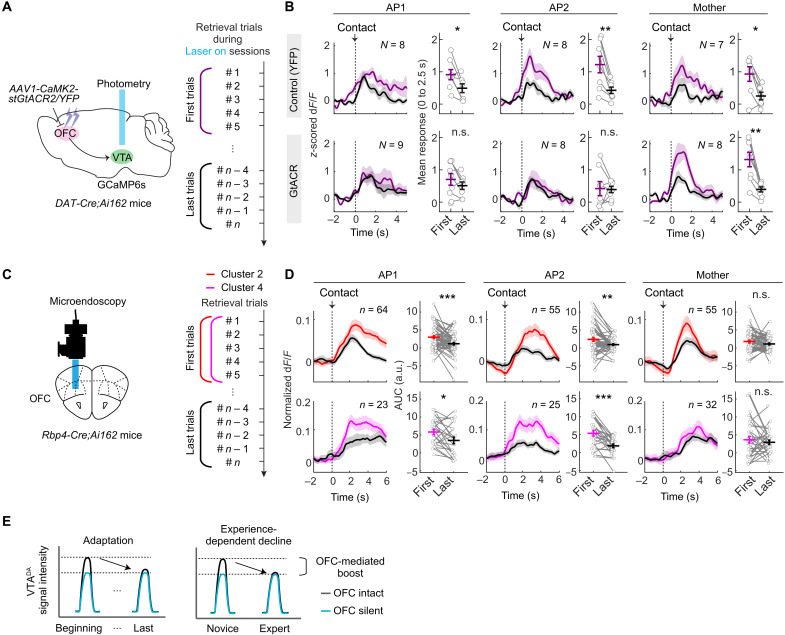
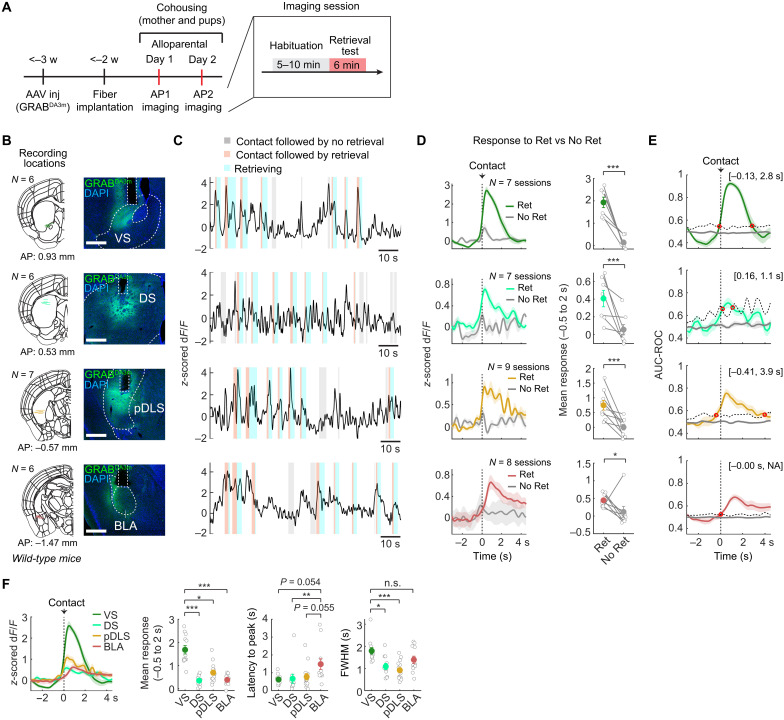
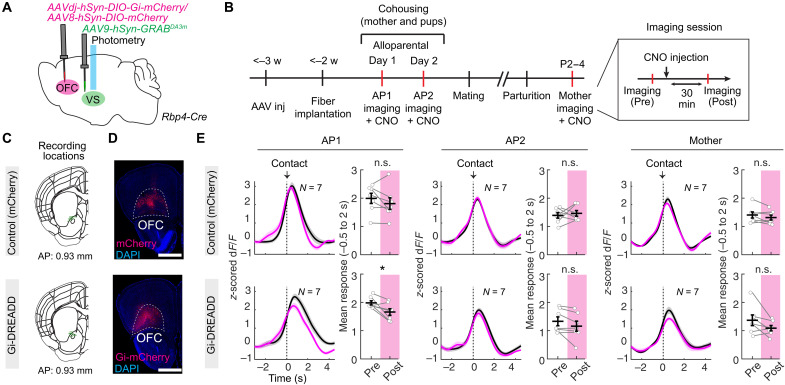
Maternal behaviors, which are crucial for the survival of mammalian infants, require the coordinated operation of multiple brain regions to process infant cues, make decisions, and execute motor plans. Although these processes likely demand higher cognitive functions, the prefrontal areas that regulate limbic parental programs remains poorly understood. Here, we show that the orbitofrontal cortex (OFC) excitatory projection neurons promote alloparental caregiving behaviors in female mice. By chronic microendoscopy, we observed robust yet adaptable representations of pup-directed anticipatory and motor-related activities within the OFC. Some of these plastic responses were significantly overlapped with those related to nonsocial reward signals. The inactivation of OFC output reduced the phasic activities of midbrain dopamine (DA) neurons specifically tied to pup retrieval and impaired the modulation of DA release to the ventral striatum during the acquisition of alloparental behaviors. These findings suggest that the OFC transiently boosts DA activity during the acquisition phase, thereby facilitating the manifestation of alloparental behaviors.


Figures

Fig. 1.
Fig. 1.. Necessity of OFCRbp4 neurons for effective acquisition of pup retrieval.
(A) Schematic of the experimental design. AAV1 EF1a-FLEx-taCasp3-TEVp was unilaterally injected into the ventral OFC (vOFC) and lateral OFC (lOFC) of Rbp4-Cre; Ai162 mice. (B) Representative coronal section showing selective ablation in the taCasp3-injected hemisphere. GCaMP6 signals were amplified by anti-GFP staining. Scale bar, 1 mm. (C) Quantification of GCaMP6+ cells in the OFC. **P < 0.01 by paired t test (N = 5 mice). (D) Schematic of the experimental design. AAV1 EF1a-FLEx-taCasp3-TEVp or AAV1 EF1a-DIO-YFP was injected bilaterally in virgin Rbp4-Cre mice >3 weeks before testing. w, weeks. (E) Individual pup retrieval performance. (F) Latency to retrieve all six pups in a 4-min trial. *P < 0.05 by post hoc unpaired t test with Benjamini-Hochberg correction after a significant two-way analysis of variance (ANOVA) with repeated measures. n.s., not significant (N = 12 per group). (G) Cumulative retrieval probability. **P < 0.01 by the Kolmogorov-Smirnov test. (H) Schematic of the experimental design. AAV1 hSyn-DIO-stGtACR2-fusionRed or AAV8 hSyn-DIO-mCherry was bilaterally injected in virgin Rbp4-Cre mice. (I) Representative sections showing the optic fiber tract and mCherry/stGtACR2 expression. Scale bars, 1 mm. (J and O) Schematics of the experimental design. Fifteen-minute pup exposure followed by testing with laser during both sessions (J) or cohousing only (O). (K and P) Individual retrieval performance. (L and Q) Retrieval latency. *P < 0.05 by post hoc unpaired t test with Benjamini-Hochberg correction after a significant two-way ANOVA with repeated measures. n.s., not significant. N = 6 per group in (L); N = 5 (Control); and N = 6 (GtACR2) in (Q). (M and R) Cumulative retrieval probability. *P < 0.05, and ***P < 0.001 by the Kolmogorov-Smirnov test. (N) Correlation between OFC GtACR2 expression and retrieval performance. Error bars indicate the SEM. See fig. S1 for more data.
Fig. 2.
Fig. 2.. Representation of pup retrieval in OFCRbp4 neurons across behavioral acquisition.
(A) Experimental paradigm schematic. AP, alloparental day; P2–4, postpartum days 2 to 4. (B) Total retrievals during two 6-min imaging sessions. *P < 0.05 by a Tukey’s post hoc test following a significant one-way ANOVA. N = 8 mice. (C) Representative image showing the GRIN lens tract and GCaMP6 expression. Scale bar, 1 mm. (D) Schematic of sequential retrieval behaviors, indicating the average duration (± SEM) in females after 2 days of cohousing. (E) Spatial map of retrieval-responsive ROIs in a female mouse on AP2. ROIs are outlined in black, with colors indicating clusters. A, anterior; M, medial. Scale bar, 100 μm. (F) Trial-averaged normalized (norm) dF/F traces of ROIs by cluster. dF/F values were normalized to each ROI’s individual maximum. (G) Fraction of cells in each cluster. (H) Heatmaps showing normalized trial-averaged responses during retrieval, sorted by cluster. Time 0 denotes pup contact followed by retrieval. n.s., not significant by chi-square test with Bonferroni correction. (I) (Top) Population-weighted activity for each cluster. (Bottom) AUC. *P < 0.05, **P < 0.01, and ***P < 0.001 by a Tukey’s post hoc test after a significant one-way ANOVA. The number of ROIs is shown in the panel. a.u., arbitrary units. (J) SVM decoding accuracy for classifying contact, onset, and offset of retrieval. (Left) Accuracy versus cells used. (Right) Accuracy using 395 cells. Dotted line indicates chance. (K) Same as (J, left), using ROIs from specific clusters. (L) SVM decoding of retrieval versus nonretrieval trials. (M) PCA trajectories from a representative mouse during 8-s retrieval and nonretrieval epochs. (N) Mean cumulative Euclidean distance between PCA trajectories. n.s., not significant by one-way ANOVA. N = 6 mice. Error bars, SEM. See figs. S2 to S5 for more data.
Fig. 3.
Fig. 3.. Substantial overlap between OFCRbp4 neurons responsive to pup retrieval and sucrose water.
(A) Schematic of the experimental paradigm. (B) Example of a spatial map of ROIs that responded during pup retrieval and passive exposure of 10% sucrose water as a nonsocial reward. A, anterior; M, medial. Scale bar, 100 μm. (C) Trial-averaged activities (top) and corresponding activity heatmaps of individual trials (bottom) for a ROI responding to both retrieval and the water reward. (D) (Top) Trial-averaged activity traces of ROIs belonging to each of the three clusters during water licking (left) and each of the six clusters during pup retrieval (right). (Bottom) Heatmaps showing normalized, averaged responses of individual ROIs during licking water (left) and pup retrieval (right). ROIs are sorted by their responsiveness to water licking. Time 0 indicates the moment of the lick or pup contact followed by retrieval (n = 344 ROIs from N = 6 mice). (E and G) Fraction of cells in each cluster. (F and H) Observed overlaps compared with the null distribution assuming independence between nonsocial reward- and retrieval-responsive ROIs (*P < 0.05 and **P < 0.01 by extreme upper-tail probability from a binomial distribution).
Fig. 4.
Fig. 4.. The OFC facilitates pup retrieval-related activities of VTADA neurons.
(A) Schematic of the experimental design. AAV1 CaMKII-stGtACR2-fusionRed or AAV1 CaMKII-YFP was injected into the bilateral OFC of virgin DAT-Cre; Ai162 mice. (B) Experimental timeline: four imaging sessions (2.5 min each); first/third with laser (blue), second/fourth as internal controls without laser. (C) Representative coronal sections showing the optic fiber tract and expression of stGtACR2, YFP, and GCaMP6s in DAT-Cre; Ai162 mice. Scale bars, 1 mm. (D) (Left) Representative coronal section showing DAT mRNA (magenta) and GCaMP6s (anti-GFP, green) in DAT-Cre; Ai162 mice. (Right) Quantification of specificity (DAT/GCaMP6s) and efficiency (GCaMP6s/DAT) (N = 3 mice). Scale bar, 50 μm. (E) (Left) Trial-averaged z-scored peri-event time histograms (PETHs) of control animals during contact followed by retrieval (Ret, black line) and nonretrieval (No Ret, gray line). Shadow represents the SEM. (Right) The mean of z-scored PETHs between 0 and 2.5 s, aligned to pup contact. *P < 0.05 by the Wilcoxon signed-rank test. (F) Trial-averaged activities (top) and heatmaps (bottom) of VTADA neurons during pup retrieval with and without OFC inactivation in an AP2 mouse. Time 0 indicates pup contact followed by retrieval. (G) z-scored PETHs with (blue) and without (black) laser and mean z-scored PETHs (0 to 2.5 s). (Top) YFP-injected group. (Bottom) GtACR2-injected group. The number of animals (N) is indicated in the panel. *P < 0.05 and **P < 0.01 by the Wilcoxon signed-rank test. n.s., not significant. (H) Normalized mean response for pup retrieval across the AP1, AP2, and Mother stages. Laser-off data pooled from GtACR (N = 9 mice) and YFP (N = 8 mice) groups as control. n.s., not significant and **P < 0.05 by a Tukey’s post hoc test following a significant Kruskal-Wallis test. See fig. S6 for more data.
Fig. 5.
Fig. 5.. The OFC regulates the dynamic modulation of VTADA neuron activity.
(A and C) Schematics of the experimental design and analyzed trials. (B) z-scored PETHs for the first (black) and last (purple) five trials during laser-on sessions for the control (top) and GtACR2 (bottom) groups. The right graph represents the mean of z-scored PETHs from 0 to 2.5 s, aligned to pup contact. *P < 0.05 and **P < 0.01 by the Wilcoxon signed-rank test. The number of animals (N) is indicated in the panel. (D) Averaged activity traces of ROIs from Cluster 2 (top) and Cluster 4 (bottom) for the first (black) and last (purple) five pup retrieval trials. The right graph shows the AUC of normalized dF/F (0 to 4 s for Cluster 2; 0 to 6 s for Cluster 4) aligned to pup contact. *P < 0.05 and ***P < 0.001 by paired t test. The number of ROIs is indicated in the panel. (E) Schematic describing the two models of VTADA neuron dynamics and the contribution of the OFC. Shadow represents the SEM. Time 0 indicates pup contact followed by retrieval. See fig. S7 for more data.
Fig. 6.
Fig. 6.. DA is released in the multiple downstream targets during pup retrieval.
(A) Schematic of the experimental timeline. (B) (Left) Schematics of coronal sections showing the position of the optic fiber (N = 6 to 7 mice each). AAV9 hSyn-GRABDA3m was injected into the left VS, DS, pDLS, or BLA of the virgin wild-type mice. (Right) Representative coronal sections showing the expression of GRABDA3m without antibody staining. Scale bars, 500 μm. (C) Representative photometry trace recorded from an AP2 female during pup retrieval. Colors correspond to specific behavioral events as indicated above the panel. (D) (Left) Trial-averaged z-scored PETH traces fitted to pup contact followed by retrieval (colored) or nonretrieval (gray). (Right) The mean of z-scored PETHs between −0.5 and 2 s, aligned to pup contact. The number of sessions is indicated in the panel (data pooled from AP1 and AP2). *P < 0.05 and ***P < 0.001 by the Mann-Whitney U test. (E) Averaged traces of the AUC-ROC calculated for each animal. Dashed black lines display the mean + 2SD of the AUC-ROC from trial-shuffled data (gray trace). Red dots indicate time points exceeding or falling below 2SD of shuffled data for the first time. NA, not applicable. (F) (Left) Averaged PETH traces from different targeted brain regions. Data from both AP1 and AP2 are combined (N = 6 to 7 mice). (Right) Quantification of averaged response, latency to the peak, and the FWHM of PETH traces. *P < 0.05, **P < 0.01, and ***P < 0.001 by a Tukey’s post hoc test following a significant Kruskal-Wallis test.
Fig. 7.
Fig. 7.. The OFC regulates DA release in the VS during pup retrieval.
(A) Schematic of the experimental design. AAVdj hSyn-DIO-Gi-mCherry or AAV8 hSyn-DIO-mCherry as a control was injected into the bilateral OFC of the virgin Rbp4-Cre mice. AAV9 hSyn-GRABDA3m was injected into the left VS. (B) Schematic of the experimental time line, including an imaging session (duration: 6 min). (C) Schematics of coronal sections showing the position of the optic fiber (N = 7 mice for each group). (D) Representative coronal sections showing the expression of mCherry (top) and Gi-mCherry (bottom). Scale bars, 1 mm. (E) z-scored PETHs before (black line) and after (magenta line) CNO administration (left), with corresponding mean responses of z-scored PETHs (right). (Top) mCherry-injected control group. (Bottom) hM4Di-injected group. The number of animals is indicated in the panel. Time 0 indicates pup contact. *P < 0.05, by the Wilcoxon signed-rank test. n.s., not significant. See fig. S8 for more data and fig. S9 for schematic summary of all the data.

Similar articles

References

    1. Dulac C., O’Connell L. A., Wu Z., Neural control of maternal and paternal behaviors. Science 345, 765–770 (2014). - PMC - PubMed
    1. Numan M., Young L. J., Neural mechanisms of mother-infant bonding and pair bonding: Similarities, differences, and broader implications. Horm. Behav. 77, 98–112 (2016). - PMC - PubMed
    1. Cohen L., Rothschild G., Mizrahi A., Multisensory integration of natural odors and sounds in the auditory cortex. Neuron 72, 357–369 (2011). - PubMed
    1. Tasaka G. I., Feigin L., Maor I., Groysman M., DeNardo L. A., Schiavo J. K., Froemke R. C., Luo L., Mizrahi A., The temporal association cortex plays a key role in auditory-driven maternal plasticity. Neuron 107, 566–579.e7 (2020). - PMC - PubMed
    1. Vinograd A., Fuchs-Shlomai Y., Stern M., Mukherjee D., Gao Y., Citri A., Davison I., Mizrahi A., Functional plasticity of odor representations during motherhood. Cell Rep. 21, 351–365 (2017). - PMC - PubMed

LinkOut - more resources