. 2025 Jul 4;11(27):eadp0467.
doi: 10.1126/sciadv.adp0467. Epub 2025 Jul 2.

Single-cell analysis of the decidua unveils the mechanism of anti-inflammatory exosomes for chorioamnionitis in nonhuman primates

Affiliations

Single-cell analysis of the decidua unveils the mechanism of anti-inflammatory exosomes for chorioamnionitis in nonhuman primates

Seung Hyun Jang et al. Sci Adv. .

Abstract

The effectiveness of exosomes engineered to carry a dominantly active variant of inhibitor α of nuclear factor κB (NF-κB) (IκBα), super-repressor IκB (srIκB), that inhibits the expression of NF-κB in various animal models of inflammatory diseases has been demonstrated. In this study, we used a lipopolysaccharide (LPS)-induced chorioamnionitis model in pregnant nonhuman primates to explore the therapeutic potential and mode of action of srIκB-loaded exosomes (Exo-srIκBs). Intraamniotic injection of LPS induced infiltration of BCL2A1-positive neutrophils and CD68-positive macrophages in the extraplacental membranes, causing fetal lung injury. Conversely, administration of Exo-srIκB via intraamniotic and intravenous routes (6.9 × 10¹⁰ and 4 × 10¹¹ particle numbers, respectively) ameliorated these effects. Single-cell RNA sequencing of the decidua and bulk RNA sequencing of the choriodecidua highlighted that Exo-srIκB treatment mitigated LPS-induced inflammatory pathways, particularly in macrophages, leading to a cascade effect on neutrophils through NF-κB signaling inhibition. These findings underscore the potential of Exo-srIκB as a therapeutic strategy for chorioamnionitis.


Figures

Fig. 1.
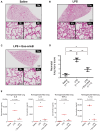
Fig. 1.. Study design and histopathological assessment of cynomolgus macaque choriodecidua postintervention.
(A) Overview of experimental design. Cynomolgus macaques received intraamniotic (ia) LPS injections at 0 hours (h) to induce chorioamnionitis, followed by intravenous (iv) and intraamniotic administration of Exo-srIκB at 0 and 1 hour post–LPS injection, respectively. Decidua tissue and choriodecidua of EPMs were collected for downstream analyses. UMAP, uniform manifold approximation and projection. (B) Representative images of EPM from three treatment groups: saline, inflammation-free EPM; LPS, inflammation restricted to membranous trophoblast, grade 4; LPS + Exo-srIκB, inflammation restricted to membranous trophoblast, grade 2. Scale bars, 100 μm. (C) Representative immunohistochemical images of BCL2A1 staining in EPM from the three treatment groups. Scale bars, 50 μm. (D) Digital image analysis using QuPath to determine the percentage of BCL2A1-positive cells in EPM from the three treatment groups. Data are presented as median with individual values (n = 3 biological replicates per group). Kruskal-Wallis test was performed to determine statistical significance among the three groups, with the calculated P value indicated in the plots.
Fig. 2.
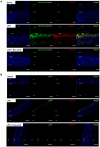
Fig. 2.. Immunofluorescent staining of BCL2A1 with neutrophils and macrophages in the EPMs.
(A) Representative images of the EPM from the three treatment groups stained with 4′,6-diamidino-2-phenylindole (DAPI; blue), neutrophil elastase as a marker for neutrophils (green), and BCL2A1 (red). Scale bars, 50 μm (saline and LPS groups) and 100 μm (LPS + Exo-srIκB group). (B) Representative images of the EPM from the three treatment groups stained with DAPI (blue), CD68 as a marker for macrophages (green), and BCL2A1 (red). Scale bars, 50 μm (saline and LPS + Exo-srIκB groups) and 100 μm (LPS group). AM, amnion; CH MT, chorion membranous trophoblast; DP, decidua parietalis.
Fig. 3.
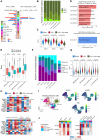
Fig. 3.. scRNA-seq of cynomolgus macaque decidua.
(A) Uniform manifold approximation and projection of scRNA-seq data, consisting of 57,848 cells (saline, 22,102 cells; LPS, 16,514 cells; LPS + Exo-srIκB, 19,232 cells). Neu, neutrophils; mac, macrophages; dNK, decidua NK cells; p, proliferative. (B) Dot plot illustrating marker genes for the identified cell subtypes. Dot size and color represent the percentage of cells expressing specific marker genes within each cell type and z-score of normalized expression values, respectively. The number of identified cells for each subtype is presented beneath the dot plot. (C) Bar plot showing the proportion of cell types in each individual animal.
Fig. 4.
Fig. 4.. Changes in the composition and molecular signatures of immune cells among the three groups.
(A) Number of significantly DEGs [Benjamini-Hochberg (BH)–adjusted P < 0.05] in each cell type: LPS versus saline-injected groups (left) and LPS + Exo-srIκB versus LPS-injected groups (right). (B) Proportion of neutrophil subtypes in each individual animal. (C) Violin plots depicting neutrophil activation scores among the three groups. One-way analysis of variance (ANOVA) with Bonferroni correction for multiple comparisons was performed. n.s., not significant. ***P ≤ 0.001. (D) Top 5 (or fewer) gene ontology (GO) biological process (BP) terms with Benjamini-Hochberg–adjusted P < 0.05 enriched among significant DEGs in neutrophils between the two compared groups. (E) Box plots presenting M1 and M2 signature scores in each macrophage subtype. Paired t tests were performed between the two signature scores. ***P ≤ 0.001. (F) The proportion of macrophage subtypes in each individual animal. (G) Violin plots showing macrophage classical activation scores among the three groups. One-way ANOVA with Bonferroni correction for multiple comparisons was performed. ***P ≤ 0.001. (H) Heatmap presenting the z-scored, normalized expression levels of representative target genes from canonical NF-κB signaling in neutrophils and macrophages among the three groups. (I) Regulon activities of the identified NF-κB family TFs (NFKB1, NFKB2, and REL) projected onto the UMAP plot. Only decidua immune cells are shown. (J) Heatmap displaying the log2 fold changes (FCs) of average regulon activities in neutrophils and macrophages, comparing the LPS-injected with the saline-injected (light coral) group and the LPS + Exo-srIκB–injected with the LPS-injected (sky blue) group.
Fig. 5.
Fig. 5.. Cell-cell interactions between immune cells within the three different groups.
(A and B) Signaling pathways exhibiting greater differences in the overall information flow within the inferred networks, among immune cells between LPS- and saline-injected groups (A) and between LPS + Exo-srIκB– and LPS-injected groups (B). Cumulative communication probabilities within a network were summed to determine the overall information flow of a particular signaling pathway. Pathways highlighted in red showed higher level of enrichment in saline-injected (A) or LPS-injected (B) groups; pathways highlighted in green exhibited higher level of enrichment in LPS-injected (A) or LPS + Exo-srIκB–injected (B) groups. (C and D) Heatmap displaying differences in interaction strength among different types of immune cells between the LPS- and saline-injected groups (C) and between the LPS + Exo-srIκB– and LPS-injected groups (D). Red indicates higher interaction strengths, whereas blue indicates reduced interaction strengths between particular cell types in LPS-injected (C) or LPS + Exo-srIκB–injected (D) groups. Bar plots (top) represent the sum of column values, indicating incoming signaling; bar plots (right) represent the sum of row values, indicating outgoing signaling. (E) Circle plots showing cell-cell interactions in specific signaling pathways. Edge colors indicate sources of signaling; edge widths are proportional to the interaction strength between two cell types.
Fig. 6.
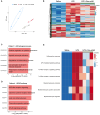
Fig. 6.. Bulk RNA-seq of cynomolgus macaques choriodecidua of EPMs.
(A) PCA plot of bulk RNA-seq data. (B) Heatmap depicting the results of hierarchical clustering of significant DEGs among the three treatment groups. Genes with Benjamini-Hochberg–adjusted P < 0.05 were defined as significant DEGs. Clustering revealed four distinct expression patterns. Colors in the heatmap represent the z-scored, normalized expression values. (C and D) Top 5 GO biological process (C) and KEGG pathway (D) terms with Benjamini-Hochberg–adjusted P < 0.05, ordered by −log10 (adjusted P value), enriched in DEGs belonging to pattern 1. NOD, nucleotide-binding oligomerization domain. (E) Heatmap representing the results of GSVA. Columns indicate samples; rows indicate each tested gene set. Colors represent the z-scored, normalized enrichment scores.
Fig. 7.
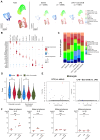
Fig. 7.. scRNA-seq of maternal cynomolgus macaque PBMCs.
(A) UMAP plots of maternal PBMC scRNA-seq data, composed of 7625 cells (saline, 2369 cells; LPS, 3669 cells; LPS + Exo-srIκB, 1587 cells). DCs, dendritic cells. (B) Dot plot showing the expression of marker genes used for the identification of each cell type. Dot color and size represent z-scored, normalized expression values and percentage of cells expressing a specific gene, respectively. (C) Bar plots showing the proportion of cell types in each individual animal. (D) Violin plots depicting the monocyte classical activation signature score among the three treatment groups within classical and nonclassical monocytes. P values were calculated using one-way ANOVA with Bonferroni correction for multiple comparisons. (E) Volcano plots showing the results of differential expression analysis in monocytes between two indicated groups. Genes are plotted using the log2(fold change) (x axis) and −log10[adjusted P value (Padj)] (y axis). Significantly up-regulated genes are colored in red, down-regulated genes are in blue, and insignificant genes are in black. Genes with Benjamini-Hochberg–adjusted P < 0.05 were considered significantly differentially expressed. (F) Cytokine levels in the maternal plasma across the three treatment groups were assessed using a multiplex ELISA. IL-6 levels were increased in the LPS group compared with those in the saline group; however, the difference was not statistically significant. The levels of other cytokines were similar among the three groups. Data are presented as median with individual values (n = 3 biological replicates per group). Kruskal-Wallis test was performed to determine statistical significance.
Fig. 8.
Fig. 8.. Mitigation of LPS-induced fetal lung inflammation following Exo-srIκB administration.
(A to C) Histological examination of fetal lung injury across the three treatment groups. [i.e., saline (A), LPS (B), and LPS + Exo-srIκB (C)]. (D) Neonatal lung injury score calculated on the basis of ATS criteria (0 to 10 range). Data are presented as means ± SDs (n = 3 biological replicates per group). A one-way ANOVA with Tukey’s correction for multiple comparisons was performed to determine statistical significance. *P ≤ 0.05, **P ≤ 0.01, and ***P ≤ 0.001. (E) Cytokine levels in homogenized frozen fetal lung tissues assessed by multiplex ELISA. Data are presented as median with individual values (n = 3 biological replicates per group). Kruskal-Wallis test was performed to determine statistical significance among the three groups, with the calculated P value indicated in the plots.

References

    1. J. R. Fowler, L. V. Simon, “Chorioamnionitis,” in StatPearls, NBK532251 (Treasure Island, 2023).
    1. Cappelletti M., Presicce P., Kallapur S. G., Immunobiology of acute chorioamnionitis. Front. Immunol. 11, 649 (2020). - PMC - PubMed
    1. Perkins R. P., Zhou S. M., Butler C., Skipper B. J., Histologic chorioamnionitis in pregnancies of various gestational ages: Implications in preterm rupture of membranes. Obstet. Gynecol. 70, 856–860 (1987). - PubMed
    1. Park C. W., Moon K. C., Park J. S., Jun J. K., Romero R., Yoon B. H., The involvement of human amnion in histologic chorioamnionitis is an indicator that a fetal and an intra-amniotic inflammatory response is more likely and severe: Clinical implications. Placenta 30, 56–61 (2009). - PMC - PubMed
    1. Romero R., Mazor M., Infection and preterm labor. Clin. Obstet. Gynecol. 31, 553–584 (1988). - PubMed

MeSH terms

LinkOut - more resources