. 2025 Oct 14;9(19):4757-4775.
doi: 10.1182/bloodadvances.2024015322.

BH3 mimetic drugs overcome the microenvironment-induced resistance to crizotinib in ALK+ anaplastic large cell lymphoma

Affiliations

BH3 mimetic drugs overcome the microenvironment-induced resistance to crizotinib in ALK+ anaplastic large cell lymphoma

Claudia Pignataro et al. Blood Adv. .

Abstract

Resistance to first-line chemotherapies and crizotinib in anaplastic large cell lymphoma (ALCL) represents a significant challenge, often leading to a dismal outcome. Despite recent advancements, the dissection of the intrinsic and extrinsic molecular alterations underlying crizotinib resistance in ALCL is still poorly understood. Here, we transcriptionally unraveled the bidirectional interplay between anaplastic lymphoma kinase (ALK)-driven ALCL (ALK+ ALCL) and stromal cells in the presence of crizotinib at bulk and single-cell levels and identified that the microenvironment provides prosurvival signals leading to crizotinib persistence in ALK+ ALCL. We detected increased B-cell lymphoma 2 (BCL2) expression and downregulation of pathways related to apoptosis in crizotinib-persister ALK+ ALCL cells. Furthermore, we predicted in silico the ligand-receptor interactions between tumoral and stromal cells, supporting their contribution to ALCL pathogenesis mainly participating in the adhesion/membrane transport, triggering receptors, and promoting activation and microenvironment stimulation in lymphoma cells. Finally, we explored the effect of crizotinib in combination with BH3 mimetics. Pharmacologic and genetic ablation of anti-apoptotic targets displayed a significant synergistic effect with crizotinib, overcoming the stroma-mediated protection of lymphoma cells on drug treatment. Thus, BCL2/B-cell lymphoma-extra large (BCL-XL) targeting is synthetic lethal with crizotinib exposure in ALK+ ALCL and represents an intrinsic- and extrinsic-mediated targetable vulnerability in lymphoma cells challenged with crizotinib. Our data support the evaluation of BCL2 targeting in crizotinib-based regimens in the management of patients with ALK+ ALCL.


Conflict of interest statement

Conflict-of-interest disclosure: The authors declare no competing financial interests.

Figures

None
Graphical abstract
Figure 1.
Figure 1.
ALCL cell line sensitivity to drugs. (A) Heat map reporting cell viability of the ALK+ ALCL SUPM2 cell line treated for 72 hours with the indicated drugs (x-axis) and concentrations (y-axis). (B) Heat map reporting cell viability of the ALK+ ALCL L82 cell line treated for 72 hours with the indicated drugs (x-axis) and concentrations (y-axis). (C) Heat map reporting cell viability of the ALK ALCL MAC1 cell line treated for 72 hours with the indicated drugs (x-axis) and concentrations (y-axis). (D) Heat map reporting cell viability of the ALK ALCL TLBR1 cell line treated for 72 hours with the indicated drugs (x-axis) and concentrations (y-axis).
Figure 2.
Figure 2.
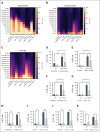
Stromal cell rescue drug treatment in ALCL cells. (A) Heat map reporting the percentage of propidium iodide–positive (PI+) cells in ALCL cells cocultured with MS-5 cells or cultured alone and treated for 72 hours with crizotinib at the indicated concentrations (y-axis). (B) Heat map reporting the percentage of PI+ cells in ALCL cells cocultured with MS-5 cells or cultured alone and treated for 72 hours with ruxolitinib at the indicated concentrations (y-axis). (C) Heat map reporting the percentage of PI+ cells in ALCL cells cocultured with MS-5 cells or cultured alone and treated for 72 hours with navitoclax at the indicated concentrations (y-axis). (D) Bar plot indicating the percentage of PI+ cells in SUPM2 untreated (NT) or exposed to 20 nM of doxorubicin for 72 hours, in the presence or absence of MS-5. P values were estimated with 2-way analysis of variance (ANOVA) test using GraphPad software (∗P < .05; ∗∗P < .01; ∗∗∗P < .001; ∗∗∗∗P < .0001). (E) Bar plot indicating the percentage of PI+ cells in MAC1 NT or exposed to 40 nM of doxorubicin for 72 hours, in the presence or absence of MS-5. P values were estimated with 2-way ANOVA test using GraphPad software (∗P < .05; ∗∗P < .01; ∗∗∗P < .001; ∗∗∗∗P < .0001). (F) Bar plot indicating the percentage of PI+ cells in SUPM2 NT or exposed to 100 nM of crizotinib for 72 hours, in the presence or absence of F44. P values were estimated with 2-way ANOVA test using GraphPad software (∗P < .05; ∗∗P < .01; ∗∗∗P < .001; ∗∗∗∗P < .0001). (G) Bar plot indicating the percentage of PI+ cells in L82 NT or exposed to 150 nM of crizotinib for 72 hours, in the presence or absence of F44. P values were estimated with 2-way ANOVA test using GraphPad software (∗P < .05; ∗∗P < .01; ∗∗∗P < .001; ∗∗∗∗P < .0001). (H) Bar plot indicating the percentage of PI+ cells in SUPM2 NT or exposed to 100 nM of crizotinib for 72 hours, in the presence or absence of F89. P values were estimated with 2-way ANOVA test using GraphPad software (∗P < .05; ∗∗P < .01; ∗∗∗P < .001; ∗∗∗∗P < .0001). (I) Bar plot indicating the percentage of PI+ cells in DHL1 NT or exposed to 100 nM of crizotinib for 72 hours, in the presence or absence of F75. P values were estimated with 2-way ANOVA test using GraphPad software (∗P < .05; ∗∗P < .01; ∗∗∗P < .001; ∗∗∗∗P < .0001). (J) Bar plot indicating the percentage of PI+ cells in DHL1 NT or exposed to 100 nM of crizotinib for 72 hours, in the presence or absence of HS-5. P values were estimated with 2-way ANOVA test using GraphPad software (∗P < .05; ∗∗P < .01; ∗∗∗P < .001; ∗∗∗∗P < .0001). (K) Bar plot indicating the percentage of PI+ cells in IL-69 NT or exposed to 500 nM of crizotinib for 72 hours, in the presence or absence of HS-5. P values were estimated with 2-way ANOVA test using GraphPad software (∗P < .05; ∗∗P < .01; ∗∗∗P < .001; ∗∗∗∗P < .0001).
Figure 3.
Figure 3.
Transcriptional intrinsic and extrinsic persistence mechanisms to crizotinib in ALK+ ALCL cells. (A) PCA of SUPM2 and L82 cells cocultured with MS-5 or cultured alone and treated with crizotinib (nt-20-50-100 nM) for 72 hours. (B) Venn diagram of the upregulated genes in SUPM2 cells cocultured with MS-5 vs alone and treated with crizotinib (nt-20-50-100 nM) for 72 hours. (C) Venn diagram of the upregulated genes in L82 cells cocultured with MS-5 vs alone and treated with crizotinib (nt-20-50-100 nM) for 72 hours. (D) Venn diagram of the upregulated genes in SUPM2 cells treated with crizotinib (20-50-100 nM) for 72 hours vs NT. (E) Venn diagram of the upregulated genes in L82 cells treated with crizotinib (20-50-100 nM) for 72 hours vs NT. (F) Heat map revealing the expression of selected genes in SUPM2 cells cocultured with MS-5 or cultured alone and treated with crizotinib (nt-20-50-100 nM) for 72 hours. (G) Heat map revealing the expression of selected genes in L82 cells cocultured with MS-5 or cultured alone and treated with crizotinib (nt-20-50-100 nM) for 72 hours. (H) Dot plot reporting the upregulation and downregulation of selected pathways in SUPM2 cells treated with crizotinib (50-100 nM) for 72 hours vs NT, in the presence or absence of MS-5. The color of the dots indicates the P value adjusted, whereas their size relates to the number of enriched gene sets among the analyzed collections. (I) Dot plot reporting the upregulation and downregulation of selected pathways in L82 cells cocultured with MS-5 vs alone and treated with crizotinib (50-100 nM) for 72 hours. The color of the dots indicates the P value adjusted, whereas their size relates to the number of enriched gene sets among the analyzed collections.
Figure 4.
Figure 4.
Stromal and ALK+ ALCL cell bidirectional crosstalk in the presence of crizotinib. (A) Venn diagram of the DEGs in MS-5 cells cultured alone vs MS-5 cocultured with SUPM2 or L82 cells for 72 hours. (B) Dot plot reporting the up- and downregulation of HALLMARKS in MS-5 cells cultured alone vs MS-5 cocultured with SUPM2 or L82 cells for 72 hours. The color of the dots indicates the P value adjusted, whereas their size relates to the fold enrichment. (C) Circos plot of the L-R interactions between MS-5 and L82 cells treated with 50 to 100 nM of crizotinib for 72 hours. Ligands are depicted in green, whereas receptors are in red. Interactions are colored differently based on their function. (D) Circos plot of the L-R interactions between MS-5 and SUPM2 cells treated with 50 to 100 nM of crizotinib for 72 hours. Ligands are depicted in green, whereas receptors are in red. Interactions are colored differently based on their function. GPCR, G protein-coupled receptor; RTK, receptor tyrosine kinase.
Figure 5.
Figure 5.
Single-cell dissection of crizotinib persister cells in ALK+ ALCL PDX in vivo. (A) Uniform manifold approximation and projection (UMAP) global cluster annotation based on single-cell RNA sequencing (Seq) expression (IL-69 and IL-79 PDX models treated with crizotinib or vehicle). (B) PDX-specific (IL-69 left panel and IL-79 right panel) UMAP cluster annotation based on single-cell RNA-seq expression of PDXs treated with crizotinib or vehicle. (C) Bar graph depicting the percent contribution of IL-69 cells receiving crizotinib (orange bars) or control (blue bars) to each cluster (CL0-CL6). (D) Bar graph depicting the percent contribution of IL-79 cells receiving crizotinib (orange bars) or control (blue bars) to each cluster (CL0-CL6). (E) Bar graph revealing the normalized enrichment score from the pathway hallmark analysis based on CL3 markers in IL-69 and IL-79 PDXs treated with crizotinib or with control. (F) Gene set enrichment analyses (GSEAs) of the “GOBP: T-cell Apoptotic Process – upper panel” and the “GOBP: Leukocyte Apoptotic Process – lower panel” based on CL3 markers in IL-69 and IL-79 PDXs treated with crizotinib or with control. (G) GSEAs of the “Hallmark_APOPTOSIS” between the crizotinib treated cells in CL3 vs the crizotinib treated cells in CL0 (i), CL1 (ii), CL2 (iii), CL4 (iv), and CL5 (v). CL3 was enriched of cells coming from crizotinib-treated PDXs (IL-69 and IL-79).
Figure 5.
Figure 5.
Single-cell dissection of crizotinib persister cells in ALK+ ALCL PDX in vivo. (A) Uniform manifold approximation and projection (UMAP) global cluster annotation based on single-cell RNA sequencing (Seq) expression (IL-69 and IL-79 PDX models treated with crizotinib or vehicle). (B) PDX-specific (IL-69 left panel and IL-79 right panel) UMAP cluster annotation based on single-cell RNA-seq expression of PDXs treated with crizotinib or vehicle. (C) Bar graph depicting the percent contribution of IL-69 cells receiving crizotinib (orange bars) or control (blue bars) to each cluster (CL0-CL6). (D) Bar graph depicting the percent contribution of IL-79 cells receiving crizotinib (orange bars) or control (blue bars) to each cluster (CL0-CL6). (E) Bar graph revealing the normalized enrichment score from the pathway hallmark analysis based on CL3 markers in IL-69 and IL-79 PDXs treated with crizotinib or with control. (F) Gene set enrichment analyses (GSEAs) of the “GOBP: T-cell Apoptotic Process – upper panel” and the “GOBP: Leukocyte Apoptotic Process – lower panel” based on CL3 markers in IL-69 and IL-79 PDXs treated with crizotinib or with control. (G) GSEAs of the “Hallmark_APOPTOSIS” between the crizotinib treated cells in CL3 vs the crizotinib treated cells in CL0 (i), CL1 (ii), CL2 (iii), CL4 (iv), and CL5 (v). CL3 was enriched of cells coming from crizotinib-treated PDXs (IL-69 and IL-79).
Figure 6.
Figure 6.
BH3 mimetics synergize with crizotinib in ALK+ ALCL. (A) Three-dimensional (3D) matrix plot revealing the effect of the drug combination (crizotinib plus navitoclax; synergism, additive effects or antagonism) in SUPM2 cells calculated and visualized using SynergyFinder plus software (highest single agent [HSA] reference model). Red regions, synergism; white, additive effect; green, antagonism. (B) 3D matrix plot revealing the effect of the drug combination (crizotinib plus navitoclax; synergism, additive effects or antagonism) in L82 cells calculated and visualized using SynergyFinder plus software (HSA reference model). Red regions, synergism; white, additive effect; green, antagonism. (C) 3D matrix plot revealing the effect of the drug combination (crizotinib plus navitoclax; synergism, additive effects or antagonism) in IL-69 PDX-Dline calculated and visualized using SynergyFinder plus software (has reference model). Red regions, synergism; white, additive effect; green, antagonism. (D) 3D matrix plot revealing the effect of the drug combination (crizotinib plus venetoclax; synergism, additive effects or antagonism) in SUPM2 cells calculated and visualized using SynergyFinder plus software (HSA reference model). Red regions, synergism; white, additive effect; green, antagonism. (E) 3D matrix plot revealing the effect of the drug combination (crizotinib plus venetoclax; synergism, additive effects, or antagonism) in IL-79 PDX-Dline calculated and visualized using SynergyFinder plus software (HSA reference model). Red regions, synergism; white, additive effect; green, antagonism. (F) Bar plot reporting the percent viability assessed by CellTiter-Glo assay of L82 cells transduced with BCL2 sh1 and treated for 72 hours with crizotinib (50 nM), in the presence or absence of doxycycline. P values were estimated with 2-way ANOVA test using GraphPad software (∗P < .05; ∗∗P < .01; ∗∗∗P < .001; ∗∗∗∗P < .0001). (G) Bar plot reporting the viability assessed by CellTiter-Glo assay of L82 cells transduced with BCL2 sh2 and treated for 72 hours with crizotinib (50 nM), in the presence or absence of doxycycline. P values were estimated with 2-way ANOVA test using GraphPad software (∗P < .05; ∗∗P < .01; ∗∗∗P < .001; ∗∗∗∗P < .0001). (H) Heat map reporting the percentage of PI+ cells of 9 PTCL PDX-Dlines treated for 72 hours with crizotinib and/or venetoclax at the indicated concentrations (y-axis). (I) Heat map reporting the percentage of PI+ cells of 9 PTCL PDX-Dlines treated for 72 hours with crizotinib and/or DT2216 at the indicated concentrations (y-axis). (J) 3D matrix plot revealing the effect of the drug combination (ruxolitinib plus navitoclax; synergism, additive effects, or antagonism) in MAC1 cells calculated and visualized using SynergyFinder plus software (has reference model). Red regions, synergism; white, additive effect; green, antagonism. (K) Synergy-sensitivity dot plot for all the drug combinations tested in ALCL cell lines and PDX-Dlines. HSA reference model. RUXO, ruxolitinib; VEN, venetoclax.
Figure 7.
Figure 7.
BH3 mimetics overcomes stromal protection to crizotinib in ALK+ ALCL cells. (A) Western blot analysis revealing the relative expression of the indicated (phospho)proteins in SUPM2 cells cultured alone or in the presence of MS-5 and treated with crizotinib (NT, 20-50-100 nM) for 72 hours. (B) Western blot analysis revealing the relative expression of the indicated (phospho)proteins in L82 cells cultured alone or in the presence of MS-5 and treated with crizotinib (NT, 20-50-100 nM) for 72 hours. (C) Bar plot reporting the percent viability assessed by propidium iodide (PI) incorporation in SUPM2 cells cultured alone or in the presence of MS-5 and treated with crizotinib (100 nM) and/or navitoclax (100 nM) for 72 hours. P values were estimated with 2-way ANOVA test using GraphPad software (∗P < .05; ∗∗P < .01; ∗∗∗P < .001; ∗∗∗∗P < .0001). (D) Bar plot reporting the percent viability assessed by PI incorporation in L82 cells cultured alone or in the presence of MS-5 and treated with crizotinib (150 nM) and/or navitoclax (100 nM) for 72 hours. P values were estimated with 2-way ANOVA test using GraphPad software (∗P < .05; ∗∗P < .01; ∗∗∗P < .001; ∗∗∗∗P < .0001). (E) Bar plot reporting the percent viability assessed by PI incorporation in SUPM2 cells cultured alone or in the presence of F103 cells and treated with crizotinib (100 nM) and/or navitoclax (100 nM) for 72 hours. P values were estimated with 2-way ANOVA test using GraphPad software (∗P < .05; ∗∗P < .01; ∗∗∗P < .001; ∗∗∗∗P < .0001). (F) Bar plot reporting the percent viability assessed by PI incorporation in L82 cells cultured alone or in the presence of F103 cells and treated with crizotinib (150 nM) and/or navitoclax (100 nM) for 72 hours. P values were estimated with 2-way ANOVA test using GraphPad software (∗P < .05; ∗∗P < .01; ∗∗∗P < .001; ∗∗∗∗P < .0001). (G) Bar plot reporting the percent viability assessed by PI incorporation in L82 cells cultured alone or in the presence of MS-5 and treated with crizotinib (150 nM) and/or venetoclax (200 nM) for 72 hours. P values were estimated with 2-way ANOVA test using GraphPad software (∗P < .05; ∗∗P < .01; ∗∗∗P < .001; ∗∗∗∗P < .0001). (H) Bar plot reporting the percent viability assessed by PI incorporation in IL-79 PDX-Dline cultured alone or in the presence of MS-5 and treated with crizotinib (50 nM) and/or venetoclax (200 nM) for 72 hours. P values were estimated with 2-way ANOVA test using GraphPad software (∗P < .05; ∗∗P < .01; ∗∗∗P < .001; ∗∗∗∗P < .0001). (I) Bar plot reporting the percent viability assessed by PI incorporation in SUPM2 cells cultured alone or in the presence of F72 and treated with crizotinib (100 nM) and/or venetoclax (200 nM) for 72 hours. P values were estimated with 2-way ANOVA test using GraphPad software (∗P < .05; ∗∗P < .01; ∗∗∗P < .001; ∗∗∗∗P < .0001). (J) Bar plot reporting the percent viability assessed by PI incorporation in DHL1 cells cultured alone or in the presence of HS-5 and treated with crizotinib (100 nM) and/or venetoclax (200 nM) for 72 hours. P values were estimated with 2-way ANOVA test using GraphPad software (∗P < .05; ∗∗P < .01; ∗∗∗P < .001; ∗∗∗∗P < .0001). (K) Antitumoral effect of crizotinib, venetoclax, or combinations in SUPM2 xenografts (6-12 xenografts per group). Error bars represent standard error of the mean (∗P < .05; ∗∗P < .001; ∗∗∗P < .001; ∗∗∗∗P < .0001). CTRL, control; ns, not significant.

References

    1. Alaggio R, Amador C, Anagnostopoulos I, et al. The 5th edition of the World Health Organization classification of haematolymphoid tumours: lymphoid neoplasms. Leukemia. 2022;36(7):1720–1748. - PMC - PubMed
    1. Attygalle AD, Chan JKC, Coupland SE, et al. The 5th edition of the World Health Organization classification of mature lymphoid and stromal tumors - an overview and update. Leuk Lymphoma. 2024;65(4):413–429. - PubMed
    1. Cree IA. The WHO classification of haematolymphoid tumours. Leukemia. 2022;36(7):1701–1702. - PMC - PubMed
    1. Fiore D, Cappelli LV, Broccoli A, Zinzani PL, Chan WC, Inghirami G. Peripheral T cell lymphomas: from the bench to the clinic. Nat Rev Cancer. 2020;20(6):323–342. - PubMed
    1. Swerdlow SH, Campo E, Arber DA, et al. Response to "The WHO classification of haematolymphoid tumours" (Editorial) Leukemia. 2022;36(11):2748–2749. - PubMed

MeSH terms