. 2025 Jul 15;6(7):102209.
doi: 10.1016/j.xcrm.2025.102209. Epub 2025 Jul 1.

Cardiolipin-mimic lipid nanoparticles without antibody modification delivered senolytic in vivo CAR-T therapy for inflamm-aging

Affiliations

Cardiolipin-mimic lipid nanoparticles without antibody modification delivered senolytic in vivo CAR-T therapy for inflamm-aging

Zihan Zhang et al. Cell Rep Med. .

Abstract

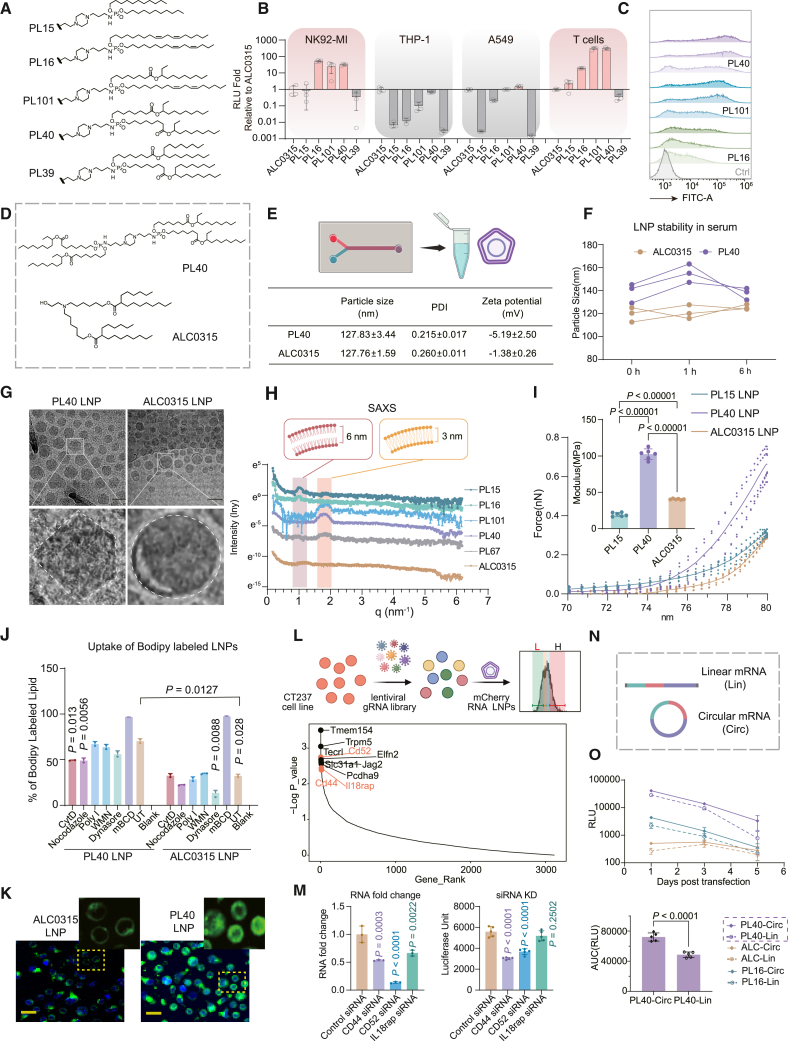
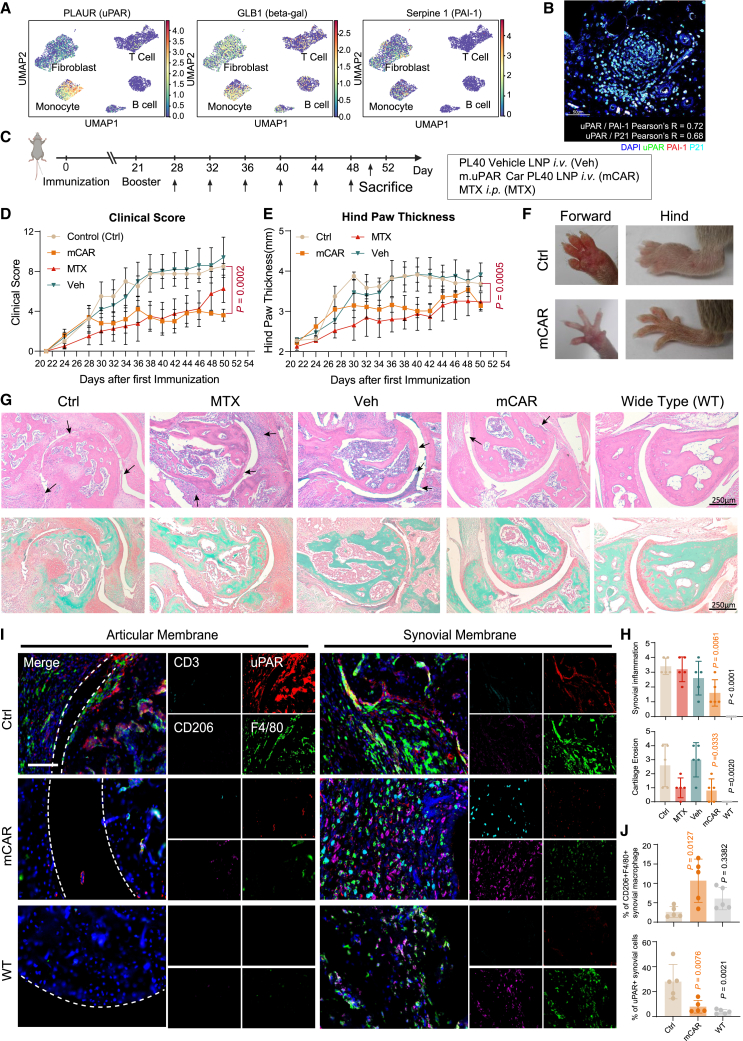
mRNA-based in vivo chimeric antigen receptor (CAR)-T cell engineering offers advantages over ex vivo therapies, including streamlined manufacturing and transient expression. However, current delivery methods require antibody-modified vehicles with manufacturing challenges. In this study, inspired by cardiolipin, we identify cardiolipin-like di-phosphoramide lipids that improve T cell transfection without targeting ligands, both in vitro and in vivo. The T cell-favored tropism is likely due to the lipid's packing, shape, and rigidity. Encapsulating circular RNA further prolongs mRNA expression in the spleen and T cells. Using PL40 lipid nanoparticles, we deliver mRNA encoding a CAR targeting the senolytic and inflammatory antigen urokinase-type plasminogen activator receptor (uPAR), alleviating uPAR-related liver fibrosis and rheumatoid arthritis (RA). Single-cell sequencing in humans confirms uPAR's relevance to senescence and inflammation in RA. To facilitate clinical translation, we screen and humanize single-chain variable fragments (scFvs) against uPAR, establishing a PL40 mRNA-encoded humanized uPAR CAR with potential for treating aging-inflamed disorders.

Keywords: T cells; aging-inflamed disorders; chimeric antigen receptor: CAR; circular mRNA; senolytic; uPAR.


Conflict of interest statement

Declaration of interests L.M., B.M., and Z.Z. have filed a patent for the development of CAMP lipids. M.D., L.M., X.G., Z.Z., and Z.L. have filed a patent for the human uPAR targeting CARs and antibodies.

Figures

None
Graphical abstract
Figure 1
Figure 1
Development of CAMP lipid library for RNA delivery to primary T cells (A) Schematic illustration of the mitochondria inner membrane, with cardiolipin and CAMP core lipid. Cardiolipin is used as the starting core structure to be modified into ionizable lipids. (B) Schematic illustrates the mechanisms of synthesis of CAMP lipid. The lipid is symmetrical, with only half of its structure depicted for clarity. (C) The structure of cardiolipin analog and non-symmetric control lipid. (D) The transfection efficiency of cardiolipin analog and non-symmetric control lipid on human primary T cell. CAMP lipids were formulated with other helper lipids into LNPs. mLuc were delivered by CAMP LNPs at a dose of 60 ng mRNA/105 cells. Luminescence was measured after 24 h (MessengerMax and ALC0315, n = 4; others, n = 3, mean ± SD). (E) The library of ionizable CAMP lipids. CAMP lipids are all symmetric structures, with only half of the structure presented. (F) Screening of the CAMP LNPs in primary human T cells. The method is same with (D) (PL48 ∼PL86, n = 3; PL16 ∼PL39, n = 4, mean ± SD); “n” indicated biologically independent samples. The schematic in (A) was created with BioRender.com.
Figure 2
Figure 2
Structure and morphology impact PL40 CAMP LNP delivery of mRNAs to T cells (A) The structure of CAMP lipids screened out for further study. (B) The transfection efficiency of CAMP lipid to various types of cells. The 96-well plate was paved with NK92mi, THP-1, A549, and human primary T cell; 60 ng/well mLuc was transfected and measured at 24 h (n = 4, mean ± SD). (C) The histogram of T cells transfected with CAMP lipids encapsulating GFP mRNA (mGFP). LNPs containing 0.1, 0.5, and 1 μg mGFP were incubated with 105 T cells (n = 3, mean ± SD). GFP was detected at 40 h by flow cytometry. (D) The full structure of PL40 and ALC0315. (E) Particle size and zeta potential of PL40 and ALC0315 LNPs (n = 3, mean ± SD). (F) Serum stability of PL40 and ALC0315 LNPs was detected (n = 3). (G) Representative Cryo-TEM images of PL40 and ALC0315 LNPs (scale bar, 100 nm). (H) SAXS data of CAMP lipid LNPs and ALC0315 LNPs. Lamellar distance was calculated based on q value. (I) Representative AFM images, the force curve, and Young’s modulus of PL15, PL40, and ALC0315 LNPs. Force curve and Young’s modulus were measured by AFM (n = 5, mean ± SD). (J) Cellular uptake of ALC0315 and PL40 LNPs. T cells were transfected by Cy5-labeled mRNA encapsulated in BODIPY-labeled LNPs at a dose of 0.5 μg/105 cells. Small-molecule inhibitors for multiple different endocytosis pathways were added. Percentage of LNP-positive cells was detected by flow cytometry 4 h after transfection (n = 2, mean ± SD). Experiments were repeated twice with similar results. Statistics were performed comparing to untreated group (UT). (K) The BODIPY-labeled lipid (green) and Hoechst 33342 (blue) florescence images for illustration of LNP cellular uptake. The images were acquired by High Content Imaging and Analysis System (Cell Voyager CV8000, Yokogawa); images were taken from 3 independent samples, and one representative was shown (scale bar, 10 μm). (L) Schematics illustrate flow cytometry-based CRISPR knockout (KO) screen method, and result was presented. Top 10 gRNAs enriched in the mCherry-low population were shown, the proteins specifically expressed on T cell were highlighted, and histogram of them was shown. (M) The CRISPR screening results were further verified by siRNA knockdown study. The knockdown of CD44, CD52, and IL18rap by siRNAs was confirmed by qPCR 1 day after siRNA transfection (n = 3, mean ± SD). The three siRNA and ctrl siRNA pretreated cells were transfected with 60 ng/well mLuc PL40 LNPs. Fluc levels were measured 1 day after particle incubation (n = 5, mean ± SD). (N) Structure of linear (Lin) RNA and circular (Circ) RNA. (O) T cells were transfected with Circ and Lin mLuc encapsulated by ALC, PL40, and PL16 LNPs. Luminescence was detected on day 1, 3, and 5, respectively (n = 5, mean ± SD). The area under curve (AUC) of PL40 was calculated. “n” indicated biologically independent samples. Statistical significance was calculated through two-tailed unpaired Student’s t test (E), one-way ANOVA with Tukey test (I), and Dunnett test (J).
Figure 3
Figure 3
In vivo delivery of mRNA LNPs to immune cells (A) IVIS images of i.v. injections of mLuc mRNA LNPs (mRNAs were prepared as Lin or Circ). 6 and 24 h after injection, organs were collected for imaging (n = 3). (B) Quantification of expression levels of mRNA LNPs 6 h after injection (n = 3). (C) Comparison of expression levels of mRNA LNPs between 6 and 24 h (n = 3, mean ± SD). (D) Illustration of the mCre studies in LoxP-Luciferase-2A-GFP mice. (E) LNPs were further modified with CD3-Fab, and particle size was measured after modification (n = 3). (F) GFP expression in different immune cells within the spleen, lymph node, and blood was measured 48 h after i.v. injection of 20 μg mCre (Circ or Lin) in PL40 LNPs (with or without CD3-Fab modification); the background was subtracted (n = 3, mean ± SD). (G) Representative histograms of T cell expression of GFP within spleens. (H) T cell gene expression markers after transfection with the mCre LNPs (n = 3, mean ± SD). “n” indicated biologically independent samples. Statistical significance was calculated through one-way ANOVA with Tukey test in (F) and Dunnett test in (H). All the schematic illustrations were created with BioRender.com.
Figure 4
Figure 4
PL40 LNPs efficiently engineered T cells into CAR-Ts (A) The construction map encoding muPAR-mCAR, muPAR-hCAR, and hCD19-hCAR. The structure of mRNA (either Lin or Circ) was indicated in the figure. (B) The design, synthesis, purification, and characterization of Circ RNA. (C) Transfection efficiency and dose dependence of CAMP LNPs encapsulating hCD19-hCAR mRNA. Human primary T cells were transfected with hCD19-hCAR mRNA at doses of 0.1, 0.5, or 1 μg per 105 T cells that were encapsulated by PL101 or PL40 LNPs. The transfection efficiency was detected at 40 h using flow cytometry (n = 3). (D) Expression of muPAR-mCAR mRNA in mouse T cells at different time points post-transfection. Mouse T cells were transfected with Lin and Circ muPAR-mCAR mRNAs that were encapsulated by PL40 LNPs at a dose of 0.5 μg/105 T cells. Expression of the CAR was detected at 1, 2, 3, and 5 days by flow cytometry (n = 3). (E and F) (E) The cytotoxicity of mRNA-based human CAR-T cells. The killing experiments were carried out at the E:T ratio of 10:1. Representative images at different time points post-coculture were presented in (F), n = 3 independent tests per group, scale bar, 1 mm. (G and H) (G) The cytotoxicity of mRNA-based mouse CAR-T cells. The killing experiments were carried out at the E:T ratio of 10:1, 20:1, and 40:1. Representative images at different time points post-coculture were presented in (H); n = 3 independent tests per group. The whole process was monitored by IncuCyte SX5 (n = 3; scale bar, 1 mm), and the fluorescence intensity was calculated by IncuCyte. Data were represented as mean ± SD; “n” indicated biologically independent samples. Statistical significance was calculated through one-way ANOVA with Tukey test. All the schematic illustrations were created with BioRender.com.
Figure 5
Figure 5
Anti-fibrosis effects of mCAR-uPAR LNPs in CCl4-induced fibrosis (A) Schematic representations of the CCl4-induced liver fibrosis models and treatment schedules. After treated with CCl4 for 5 weeks, the mice were i.v. administrated with mCAR-uPAR encapsulated by CD3-Fab or non-Fab modified PL40 LNPs at a dose of 30 μg/mouse. (B) Serum ALT from CCl4-induced fibrotic mice with all groups after 4 doses treatment (n = 6, mean ± SD). (C) Representative IHC and mIHC stainings of SA-β-gal, Sirius red, Masson’s trichrome, and uPAR/α-SMA in the livers of CCl4-induced liver fibrotic mice with all groups after treatment. mIHC images scale bar, 100 μm. The quantifications of the coverage% area of SA-β-gal, collagen, and uPAR/α-SMA was performed in 2 randomly selected fields per mouse (from n = 6 biological independent mice per group, mean ± SD). (D) IFNγ, IL-2, PD-1, and Tim-3 expression of T cells in the blood of treated mice measured by flow cytometry at day 4, day 7, and day 15 (n = 4 per time points, mean ± SD). “n” indicated biologically independent samples. Statistical significance was calculated through one-way ANOVA with Dunnet test. All the schematic illustrations were created with BioRender.com.
Figure 6
Figure 6
In vivo therapeutic effect of mCAR-uPAR LNPs in collagen-induced arthritis (A) scRNA-seq data of synovial membrane from RA patients from public resources. (B) mIHC staining of uPAR (green), PAI-1 (red), and P21 (cyan) in synovial samples from human RA patients; scale bar, 50 μm. (C) Schematic diagram of the treatment schedule for the CIA mouse model. (D–F) Clinical score and paw thickness of the CIA mice in different treated groups (n = 5, mean ± SD). (G and H) (G) Representative of H&E and safarin O/Fast green staining in the ankles of CIA mice with all groups. The quantification of inflammation level and cartilage erosion was performed in each mouse (from n = 5 biological independent mice per group, mean ± SD) and shown in (H). (I and J) (I) Paraffin section mIHC staining of uPAR (red), CD3 (cyan), F4/80 (green), and CD206 (magenta) in the ankles of CIA mice. Scale bar, 100 μm. Quantifications of the mIHC stainings were presented in (J), from n = 5 individual samples, mean ± SD. "n" indicated biologically independent samples. Statistical significance was calculated through one-way ANOVA with Dunnett test. All the schematic illustrations were created with BioRender.com.
Figure 7
Figure 7
Preparation of uPAR monoclonal antibodies and construction of uPAR CAR-T cells (A) Scheme of strategy for preparing uPAR mouse monoclonal antibodies. (B) The structure of the human uPAR protein. The human uPAR has 3 domains and a glycophosphatidylinositol (GPI) anchor. (C and D) (C) Screen mAbs against different fragments of human uPAR. Flow cytometry was used to detect the activation of CT237 reporter cells with different domains of chimeric uPAR extracellular region (D1, D2, D3, D1+D2, D2+D3, and FL, n = 1) (D) The binding affinity of AB4 and AB20 monoclonal antibodies to human uPAR measured by surface plasmon resonance (SPR). (E) Compared with the commercial uPAR antibody Vim5, AB4 and AB20 mAbs more sensitively detect uPAR on THP-1 cells. (F) Schematic illustrates the humanization of AB4 and AB20 monoclonal antibody and construction of the fully humanized CAR cargo. (G) HEK 293 cell display of humanized anti-uPAR scFv constructs and the binding affinity tests with target human uPAR antigen. Screening identified 2 humanized constructs with higher binding capability (n = 3, mean ± SD). (H) The dose-dependent binding properties of humanized AB4 and AB20 monoclonal antibodies to uPAR protein measured by flow cytometry (n = 3, mean ± SD). (I) The cytotoxicity of lentivirus-transfected AB4 VH2+VL1 CAR-T cells and AB20 VH1+VL2 CAR-T cells against uPAR+ AGS cell line at different E:T ratio (n = 3, mean ± SD). (J) The cytotoxicity of lentivirus-transfected AB4 VH2+VL1 CAR-T and AB20 VH1+VL2 CAR-T cells was tested against wild-type and uPAR-knocked out THP-1 cell lines, at E:T ratio of 4:1 (n = 3, mean ± SD). (K) Circ and Lin RNA of AB20 CAR were designed. The cytotoxicity of AB20 VH1+VL2 CAR-T cells, transfected by Lin RNA, Circ RNA PL40 LNPs, or lentivirus, was tested and compared on wild-type and uPAR-knocked out THP-1 cell lines, at different E:T ratio (n = 3, mean ± SD, Scale bar, 1 mm). (L) Schematic overview of the treatment setup for (M). NCG mice were inoculated i.v. with 1.2 × 10⁶ uPAR+ THP-1-Luc cells. Mice were treated with a single i.v. injection of T cells on day 5. On day 7 and 11, mice were dosed twice with either PL40 LNP vehicle or PL40 Cir#20 mRNA. (M) In vivo imaging data displaying luminescent signal in all experiments on day 7 and day 14 (n = 5 in each group). Statistical significance was calculated through one-way ANOVA with Tukey test. All the schematic illustrations were created with BioRender.com.

References

    1. Baker D.J., Arany Z., Baur J.A., Epstein J.A., June C.H. CAR T therapy beyond cancer: the evolution of a living drug. Nature. 2023;619:707–715. doi: 10.1038/s41586-023-06243-w. - DOI - PubMed
    1. Mackensen A., Müller F., Mougiakakos D., Böltz S., Wilhelm A., Aigner M., Völkl S., Simon D., Kleyer A., Munoz L., et al. Anti-CD19 CAR T cell therapy for refractory systemic lupus erythematosus. Nat. Med. 2022;28:2124–2132. doi: 10.1038/s41591-022-02017-5. - DOI - PubMed
    1. Chung J.B., Brudno J.N., Borie D., Kochenderfer J.N. Chimeric antigen receptor T cell therapy for autoimmune disease. Nat. Rev. Immunol. 2024;24:830–845. doi: 10.1038/s41577-024-01035-3. - DOI - PMC - PubMed
    1. Amor C., Feucht J., Leibold J., Ho Y.-J., Zhu C., Alonso-Curbelo D., Mansilla-Soto J., Boyer J.A., Li X., Giavridis T., et al. Senolytic CAR T cells reverse senescence-associated pathologies. Nature. 2020;583:127–132. doi: 10.1038/s41586-020-2403-9. - DOI - PMC - PubMed
    1. Deng Y., Kumar A., Xie K., Schaaf K., Scifo E., Morsy S., Li T., Ehninger A., Bano D., Ehninger D. Targeting senescent cells with NKG2D-CAR T cells. Cell Death Discov. 2024;10 doi: 10.1038/s41420-024-01976-7. - DOI - PMC - PubMed

MeSH terms