. 2025 Jul 2;8(9):e202403195.
doi: 10.26508/lsa.202403195. Print 2025 Sep.

Sephin1 reduces TDP-43 cytoplasmic mislocalization and improves motor neuron survival in ALS models

Affiliations

Sephin1 reduces TDP-43 cytoplasmic mislocalization and improves motor neuron survival in ALS models

Emmanuelle Abgueguen et al. Life Sci Alliance. .

Abstract

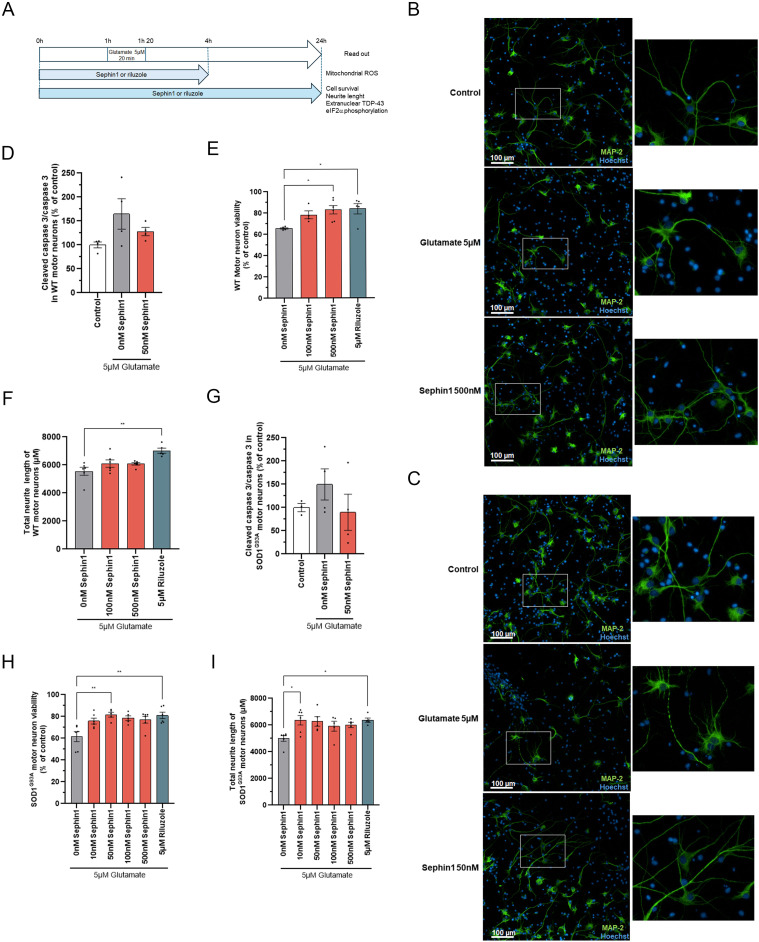
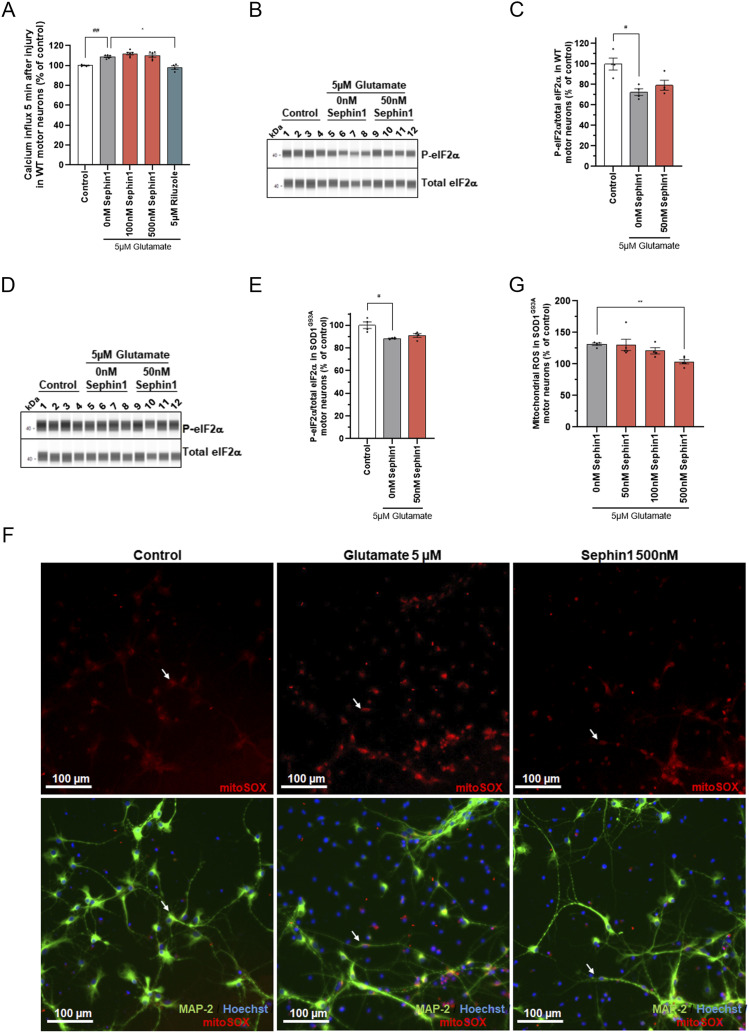
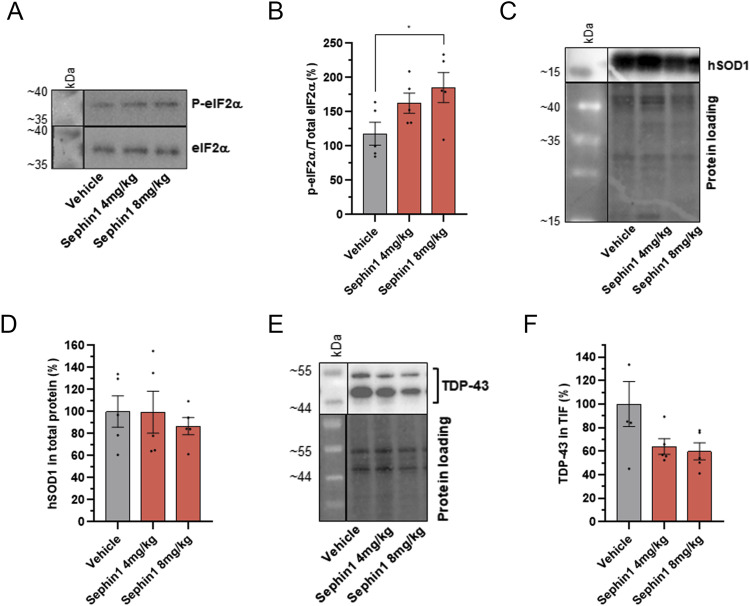
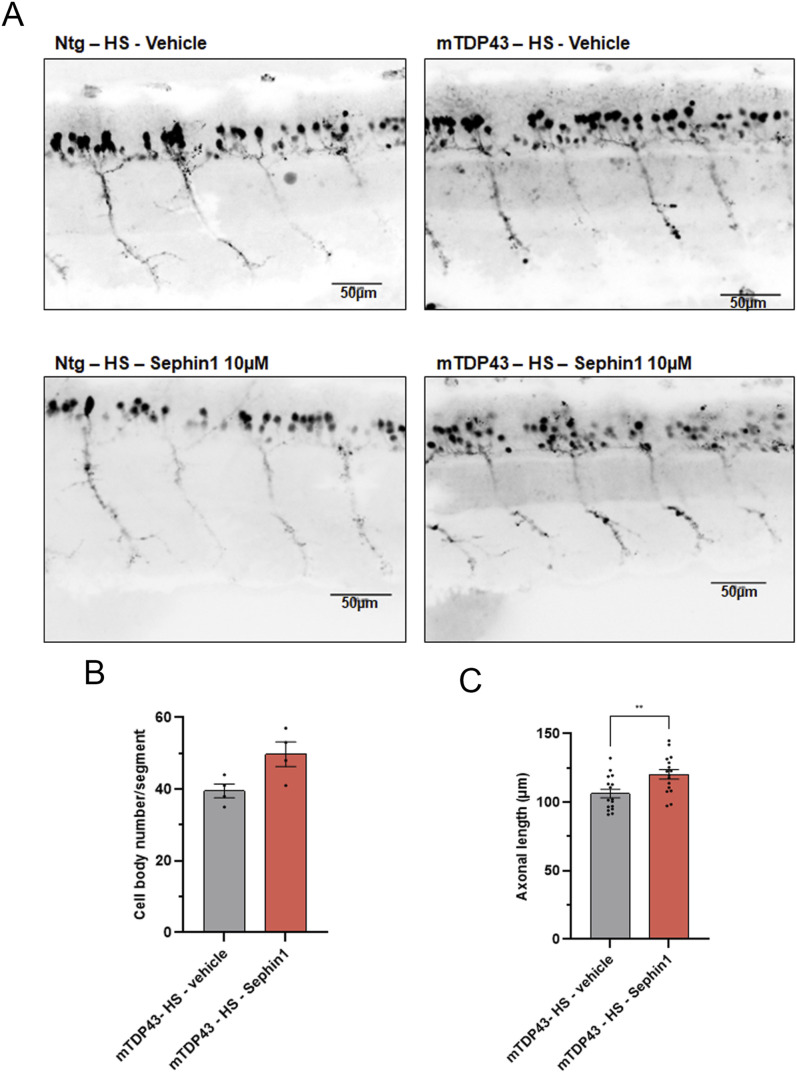
A pathological hallmark of ALS is the abnormal accumulation of misfolded proteins (e.g., TDP-43) and enlarged endoplasmic reticulum (ER), indicating ER stress. To resolve this stress, cells initiate the Unfolded Protein Response (UPR). However, unresolved stress leads to apoptosis. In ALS, UPR activation fails to resolve proteostasis impairment. UPR activation modulators, among them Sephin1, reduce protein aggregates and improve motor neuron survival in ALS models. We demonstrate that following glutamate intoxication, Sephin1 increases motor neuron survival by reducing mitochondria ROS production and extranuclear TDP-43. Sephin1 reduces abnormal splicing because of TDP-43 nuclear loss of function following oxidative stress. In SOD1G93A mice, Sephin1 treatment decreases TDP-43 in triton-insoluble fraction, improving motor neuron survival in spinal cord. Sephin1 improves motor neurons survival, motor function and survival of mutated TDP-43 transgenic zebrafish. Sephin1 improves motor neuron survival in ALS models by reducing TDP-43 cytoplasmic mislocalization and its toxicity. These findings open new therapeutic opportunities for Sephin1 in neurodegenerative pathologies with TDP-43 proteinopathy, including ALS.


Conflict of interest statement

E Abgueguen, BL Lejeune, A Visbecq, and PY Miniou are employed by InFlectis BioScience. PY Miniou is co-founder of InFlectis BioScience. N Callizot is a member of the scientific advisory board and consultant for InFlectis BioScience.

Figures

Figure 1.
Figure 1.. Sephin1 protects primary WT and SOD1G93A rat motor neurons against glutamate injury.
(A) Schematic of the experiment on primary WT and SOD1G93A rat motor neurons. (B) Representative pictures of primary WT rat motor neurons treated with glutamate 5 μM for 20 min in presence of DMSO (vehicle) or Sephin1 500 nM 24 h after glutamate intoxication. Motor neurons are labeled with the neuronal marker, MAP-2. Right panel: enlargement of motor neurons (C) Representative pictures of primary SOD1G93A rat motor neurons treated with glutamate 5 μM for 20 min in presence of DMSO (vehicle) or Sephin1 50 nM 24 h after glutamate intoxication. Motor neurons are labeled with the neuronal marker, MAP-2. Right panel: enlargement of motor neurons (D) Cleaved caspase 3 level measured 24 h after glutamate intoxication in primary WT rat motor neurons culture treated with glutamate 5 μM for 20 min in presence of DMSO (vehicle) or Sephin1 50 nM. (E) Cell viability in glutamate intoxicated primary WT rat motor neurons treated for 24 h with DMSO (Vehicle), Sephin1, or riluzole. (F) Total neurite length of primary WT rat motor neurons treated for 24 h with DMSO (Vehicle), Sephin1 or riluzole 24 h after glutamate intoxication. (G) Cleaved caspase 3 level measured 24 h after glutamate intoxication in primary SOD1G93A rat motor neurons culture treated with glutamate 5 μM for 20 min in presence of DMSO (vehicle) or Sephin1 50 nM 24 h. (H) Cell viability in glutamate intoxicated primary SOD1G93A rat motor neurons treated for 24 h with DMSO (Vehicle), Sephin1 or riluzole. (I) Total neurite length of primary WT rat motor neurons treated for 24 h with DMSO (Vehicle), Sephin1 or riluzole 24 h after glutamate intoxication. *P < 0.05, **P < 0.01 versus 0 nM Sephin1 Kruskal-Wallis test followed by Dunn’s multiple comparison test; mean ± SEM n = 4–6 replicates per condition. Source data are available for this figure.
Figure S1.
Figure S1.. Glutamate intoxication decreases cell viability, neurite network integrity, and increases extranuclear TDP-43 in primary motor neurons from WT and SOD1G93A rats.
(A) Representative picture of immunoblot obtained by WES automated WB apparatus for caspase 3 and cleaved caspase 3 proteins in primary WT rat motor neurons intoxicated with glutamate and treated with DMSO or Sephin1 50 nM. (B) Cell viability in control and glutamate intoxicated primary WT rat motor neurons. (C) Total neurite length in control and glutamate intoxicated primary WT rat motor neurons. (D) Percentage of extranuclear TDP-43 in control and glutamate intoxicated primary WT rat motor neurons. (E) Cell viability in control and glutamate intoxicated primary SOD1G93A rat motor neurons. (F) Total neurite length in control and glutamate intoxicated primary SOD1G93A rat motor neurons. (G) Percentage of extranuclear TDP-43 in control and glutamate intoxicated primary SOD1G93A rat motor neurons. (H) Mitochondrial ROS level in control and glutamate intoxicated primary SOD1G93A rat motor neurons. *P < 0.05, **P < 0.01 Mann-Whitney test, mean ± SEM n = 4–6 replicates per condition.
Figure 2.
Figure 2.. Sephin1 reduces mitochondrial ROS without modulating calcium flux or the phosphorylation of eIF2α in primary rat motor neurons against glutamate intoxication.
(A) Calcium influx level in primary WT rat motor neurons treated with DMSO, Sephin1 or riluzole measured 5 min after the glutamate intoxication. (B) Representative pictures obtained by WES automated WB apparatus of the eIF2α phosphorylated and eIF2α immunoblots in primary WT rat motor neurons intoxicated with glutamate and treated with DMSO or Sephin1 50 nM. (C) eIF2α phosphorylation level in primary WT rat motor neurons intoxicated with glutamate and treated with DMSO or Sephin1 50 nM 24 h after glutamate intoxication. (D) Representative pictures obtained by WES automated WB apparatus of the eIF2α phosphorylated and eIF2α immunoblots in primary SOD1G93A rat motor neurons intoxicated with glutamate and treated with DMSO or Sephin1 50 nM. (E) eIF2α phosphorylation level in primary SOD1G93A rat motor neurons intoxicated with glutamate and treated with DMSO or Sephin1 24 h after glutamate intoxication. (F) Representative pictures of mitoSOX staining (top panel) in primary SOD1G93A rat motor neurons enriched culture intoxicated with glutamate and treated with DMSO or Sephin1 500 nM, 4 h after glutamate intoxication. Representative images of mitoSOX staining overlapped with MAP-2 staining and Hoechst (bottom panel) in primary SOD1G93A rat motor neurons enriched culture intoxicated with glutamate and treated with DMSO or Sephin1 500 nM, 4 h after glutamate intoxication. White arrow: mitoSOX staining in MAP-2 labeled motor neurons. (G) Mitochondrial ROS level in primary SOD1G93A rat motor neurons intoxicated with glutamate and treated with DMSO or Sephin1. #P < 0.05, ##P < 0.01 versus 0 nM Sephin1 Mann-Whitney test; **P < 0.01 versus 0 nM Sephin1 Kruskal-Wallis test followed by Dunn’s multiple comparison test; mean ± SEM n = 4–6 replicates per condition. Source data are available for this figure.
Figure 3.
Figure 3.. Sephin1 reduces extranuclear TDP-43 localization in primary motor neurons from WT and SOD1G93A rats.
(A) Representative pictures of TDP-43 localization in control primary SOD1G93A rat motor neurons, in primary SOD1G93A rat motor neurons intoxicated by glutamate and in primary SOD1G93A rat motor neurons intoxicated by glutamate in presence of Sephin1 100 nM. White arrows: TDP-43 localization in cytoplasm of MAP-2 labeled motor neurons, white star: TDP-43 localization in nucleus of MAP-2 labeled motor neurons. (B) Extranuclear TDP-43 level in primary WT rat motor neurons intoxicated by glutamate and treated with DMSO, Sephin1, or riluzole 5 μM for 24 h. (C) Extranuclear TDP-43 level in primary SOD1G93A rat motor neurons intoxicated by glutamate and treated with DMSO, Sephin1, or riluzole 5 μM for 24 h *P < 0.05, **P < 0.01, ***P < 0.001 versus 0 nM Sephin1 Kruskal-Wallis test followed by Dunn’s multiple comparison test; mean ± SEM n = 4–6 replicates per condition.
Figure 4.
Figure 4.. Sephin1 reduces abnormal splicing during the recovery period after 1 h of arsenite stress.
(A) Schematic of the experiment on SH-SY5Y. (B) Expression level of TDP-43 in nuclear fraction, RIPA-soluble fraction and RIPA-insoluble (urea) fraction during the recovery period after 1 h of arsenite treatment (n = 3 independent experiments). (C) Expression level of TDP-43 in nuclear fraction, RIPA-soluble fraction and RIPA-insoluble fraction during the recovery period after 1 h of arsenite treatment in SH-SY5Y treated with Sephin1 10 μM compared with SH-SY5Y treated with DMSO (n = 3 independent experiments). (D) Tardbp mRNA expression level in arsenite treated SH-SH5Y at 0, 3, and 6 h of recovery (n = 5 independent experiments). (E) Stmn2 WT mRNA expression level in arsenite treated SH-SY5Y at 0, 3, and 6 h of recovery (n = 5 independent experiments). (F) Poldip3-SE mRNA expression level in arsenite treated SH-SH5Y at 0, 3, and 6 h of recovery (n = 5 independent experiments). (G) Tardbp mRNA expression level at 0, 3, and 6 h of recovery in arsenite stressed SH-SY5Y treated with Sephin1 10 μM compared with SH-SY5Y treated with DMSO (n = 5 independent experiments). (H) Stmn2 WT mRNA expression level at 0, 3, and 6 h of recovery in arsenite stressed SH-SY5Y treated with Sephin1 10 μM compared with SH-SY5Y treated with DMSO (n = 5 independent experiments). (I) Poldip3-SE mRNA expression level at 0, 3 and 6 h of recovery in arsenite stressed SH-SY5Y treated with Sephin1 10 μM compared with SH-SY5Y treated with DMSO (n = 5 independent experiments). *P < 0.05, **P < 0.01 Friedman test followed by Dunn’s multiple comparison test; &P < 0.05 two-way ANOVA followed by Sidak’s multiple comparison test. Mean ± SEM.
Figure S2.
Figure S2.. Sephin1 reduces TDP-43 translocation following arsenite treatment.
(A) Representative picture of immunoblots of TDP-43 in nuclear fraction from SH-SY5Y cells treated for 1 h with arsenite 250 μM and recovered for 0, 1, 3, or 6 h in fresh medium containing DMSO or Sephin1 10 μM. (B) Expression level of TDP-43 in nuclear fraction during the recovery period after 1 h of arsenite treatment (n = 3 independent experiments). (C) Expression level of TDP-43 in nuclear fraction during the recovery period after 1 h of arsenite treatment in SH-SY5Y treated with Sephin1 10 μM compared with SH-SY5Y treated with DMSO (n = 3 independent experiments). (D) Representative picture of immunoblot of TDP-43 and STMN2 in RIPA-soluble fraction from SH-SY5Y cells treated for 1 h with arsenite 250 μM and recovered for 0, 1, 3, or 6 h in fresh medium containing DMSO or Sephin1 10 μM. (E) Expression level of TDP-43 in RIPA-soluble fraction during the recovery period after 1 h of arsenite treatment (n = 3 independent experiments). (F) Expression level of TDP-43 in RIPA-soluble fraction during the recovery period after 1 h of arsenite treatment in SH-SY5Y treated with Sephin1 10 μM compared with SH-SY5Y treated with DMSO (n = 3 independent experiments). (G) Representative picture of immunoblot of TDP-43 in RIPA-insoluble fraction from SH-SY5Y cells treated for 1 h with arsenite 250 μM and recovered for 0, 1, 3, or 6 h in fresh medium containing DMSO or Sephin1 10 μM. (H) Expression level of TDP-43 in RIPA-insoluble fraction during the recovery period after 1 h of arsenite treatment (n = 3 independent experiments). (I) Expression level of TDP-43 in RIPA-insoluble fraction during the recovery period after 1 h of arsenite treatment in SH-SY5Y treated with Sephin1 10 μM compared with SH-SY5Y treated with DMSO (n = 3 independent experiments). (J) Expression level of STMN2 in RIPA-soluble fraction during the recovery period after 1 h of arsenite treatment (n = 3 independent experiments). (K) Expression level of STMN2 in RIPA-soluble fraction during the recovery period after 1 h of arsenite treatment in SH-SY5Y treated with Sephin1 10 μM compared with SH-SY5Y treated with DMSO (n = 3 independent experiments). *P < 0.05 Friedman test followed by Dunn’s multiple comparison test; &P < 0.05 two-Way ANOVA followed by Tukey’s multiple comparison test. Mean ± SEM. Source data are available for this figure.
Figure 5.
Figure 5.. Sephin1 improves survival of spinal cord motor neurons from SOD1G93A female mice at 20 wk of age.
(A) Schematic of the experiment on female SOD1G93A mice. (B) Representative pictures of motor neurons labeled with ChAT antibody in hemisection of spinal cord of WT (Ntg) and SOD1G93A mice at 20 wk of age (magnification 4×). (C) Motor neuron number in spinal cord of 20 wk-old WT or SOD1G93A mice. (D) Motor neuron number in spinal cord of 20-wk-old SOD1G93A mice treated with vehicle, Sephin1 at 4 or 8 mg/kg per day. (E) Plasmatic NFL level in 20-wk-old WT or SOD1G93A mice treated with vehicle, Sephin1 at 4 or 8 mg/kg per day. #P < 0.05 Mann-Whitney test; *P < 0.05 versus vehicle Kruskal-Wallis test followed by Dunn’s multiple comparison test; mean ± SEM n = 3–5 mice per condition.
Figure 6.
Figure 6.. Sephin1 increases eIF2α phosphorylation level and reduces TDP-43 in TIF from spinal cord motor neurons of SOD1G93A female mice at 20 wk of age.
(A) Representative pictures of immunoblot of eIF2α phosphorylated and eIF2α proteins in spinal cord of 20-wk-old SOD1G93A mice treated with vehicle, Sephin1 at 4 or 8 mg/kg per day. (B) eIF2α phosphorylation level in the spinal cord of 20-wk-old SOD1G93A mice treated with vehicle, Sephin1 at 4 or 8 mg/kg per day. (C) Representative images of immunoblot of hSOD1 protein in spinal cord of 20-wk-old SOD1G93A mice treated with vehicle, Sephin1 at 4 or 8 mg/kg per day. (D) hSOD1 protein level in spinal cord of 20-wk-old SOD1G93A mice treated with vehicle, Sephin1 at 4 or 8 mg/kg per day. (E) Representative picture of TDP-43 immunoblot of TIF from spinal cord of 20-wk-old SOD1G93A mice treated with vehicle, Sephin1 at 4 or 8 mg/kg per day. (F) TDP-43 level in TIF from spinal cord of 20-wk-old SOD1G93A mice treated with vehicle, Sephin1 at 4 or 8 mg/kg per day. *P < 0.05 versus vehicle Kruskal-Wallis test followed by Dunn’s multiple comparison test; mean ± SEM n = 3–5 mice per condition. Source data are available for this figure.
Figure S3.
Figure S3.. No improvement of motor function or survival by Sephin1 treatment in SOD1G93A female mice.
(A) Body weight measurement over the 12 wk of treatment with vehicle, Sephin1 4 mg/kg or Sephin1 8 mg/kg (P = 0.0256 vehicle versus Sephin1 4 mg/kg at 20 wk, mixed effects analysis followed by Tukey’s multiple comparisons test n = 22 mice per condition). (B) Weekly measurement of the latency to fall in rotarod test of SOD1G93A mice treated with vehicle, Sephin1 4 mg/kg or Sephin1 8 mg/kg n = 22 mice per condition. (C) Weekly measurement of hanging time in the grip test of SOD1G93A mice treated with vehicle, Sephin1 4 mg/kg or Sephin1 8 mg/kg n = 22 mice per condition. (D) Disease onset of SOD1G93A mice treated with vehicle, Sephin1 4 mg/kg or Sephin1 8 mg/kg n = 13 mice per condition. (E) Probability of survival from disease onset of SOD1G93A mice treated with vehicle, Sephin1 4 mg/kg or Sephin1 8 mg/kg n = 13 mice per condition.
Figure 7.
Figure 7.. Sephin1 improves survival and locomotor function in zebrafish embryos expressing mutant TDP-43G348C protein.
(A) Schematic of the experiment in mutated TDP-43 transgenic zebrafish embryos. (B) Survival percentage of zebrafish embryos expressing mutant TDP-43G348C protein treated with vehicle or Sephin1 10 μM (**P < 0.01 unpaired t test, n = 12 replicates per condition). (C) Motor dysfunction percentage of zebrafish embryos expressing mutant TDP-43G348C protein treated with vehicle or Sephin1 10 μM (**P < 0.01 unpaired t test, n = 12 replicates per condition). (D) Swim distance of zebrafish embryos expressing mutant TDP-43G348C protein treated with vehicle or Sephin1 10 μM following the touch of the tail (****P < 0.0001 Mann-Whitney test n = 35–50 zebrafish per condition). (E) Swim duration of zebrafish embryos expressing mutant TDP-43G348C protein treated with vehicle or Sephin1 10 μM following the touch of the tail (****P < 0.0001 Mann-Whitney test n = 35–53 zebrafish per condition). (F) Swim velocity of zebrafish embryos expressing mutant TDP-43G348C protein treated with vehicle or Sephin1 10 μM following the touch of the tail (*P < 0.05 Mann-Whitney test, n = 35–50 zebrafish per condition). mTDP43-HS: zebrafish embryos expressing TDP43G348C protein; mean ± SEM.
Figure S4.
Figure S4.. Impact of TDP-43G348C protein expression in zebrafish embryos on survival and locomotor function.
(A) Immunoblot of TDP-43 in zebrafish embryos. The C-terminal TDP-43 antibody detects a band ($) at ∼75 kD in the zebrafish embryos expressing TDP-43G348C protein only. (B) Percentage of survival of zebrafish embryos treated with vehicle or Sephin1 10 μM (n = 8–12 replicates per condition). (C) Motor dysfunction in zebrafish embryos treated with vehicle or Sephin1 10 μM (n = 8–12 replicates per condition). (D) Swin distance measured in zebrafish embryos treated with vehicle or Sephin1 10 μM after the touch of the tail (n = 4–50 zebrafish per condition). (E) Swim duration measured in zebrafish embryos treated with vehicle or Sephin1 10 μM after the touch of the tail (n = 4–50 zebrafish per condition). (F) Swim velocity measured in zebrafish embryos treated with vehicle or Sephin1 10 μM after the touch of the tail (n = 4–50 zebrafish per condition). Ntg: WT zebrafish; Ntg-HS: WT zebrafish with two heat shock; mTDP43: zebrafish harboring the mTDP43 transgene without expressing the TDP43G348C protein; mTDP43-HS: zebrafish expressing TDP43G348C protein. *P < 0.05, **P < 0.01, ***P < 0.001, ****P < 0.0001 Kruskal-Wallis test followed by Dunn’s multiple comparison test; mean ± SEM. Source data are available for this figure.
Figure S5.
Figure S5.. Impact of TDP-43G348C protein expression in motor neurons of zebrafish embryos.
(A) Number of cell body of motor neurons per segment of zebrafish embryos treated with vehicle or Sephin1 (n = 4 replicates per condition). (B) Axonal length of motor neurons in zebrafish embryos treated with vehicle or Sephin1 (n = 16 motor neurons per condition). mTDP43: zebrafish harboring the mTDP43 transgene without expressing the TDP43G348C protein; mTDP43-HS: zebrafish expressing TDP43G348C protein. *P < 0.05, ****P < 0.0001 Kruskal-Wallis test followed by Dunn’s multiple comparison test mean ± SEM.
Figure 8.
Figure 8.. Sephin1 improves motor neurons survival and axonal length in zebrafish embryos expressing mutant TDP-43G348C protein.
(A) Representative pictures of spinal cord motor neurons of non-transgenic (Ntg) or mutant TDP-43G348C protein expressing zebrafish embryos at 51 hpf and treated with vehicle or Sephin1 10 μM. (B) Cell body number of motor neurons measured per segment in zebrafish embryos expressing mutant TDP-43G348C protein treated with vehicle or Sephin1 10 μM. (P = 0.0857 Mann-Whitney test, n = 4 replicates per condition). (C) Axonal length of motor neurons in zebrafish embryos expressing mutant TDP-43G348C protein treated with vehicle or Sephin1 10 μM. (**P < 0.01 unpaired t test, n = 16 motor neurons per condition). Ntg-HS: WT zebrafish with 2 heat shock, mTDP43-HS: zebrafish embryos expressing TDP43G348C protein mean ± SEM.
Figure S6.
Figure S6.. Decision tree for statistical analysis applied to this study.
(A) Decision tree for the statistical analysis of two or more than two conditions. (B) Decision tree for the statistical analysis of longitudinal data. Statistical analysis was performed on GraphPad Prism software version 10.3.1.

References

    1. Al Shoyaib A, Archie SR, Karamyan VT (2019) Intraperitoneal route of drug administration: Should it be used in experimental animal studies? Pharm Res 37: 12. 10.1007/s11095-019-2745-x - DOI - PMC - PubMed
    1. Al-Khayri JM, Ravindran M, Banadka A, Vandana CD, Priya K, Nagella P, Kukkemane K (2024) Amyotrophic lateral sclerosis: Insights and new prospects in disease pathophysiology, biomarkers and therapies. Pharmaceuticals 17: 1391. 10.3390/ph17101391 - DOI - PMC - PubMed
    1. Arnold FJ, Putka AF, Raychaudhuri U, Hsu S, Bedlack RS, Bennett CL, La Spada AR (2024) Revisiting glutamate excitotoxicity in amyotrophic lateral sclerosis and age-related neurodegeneration. Int J Mol Sci 25: 5587. 10.3390/ijms25115587 - DOI - PMC - PubMed
    1. Basso M, Samengo G, Nardo G, Massignan T, D’Alessandro G, Tartari S, Cantoni L, Marino M, Cheroni C, De Biasi S, et al. (2009) Characterization of detergent-insoluble proteins in ALS indicates a causal link between nitrative stress and aggregation in pathogenesis. PLoS One 4: e8130. 10.1371/journal.pone.0008130 - DOI - PMC - PubMed
    1. Dalla Bella E, Bersano E, Antonini G, Borghero G, Capasso M, Caponnetto C, Chiò A, Corbo M, Filosto M, Giannini F, et al. (2021) The unfolded protein response in amyotrophic later sclerosis: Results of a phase 2 trial. Brain J Neurol 144: 2635–2647. 10.1093/brain/awab167 - DOI - PMC - PubMed

MeSH terms

LinkOut - more resources