. 2025 Jul 15;19(27):25180-25203.
doi: 10.1021/acsnano.5c05498. Epub 2025 Jul 2.

Self-Assembly of Accumulated Sphingolipids into Cytotoxic Fibrils in Globoid Cell Leukodystrophy and Their Inhibition by Small Molecules In Vitro

Affiliations

Self-Assembly of Accumulated Sphingolipids into Cytotoxic Fibrils in Globoid Cell Leukodystrophy and Their Inhibition by Small Molecules In Vitro

Sourav Kumar et al. ACS Nano. .

Erratum in

Abstract

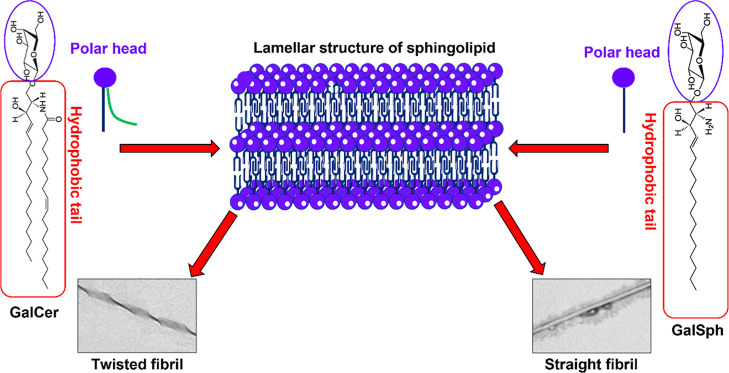
Globoid cell leukodystrophy (GLD) is a rare hereditary inborn error of metabolism due to recessive mutations that cause loss of function of the enzyme galactosylceramidase (GALC). This results in the accumulation of the sphingolipids galactosylceramide (GalCer) and galactosylsphingosine (GalSph) in the lysosomes of neuronal cells. The accumulated GalCer and GalSph in cerebral macrophages of GLD patients are neurotoxic to oligodendrocytes and Schwann cells, leading to demyelination in the nervous system. The disease typically presents with infantile onset in the first six months of life and death by age 2. Here, we identified a supramolecular structure of GalCer and GalSph that may contribute to GLD pathology. Using biophysical assays commonly used for studying proteinaceous amyloids, e.g., amyloid-specific dyes, microscopical imaging, and a series of analytical methods (FTIR, PXRD, and SAXS), we demonstrate that both GalCer and GalSph can self-assemble in vitro into highly organized fibrils reminiscent of fibrils of amyloidogenic proteins. These fibrils exhibit significant cytotoxicity to both neuronal and oligodendroglial cells. Using an inhibitor of the GALC enzyme in cell culture to mimic the GLD pathophysiology, we could detect the accumulation of these fibrils in cells. We also observed that small molecules, which are bona fide inhibitors of proteinaceous amyloids, effectively mitigated the formation of the GalCer and GalSph fibrillar structures in vitro. Finally, the small molecule ameliorated the cytotoxic effects of the sphingolipid fibrils in SH-SY5Y cells, suggesting a potential avenue for therapeutic intervention in GLD orphan disease.

Keywords: apoptosis; galactosylceramide; galactosylsphingosine; globoid cell leukodystrophy; self-assembly; small molecule inhibitors; sphingolipids.


Figures

1
1
Self-assemblies of GalCer and GalSph into amyloid-like fibrils in vitro. Time-dependent ThS fluorescence at 485 nm for the aggregation of GalCer at different concentrations in (a) PBS pH 7.4 and (b) AB pH 4.5 and GalSph in (c) PBS pH 7.4 and (d) AB pH 4.5. Turbidity assay of (e) GalCer and (f) GalSph in PBS pH 7.4 and AB pH 4.5 at different concentrations. ANS-binding assay for the aggregation of (g) GalCer and (h) GalSph at different concentrations (20–300 μM). ANS emission spectra of GalCer and GalSph were recorded at the wavelength range of 400–700 nm. A sharp blue shift was observed for both of the sphingolipids (indicated by a broken arrow). The values represent mean ± SEM, n = 3 from independent experiments.
2
2
Microscopic images of GalCer and GalSph self-assemblies in vitro. (a) Congo red birefringence of (i) GalCer and (ii) GalSph fibrils after staining with the Congo red dye under a polarization microscope. Enlarged views of the images shown as emerging from (i) and (ii) are the cropped areas and are color-corrected for better visualization of CR birefringence. (b) Confocal microscopic imaging of (i) ThS control, (ii) GalCer, and (iii) GalSph upon staining with ThS dye. Control contained ThS + PBS only.
3
3
Transmission electron microscopy (TEM) imaging of GalCer and GalSph fibrils. (a) The TEM micrographs show morphology of GalCer fibrils in (i,ii) PBS pH 7.4, (iii,iv) AB pH 4.5, and (v,vi) DDW pH 6.0. (b) GalSph fibrils in (i,ii) PBS pH 7.4, (iii,iv) AB pH 4.5, and (v,vi) DDW pH 6.0. (c) Average diameter of GalCer (i) and GalSph (iii) and the average pitch of GalCer (ii) were calculated from TEM images using ImageJ. Calculations are based on 230 and 110 different regions of the fibrils of GalCer and GalSph, respectively.
4
4
Structural parameters of the sphingolipid fibrils. FTIR spectra of the monomers of GalCer (a) and GalSph (c) and of fibrils of GalCer (b) and GalSph (d). PXRD of the fibrils of GalCer (e) and of GalSph (f). SAXS pattern of the fibrils of GalCer (g) and of GalSph (h).
5
5
Raman microspectroscopy of monomeric and fibrillar GalCer and GalSph. The spectra are normalized to the intensity at 1438 cm–1 for GalCer and at 1445 cm–1 for GalSph, highlighted in blue and red semitransparent rectangles, respectively. The figure shows the dependence of the Raman signal for fibrillar forms oriented at 0° and 90°. The average spectrum is the mean of the Raman signal polarization at the extreme angles of 0° and 90°. Differential spectra refer to the subtraction of the signals at two limiting angles, 90° and 0°, and a comparison of the monomeric and fibrillar forms oriented at 0° (diff. monomer–fibril 0°). The intensity scale of CH vibrations at high wavenumbers has been reduced by factors of 2×, 4×, or 6×, proportionally to the rest of the spectra.
6
6
Cytotoxicity of GalCer and GalSph fibrils toward SH-SY5Y and DDR1 oligodendrocyte cells. Cells were treated with GalCer (a,b) and GalSph (c,d) fibrils for 24 h and cell viability was measured by MTT assay. Untreated control reflects the medium without GalCer or GalSph fibrils. A culture medium with 1% DMSO was used as a vehicle control. The data are represented as percentage cell viability. Each bar represented as mean ± SEM, n = 6. Statistical significance was analyzed using one-way ANOVA followed by the Tukey multiple comparison posthoc test, *p < 0.05, **p < 0.01, ***p < 0.001 vs untreated control.
7
7
Flow cytometric analysis of apoptotic activity in SH-SY5Y cells using the Annexin V-FITC/PI assay. Cells were treated with GalCer fibrils (100 μM and 200 μM) and GalSph fibrils (10 μM–50 μM) for 24 h at 37 °C. After incubation, annexin V-FITC and PI were added, and apoptosis was assessed by flow cytometry using a single laser emitting excitation light at 488 nm. The scatter plots represent apoptosis analysis in (a) untreated control, (b) 1% DMSO vehicle control, (c,d) GalCer-treated cells, and (e–g) GalSph fibril-treated cells. The quadrants indicate the following: Q1PI (+) (necrotic cells), Q2Annexin V-FITC (+) PI (+) (late apoptotic cells), Q3Annexin V-FITC (+) PI (−) (early apoptotic cells), and Q4Annexin V-FITC (−) PI (−) (live cells). (h) The bar graph shows the percentage of early and late apoptotic cells in GalCer- and GalSph-treated conditions. Data are presented as mean ± SEM, n = 3. Statistical significance was analyzed using one-way ANOVA followed by Tukey’s multiple comparison posthoc test, ***p < 0.001 vs untreated control.
8
8
Flow cytometric analysis of mitochondrial membrane potential in SH-SY5Y cells using JC-1 dye. Flow cytometry analysis of loss of MMP was monitored by JC-1 dye. Cells were treated with GalCer and GalSph fibrils for 24 h, as described in the apoptosis assay. The scatter plot represents JC-1 red fluorescence (aggregates) versus JC-1 green fluorescence (monomers), indicating mitochondrial membrane potential. A shift toward increased green fluorescence signifies mitochondrial depolarization. The plots correspond to (a) untreated control and (b) cells treated with 100 μM GalCer fibrils, (c) 200 μM GalCer fibrils, (d) 10 μM GalSph fibrils, (e) 25 μM GalSph fibrils, and (f) 50 μM GalSph fibrils. (g) The bar graph represents the quantification of JC-1 monomer-to-aggregate in GalCer- and GalSph-treated cells, expressed as the percentage of cells in each condition. Values are mean ± SEM, n = 3. Statistical significance was analyzed using one-way ANOVA followed by the Tukey multiple comparison posthoc test, **p < 0.01, ***p < 0.001 vs untreated control.
9
9
Effect of sphingolipid fibrils on mitochondrial integrity. (a) Bright-field images of control (i) and GalCer-(ii) and GalSph-(iii) fibrils-treated cells. Images were taken at ×60 magnification, to view cellular morphology; the scale bar corresponds to 50 μM. Morphological changes were observed in SH-SY5Y cells treated with GalCer and GalSph fibrils, as indicated by the yellow arrow. (b) Raman spectra of the cytoplasm of SH-SY5Y cells: control (green line), GalCer fibrils (200 μm) (brown line), and GalSph fibrils (25 μm) (red line) after baseline correction. The numbers above peaks represent peak positions. Scale is 100 arbitrary units. (c–e) Raman ratios of peak intensities of control cells and treated cells. (c) Ratio of peak intensities at 747 cm–1 corresponding to reduced cytochrome c (Fe2+) to the peak at 1004 cm–1 corresponding to phenylalanine in proteins; (d) ratio of peak intensities at 1126 cm–1 corresponding to reduced cytochrome b (Fe2+) to the protein peak; (e) ratios of peaks from cytochromes c and b. **p < 0.01, *p < 0.05, nsnot significant by the ANOVA test.
10
10
Mitigation of GalCer aggregation by small molecule inhibitors. (a) The normalized ThS fluorescence intensities of GalCer incubated with (i) EGCG, (ii) NQTrp, and (iii) Cl-NQTrp at different molar ratios (10:1, 5:1, and 1:1) show concentration-dependent inhibition of the amyloid-like fibril formation by the inhibitors. The statistical analysis was performed by a Student’s t-test to compare untreated control with the inhibitors-treated samples. The asterisks denote statistically significant results (*p < 0.05, **p < 0.01, ***p < 0.001). The data is represented as mean ± SEM (n = 3). (b) TEM images of GalCer aggregates in the absence (i) or presence of a 1-fold molar ratio of the inhibitors (ii) EGCG, (iii) NQTrp, and (iv) Cl-NQTrp.
11
11
Mitigation of GalSph aggregation by small molecule inhibitors. (a) The normalized ThS fluorescence intensities of GalSph incubated with (i) EGCG, (ii) NQTrp, and (iii) Cl-NQTrp at different molar ratios (10:1, 5:1, and 1:1) show concentration-dependent inhibition of the amyloid-like fibril formation by the inhibitors. The statistical analysis was performed by a Student’s t-test to compare untreated control with the inhibitors-treated samples. The asterisks denote statistically significant results (*p < 0.05, **p < 0.01, ***p < 0.001). The data is represented as mean ± SEM (n = 3). (b) TEM images of GalSph aggregates in the absence (i) or presence of a 1-fold molar ratio of the inhibitors (ii) EGCG, (iii) NQTrp, and (iv) Cl-NQTrp.
12
12
Effect of NQTrp on mitigation of endogenous GalCer accumulation in SH-SY5Y cells treated with the GALC inhibitor. Cells were treated with AGF for 5 days and then incubated with different molar ratios of NQTrp. GalCer accumulation in SH-SY5Y cells was detected using a GalCer-specific antibody. Red puncta inside the cells indicate accumulation of GalCer in (a) untreated control, (b) NQTrp-treated, and (c–h) GALC inhibitor-treated cells in the absence (c) or presence (d–h) of NQTrp at various molar ratios. (i) ImageJ quantification of GalCer puncta in SH-SY5Y cells. Values are represented as mean ± SEM (n = 6). The data were analyzed using one-way ANOVA followed by the Tukey multiple comparison posthoc test. The asterisks denote statistically significant results (**p < 0.01, ***p < 0.001).
13
13
Effect of NQTrp on GalCer and GalSph fibrils-induced cytotoxicity in SH-SY5Y cells. Cells were exposed to (a) GalCer and (b) GalSph fibrils without or with different molar ratios (5:1, 2:1, 1:1, 1:2, and 1:5) of NQTrp for 24 h, and cell viability was measured by MTT assay. Values are represented as mean ± SEM (n = 6). Significance was analyzed using one-way ANOVA followed by the Tukey multiple comparison test, *p < 0.05, **p < 0.01, ***p < 0.001.
14
14
Effect of NQTrp on GalSph fibrils-induced cellular apoptosis in SH-SY5Y cells. Flow cytometry analysis of cell death in annexin V- and PI-stained cells showing the percentage of necrotic, late apoptotic, early apoptotic, and viable cell populations in SH-SY5Y cells. Cells were exposed to GalSph fibrils without (c) or with different molar ratios (5:1, 2:1, 1:1, and 1:2; (d), (e), (f), and (g), respectively) of NQTrp for 24 h. Untreated (a) and NQTrp only (b)-treated cells serve as controls. (h) Bar plot showing quantification of GalSph fibrils-induced apoptotic events in cells treated with or without NQTrp. Values are represented as mean ± SEM, n = 6. Significance was analyzed using one-way ANOVA followed by the Tukey multiple comparison test, *p < 0.05, **p < 0.01, ***p < 0.001.
15
15
Effect of NQTrp on GalSph fibrils-induced loss of MMP in SH-SY5Y cells. Cells were exposed to GalSph fibrils without (c) or with different molar ratios (5:1, 2:1, 1:1, and 1:2; (d), (e), (f), and (g), respectively) of NQTrp for 24 h. Untreated (a) and NQTrp only (b)-treated cells serve as controls. The scatter plot represents JC-1 red fluorescence (aggregates) versus JC-1 green fluorescence (monomers), indicating mitochondrial membrane potential. A shift toward increased green fluorescence signifies mitochondrial depolarization. The plot shows JC-1 red versus JC-1 green emission from flow cytometry on mitochondrial membrane potential. Increased green fluorescence (cells shift toward the green channel) indicates depolarized mitochondria. (h) The bar graph represents the quantification of JC-1 monomer-to-aggregate in GalCer- and GalSph-treated cells with or without NQTrp incubation, expressed as the percentage of cells in each condition. Values are mean ± SEM, n = 3. Statistical significance was analyzed using one-way ANOVA followed by the Tukey multiple comparison posthoc test, **p < 0.01, ***p < 0.001 vs untreated control.
16
16
A schematic diagram representing a possible mechanism of sphingolipid fibril formation.

Similar articles

References

    1. Mistry P. K., Kishnani P., Wanner C., Dong D., Bender J., Batista J. L., Foster J.. Rare Lysosomal Disease Registries: Lessons Learned over Three Decades of Real-World Evidence. Orphanet J. Rare Dis. 2022;17(1):362. doi: 10.1186/s13023-022-02517-0. - DOI - PMC - PubMed
    1. Massaro G., Geard A. F., Liu W., Coombe-tennant O., Waddington S. N., Baruteau J., Gissen P., Rahim A. A.. Gene Therapy for Lysosomal Storage Disorders: Ongoing Studies and Clinical Development. Biomolecules. 2021;11:611. doi: 10.3390/biom11040611. - DOI - PMC - PubMed
    1. Ceravolo G., Zhelcheska K., Squadrito V., Pellerin D., Gitto E., Hartley L., Houlden H.. Update on Leukodystrophies and Developing Trials. J. Neurol. 2024;271(1):593–605. doi: 10.1007/s00415-023-11996-5. - DOI - PMC - PubMed
    1. Maghazachi A. A.. Globoid Cell Leukodystrophy (Krabbe Disease): An Update. Immunotargets Ther. 2023;12:105–111. doi: 10.2147/ITT.S424622. - DOI - PMC - PubMed
    1. Abed Rabbo M., Khodour Y., Kaguni L. S., Stiban J.. Sphingolipid Lysosomal Storage Diseases: From Bench to Bedside. Lipids Health Dis. 2021;20(1):44. doi: 10.1186/s12944-021-01466-0. - DOI - PMC - PubMed

MeSH terms