. 2025 Jul 2;16(1):483.
doi: 10.1038/s41419-025-07773-z.

AKR1C3 enhances radioresistance in esophageal adenocarcinoma via inhibiting ferroptosis through suppressing TRIM21-mediated ubiquitination of HSPA5

Affiliations

AKR1C3 enhances radioresistance in esophageal adenocarcinoma via inhibiting ferroptosis through suppressing TRIM21-mediated ubiquitination of HSPA5

Feng Ju et al. Cell Death Dis. .

Abstract

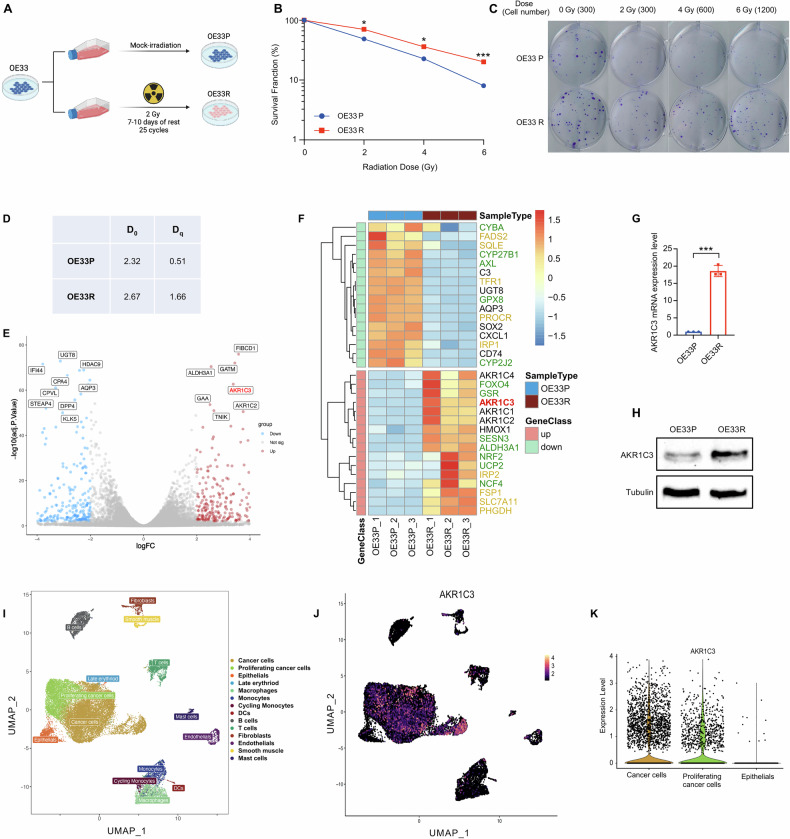
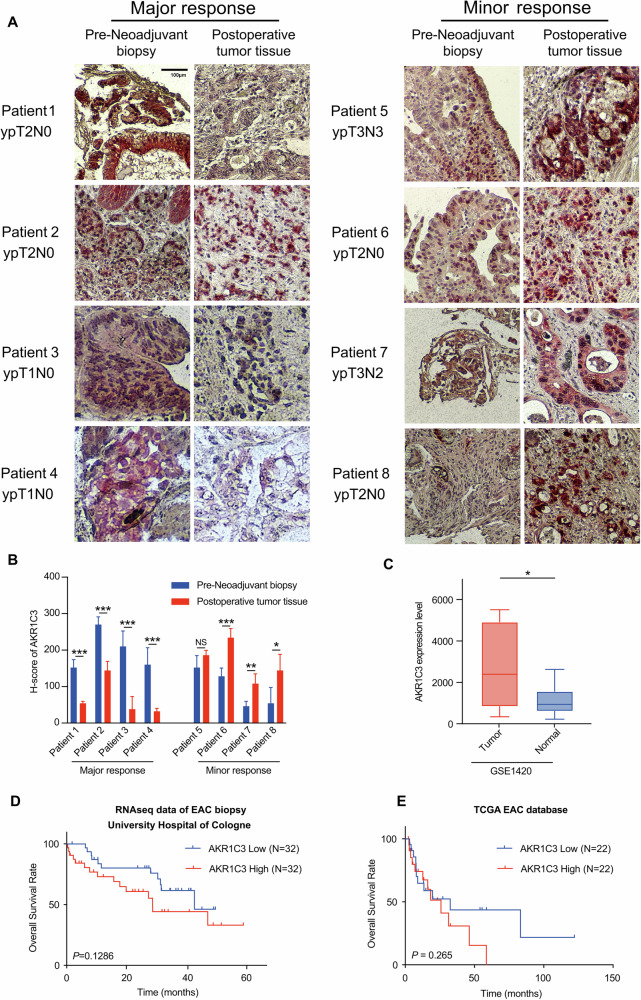
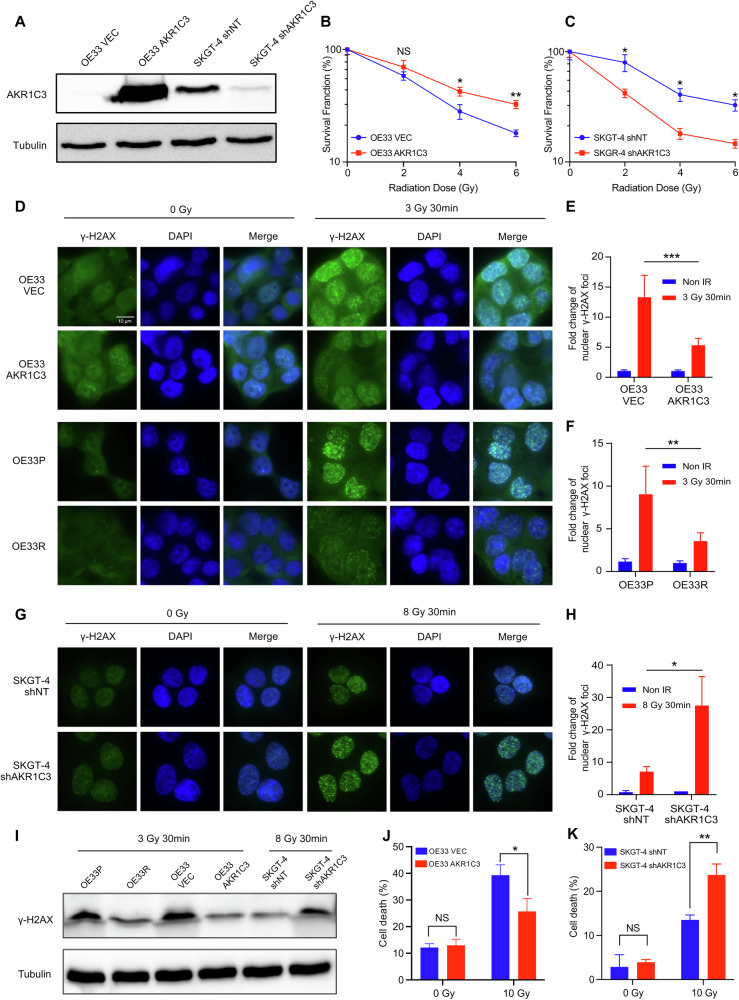
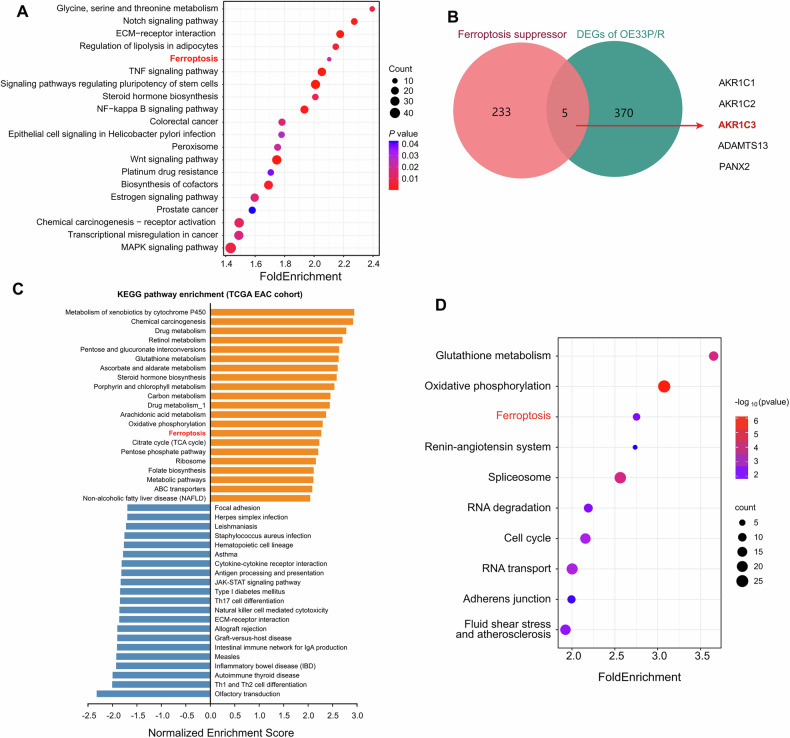
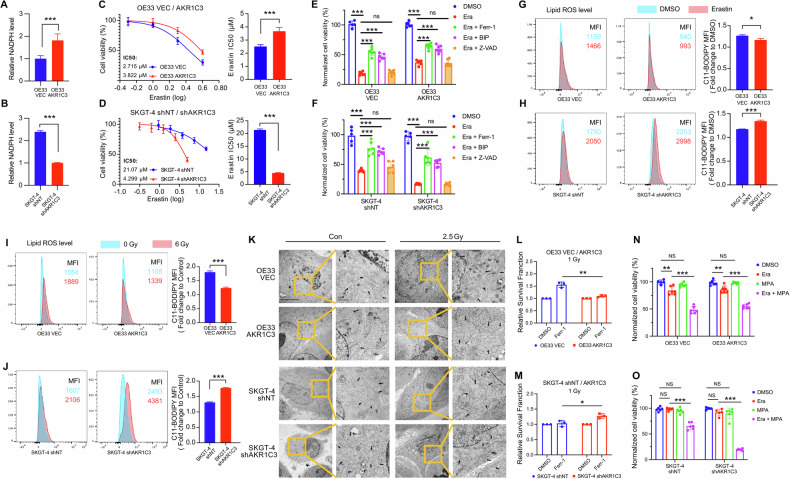
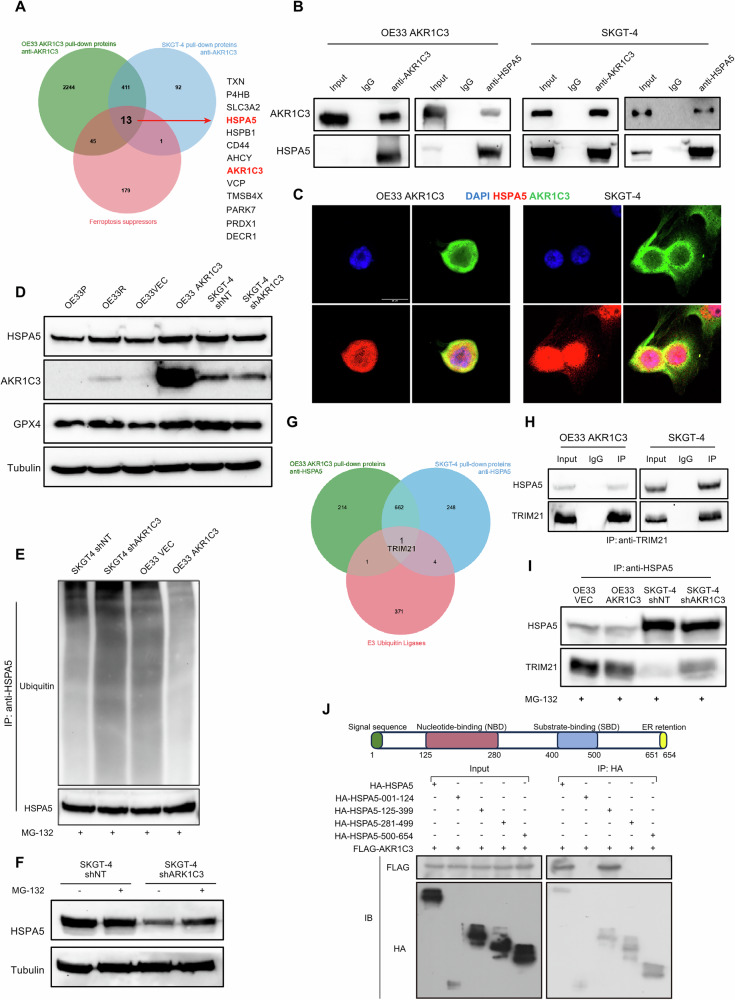
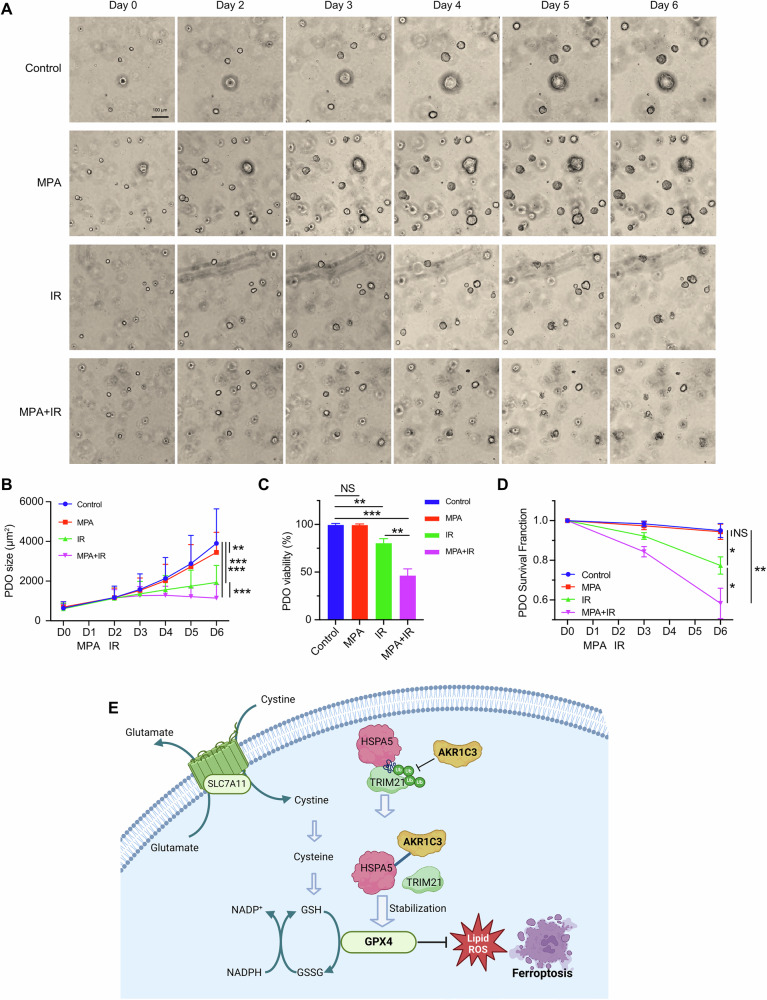
Esophageal adenocarcinoma (EAC) is the predominant subtype of esophageal cancer (EC) in high-income countries, and radioresistance is one of the key factors for the poor prognosis. In this study, we successfully established a radioresistant EAC in vitro model. Aldo-keto reductase 1C3 (AKR1C3) was identified as a promising regulator of radioresistance by RNA-seq analysis and subsequent functional studies. Through integrated analyses of scRNA-seq and TCGA datasets, we found that AKR1C3 was likely to enhance radioresistance by inhibition of ferroptosis. Indeed, analysis of the lipid ROS level by C11-Bodipy staining and the result of transmission electron microscopy revealed that AKR1C3 could prevent EAC cells from ferroptosis. Mechanistically, AKR1C3 binds to the nucleotide-binding domain of HSPA5, thereby inhibiting the E3 ligase TRIM21-induced ubiquitin-dependent proteasomal degradation of HSPA5, which further stabilizes GPX4, thus inhibiting ferroptosis. Importantly, AKR1C3 inhibitor resensitized the EAC patient-derived organoids to radiotherapy. In conclusion, this study highlights AKR1C3 as a regulator of radioresistance and a potential therapeutic target in EAC.


Conflict of interest statement

Competing interests: The authors declare no competing interests. Ethics: All methods were performed in accordance with the relevant guidelines and regulations. This study was approved by the Institutional Ethics Committee of the University Hospital of Cologne (ID: 13-091 and ID:18-274).

Figures

Fig. 1
Fig. 1. Establishment and validation of the radioresistant EAC cell line model.
A Schematic diagram of the radioresistant model establishment. B, C Colony formation assay was performed to validate the survival curves of OE33P and OE33R. D The single-hit multi-target model was applied to this model. D0 and Dq values were calculated. D0 is the “mean lethal dose”, the dose on the straight-line portion of the survival curve to decrease the survival to 37%. Dq is the quasi-threshold dose, is the width of the “shoulder,” and correlates with repair capacity. E The volcano map exhibited the differentially expressed genes between OE33P and OE33R by the result of RNA-seq data. |logFC| > 2, log10 (adj.P.Value) > 2. F The major differentially expressed genes were listed in the heatmap. Marked in green: redox-related genes, marked in yellow: ferroptosis-related genes. G AKR1C3 mRNA relative expression level in OE33P and OE33R was measured by qRT-PCR analysis. H AKR1C3 protein expression level in OE33P and OE33R was validated by Western blot. Means ± SD, N = 3. I, J UMAP presented the different clusters with annotations and AKR1C3 expression in different cell types. K Violin plot showed the AKR1C3 expression level in cancer cells, proliferating cancer cells, and normal epithelial cells. Statistical comparisons were made using a paired two-tailed Student’s t-test; *P < 0.05, **P < 0.01, ***P < 0.001.
Fig. 2
Fig. 2. AKR1C3 affects therapeutic response and prognosis of EAC patients.
A AKR1C3 expression levels of eight paired samples were assessed by IHC staining, all of which were diagnosed as EAC at Department of Pathology, University Hospital of Cologne. B The H-score of AKR1C3 was calculated as Intensity(0–3) × Area (0–100%), with five sights recorded for each sample. C Data from the GSE1420 dataset showed AKR1C3 expression level is higher in esophageal cancer tissues compared to the matched normal tissues. D, E Kaplan–Meier survival curves displayed the differences in overall survival rate between the AKR1C3 high (highest 25% patients) and low (lowest 25% patients) expression groups in the cohorts from University Hospital of Cologne (D) and TCGA (E). Statistical comparisons were made using a paired two-tailed Student’s t-test; *P < 0.05, **P < 0.01, ***P < 0.001.
Fig. 3
Fig. 3. AKR1C3 could enhance the radioresistance in EAC cells.
A Validation of AKR1C3 overexpression in OE33 and AKR1C3 knockdown in SKGT-4 was performed by western blot. B, C Survival fraction after 0–6 Gy irradiation in OE33 VEC/OE33 AKR1C3 and SKGT-4 shNT/SKGT-4 shAKR1C3. Cells were treated with irradiation: 3 Gy for OE33 (D) and 8 Gy for SKGT-4 (G). The fold change of the nuclear γ-H2AX foci was presented in the bar charts (E, F, H). I Validation of γ-H2AX protein levels in OE33P/R, OE33 VEC/AKR1C3, and SKGT-4 shNT/shAKR1C3 was performed by western blot. Cells were treated with irradiation: 3 Gy for OE33 and 8 Gy for SKGT-4. J, K Cells were treated with 0 or 10 Gy irradiation. Flow cytometry was performed 72 h after treatment. Bar charts showed the percentage of dead cells before or after irradiation in OE33 VEC/AKR1C3 and SKGT-4 shNT/shAKR1C3 by Annexin V and DAPI staining. Means ± SD, N = 3. Statistical comparisons were made using a paired two-tailed Student’s t-test; *P < 0.05, **P < 0.01, ***P < 0.001.
Fig. 4
Fig. 4. AKR1C3 is associated with ferroptosis.
A KEGG pathways ranked by fold enrichment were analyzed based on the DEGs of OE33P/OE33R. B Venn diagram analysis illustrated the five genes overlapped between 238 ferroptosis suppressors and 375 DEGs of OE33P/R. C KEGG pathways ranked by fold enrichment were analyzed based on the DEGs of the AKR1C3 high/low group from the TCGA EAC cohort. D KEGG pathways ranked by fold enrichment were analyzed based on the DEGs of the AKR1C3 high/low group from scRNA-seq.
Fig. 5
Fig. 5. AKR1C3 regulates redox homeostasis and inhibits ferroptosis in EAC cells.
A, B The luminescence of NADPH was measured by the luminometer 30 min after incubation with NADPH-Glo™ Detection Reagent. C, D OE33 VEC/AKR1C3 and SKGT-4 shNT/shAKR1C3 cells were treated with 0.5–4 µM and 1.25–20 µM erastin, respectively for 72 h. The relative cell viability was measured by the MTT assay. E, F OE33 VEC/AKR1C3 and SKGT-4 shNT/shAKR1C3 cells were treated with erastin (3 µM and 8 µM, respectively) for 72 h, with 10 µM Ferr-1 for 72 h, with 50 µM BIP for 72 h, or with Z-VAD-FMK 5 µM for 72 h. The relative cell viability was measured by the MTT assay. Data was normalized with the DMSO groups. G, H Lipid peroxidation level was detected by C11-Bodipy staining on flow cytometry. The concentration of C11-Bodipy for staining was 1 µM. OE33 and SKGT-4 cells were treated with 1 µM and 2 µM erastin for 48 h, respectively. Bar graphs showing erastin-induced relative fold change of lipid peroxidation levels. I, J OE33 VEC/AKR1C3 and SKGT-4 shNT/shAKR1C3 cells were treated with 6 Gy. After 48 h, lipid peroxidation level was detected by C11-Bodipy staining on flow cytometry. The concentration of C11-Bodipy for staining was 1 µM. Bar graphs showing irradiation-induced relative fold change of lipid peroxidation levels. K TEM images of OE33 VEC/AKR1C3 and SKGT-4 shNT/shAKR1C3 before and after radiotherapy (2.5 Gy, fixation after 24 h). Black arrow: mitochondria. A minimum of five cells in each group were examined. L, M 500 cells were seeded in the 6-well plated, 1 Gy irradiation on the second day, the concentration of Ferr-1 was 0.3 µM. Cells were fixed and counted after 7–12 days. Data was normalized with the DMSO groups. N, O OE33 VEC/AKR1C3 and SKGT-4 shNT/shAKR1C3 cells were treated with 1.5 µM erastin, 10 µM MPA, and combined use of erastin/MPA for 48 h. The relative cell viability was measured by the MTT assay. Data was normalized with the DMSO groups. Mean ± SD, N = 3. *P < 0.05, **P < 0.01, ***P < 0.001.
Fig. 6
Fig. 6. AKR1C3 inhibits ferroptosis by suppressing TRIM21-mediated ubiquitination of HSPA5.
A Proteomic analysis was conducted on the immunoprecipitated products from anti-AKR1C3 co-IPs of OE33 AKR1C3 and SKGT-4. Venn diagram exhibited the integration of proteomic results with 234 ferroptosis suppressors. Totally 13 enriched genes were listed. B Co-IP assay results presented the interactions between AKR1C3 and HSPA5 in EAC cells. C Immunofluorescence assay results showed the co-localization of AKR1C3 with HSPA5 in EAC cells. D Western blot results exhibited the protein expression of HSPA5, AKR1C3, and GPX4 in different EAC cell lines. E Western blot results exhibited ubiquitin level of HSPA5 in different EAC cell lines. F Western blot results showed the protein level of HSPA5 with or without MG-132 treatment in SKGT-4 shNT/shAKR1C3 cell lines. G Proteomic analysis was conducted on the immunoprecipitated products from anti-HSPA5 co-IPs of OE33 AKR1C3 and SKGT-4. Venn diagram exhibited the integration of proteomic results with 377 E3 ubiquitin ligases. TRIM21 was enriched. H Co-IP assay results presented the interactions between TRIM21 and HSPA5 in EAC cells. I Co-IP assay results presented the different strengths of interactions between TRIM21 and HSPA5 in EAC cells. J Analyses of HSPA5 binding domains with AKR1C3. Four truncated forms of HA-HSPA5 were individually co-transfected with Flag-tagged AKR1C3 into HEK293T cells, and co-IP was performed with the anti-HA antibody.
Fig. 7
Fig. 7. Inhibition of AKR1C3 resensitizes EAC PDOs to radiotherapy.
A Triplicates of single-cell digested PDOs were seeded in 48-well plates. Images showed the morphological changes from D0 to D6 but not D1. B PDOs size presented the growth process from D0 to D6. Size was measured by ECHO Pro application. C PDOs viability was measured by MTT assay on the last day. D PDOs survival data were recorded under the microscope on D3 and the last day. Mean ± SD, N = 3. * P < 0.05, ** P < 0.01, *** P < 0.001. E Schematic diagram illustrating the mechanism of AKR1C3 inhibiting ferroptosis in EAC cells. Briefly, AKR1C3, upregulated in the radioresistant EAC cells, binds to HSPA5 and reduced the interaction between TRIM21 and HSPA5, thereby prevents HSPA5 degradation from TRIM21-induced ubiquitination. HSPA5 could futher stabilize GPX4, subsequently suppressing ferroptosis.

Similar articles

References

    1. Bray F, Laversanne M, Sung H, Ferlay J, Siegel RL, Soerjomataram I, et al. Global cancer statistics 2022: GLOBOCAN estimates of incidence and mortality worldwide for 36 cancers in 185 countries. CA Cancer J Clin. 2024;74:229–63. - PubMed
    1. Joseph A, Raja S, Kamath S, Jang S, Allende D, McNamara M, et al. Esophageal adenocarcinoma: a dire need for early detection and treatment. Cleve Clin J Med. 2022;89:269–79. - PubMed
    1. Shapiro J, van Lanschot JJB, Hulshof M, van Hagen P, van Berge Henegouwen MI, Wijnhoven BPL, et al. Neoadjuvant chemoradiotherapy plus surgery versus surgery alone for oesophageal or junctional cancer (CROSS): long-term results of a randomised controlled trial. Lancet Oncol. 2015;16:1090–8. - PubMed
    1. van Laarhoven H, Verhoeven R, van Berge Henegouwen M, Mohammad NH, van Hillegersberg R, Slingerland M, et al. Real-world outcomes of the CROSS regimen in patients with resectable esophageal or gastro-esophageal junction adenocarcinoma: a nationwide cohort study in the Netherlands. EClinicalMedicine. 2025;80:103067. - PMC - PubMed
    1. Lagergren J, Lagergren P. Recent developments in esophageal adenocarcinoma. CA Cancer J Clin. 2013;63:232–48. - PubMed

MeSH terms

Substances

Supplementary concepts