. 2025 Jul 2;15(1):23397.
doi: 10.1038/s41598-025-04245-4.

Detection of caffeic acid in honey using carbon paste electrode modified by copper (II) oxide (CuO) nanoparticles

Affiliations

Detection of caffeic acid in honey using carbon paste electrode modified by copper (II) oxide (CuO) nanoparticles

Marzieh Ghorbani Galugerdi et al. Sci Rep. .

Abstract

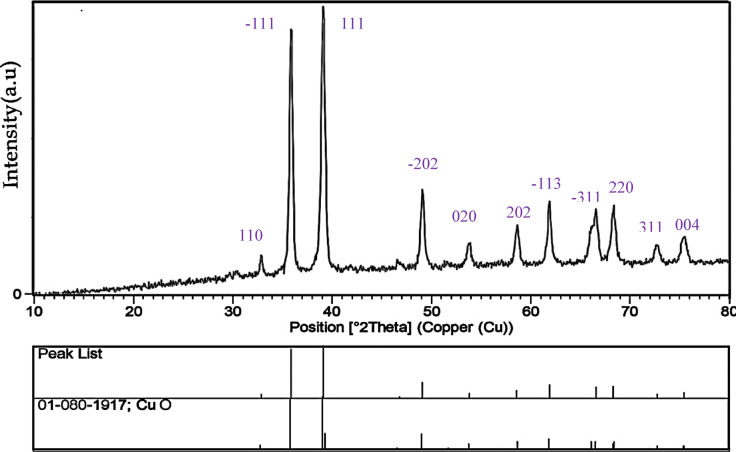
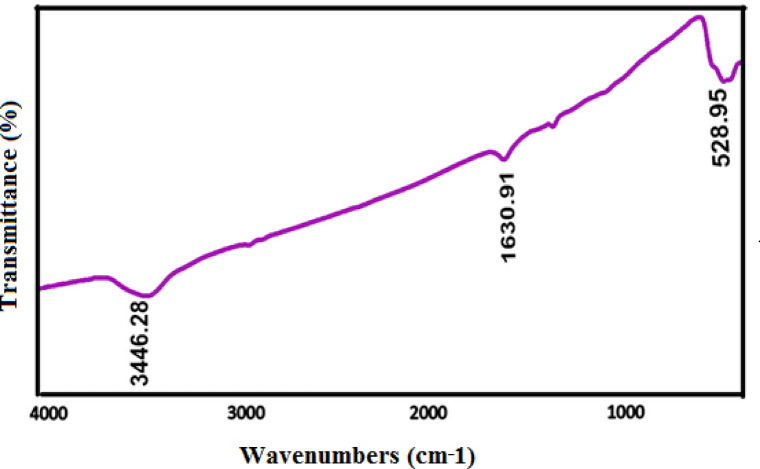
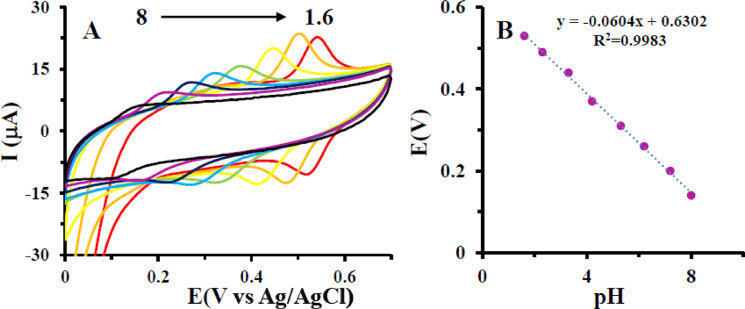
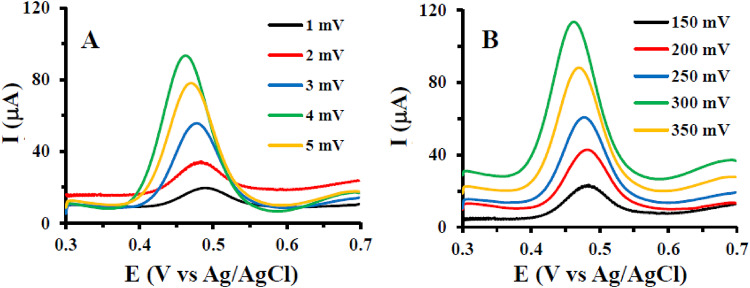
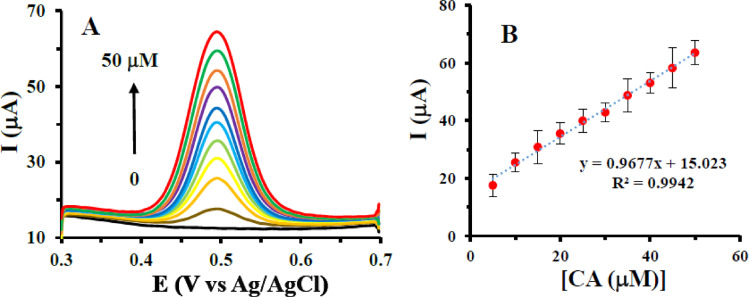
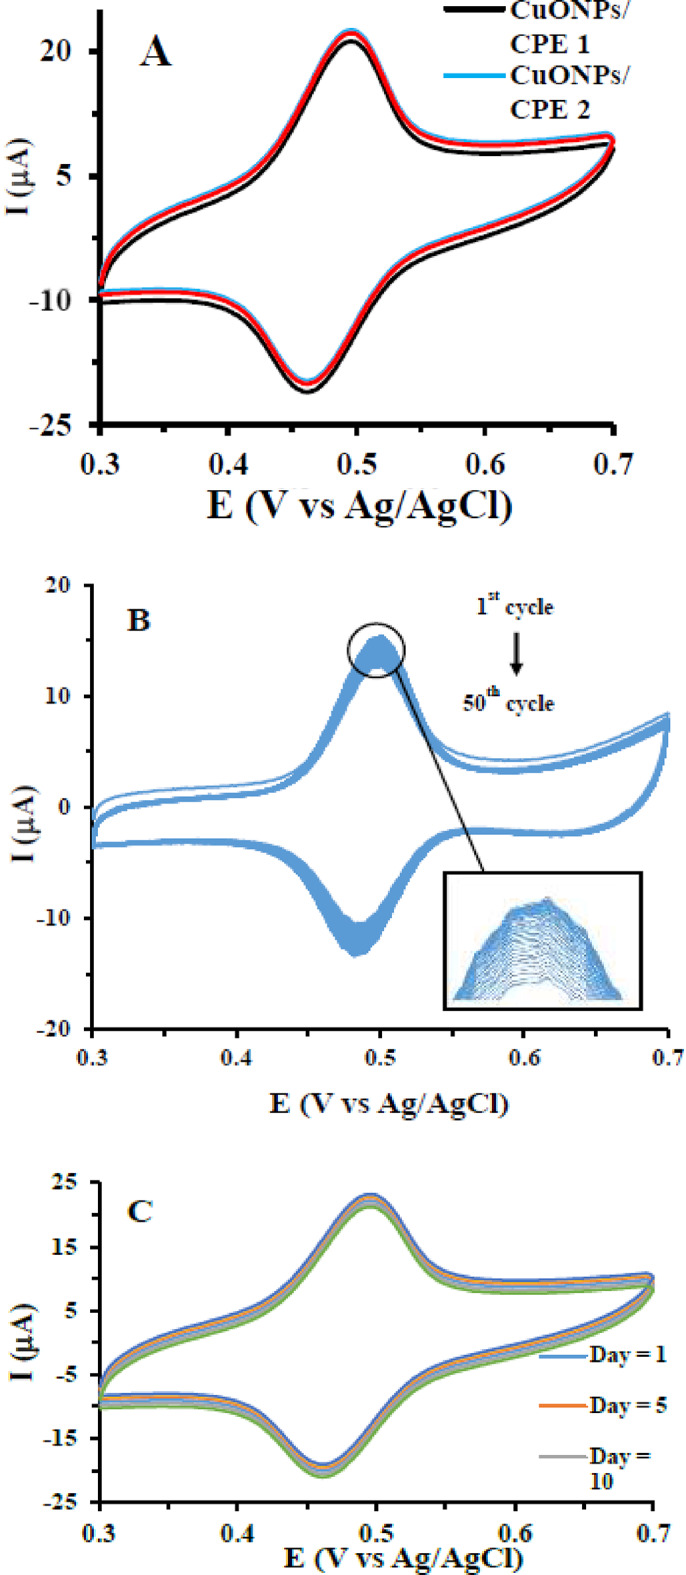
Identification of caffeic acid (CA) in food such as honey is of interest as it has antioxidant, antibacterial, anti-inflammatory, anti-fungal, etc. properties. Accordingly it is necessary to provide a simple, fast, sensitive and low-cost method for CA determination. Here, the carbon paste electrode surface was modified with CuO nanoparticles to obtain CuONPs/CPE as an electrochemical sensor for CA. The CuONPs were synthesized via sol-gel method and characterized using field emission scanning electron microscopy (FE-SEM), energy dispersive X-ray (EDX), X-ray diffraction (XRD) and fourier-transform infrared spectroscopy (FT-IR). Electrochemical behavior of CA at the CPE and CuONPs/CPE surfaces was studied using cyclic voltammetry (CV) technique in phosphate buffered saline (PBS; 0.1 M, pH 2.3). The oxidation and reduction peaks of CA were observed at 0.49 (EPa) and 0.47 (EPc) V (vs. Ag/AgCl, 3.0 M KCl). Differential pulse voltammetry (DPV) was employed to measure CA, which showed a linear response range from 5.0 to 50.0 µM, with a limit of detection (LOD) and a limit of quantification (LOQ) as 3.21 and 10.7 µM, respectively. In real samples of Thyme and Astragalus honeys, CA was measured at 4.96 and 2.89 mg per g of honey, respectively. In order to comparison, the CA in Astragalus honey was determined with HPLC technique. The fabricated electrochemical sensor (CuONPs/CPE), with the ability to directly detect CA in honey samples, simplicity, rapid response, and cost-effectiveness, can be a suitable candidate for CA identification in food and beverage products.

Keywords: Caffeic acid; Carbon paste; Copper (II) oxide nanoparticles; Honey; Voltammetry.


Conflict of interest statement

Declarations. Competing interests: The authors declare no competing interests.

Figures

Fig. 1
Fig. 1
XRD diagram of synthesized CuONPs.
Fig. 2
Fig. 2
SEM images of the synthesized CuONPs with different magnification: (A) 50 kx and (B) 100 kx, (C) EDX pattern of synthesized CuONPs in the presence of citric acid at 400 °C.
Fig. 3
Fig. 3
FT-IR spectrum related to synthesized CuONPs.
Fig. 4
Fig. 4
(A) Nyquist curves of CPE and CuONPs/CPE (The inset shows the Randles equivalent circuit to fit the experimental EIS data) and (B) CV voltammograms of CPE and CuONPs/CPE in 0.1 M KCl solution containing 5 mM [Fe(CN)6]3−/4−.
Fig. 5
Fig. 5
CV voltammograms of CPE and CuONPs/CPE in PBS (0.1 M, pH 2.3), in the absence and presence of CA (50.0 µM) at the potential scan rate of 0.1 Vs− 1.
Fig. 6
Fig. 6
Oxidation and reduction reactions of CA.
Fig. 7
Fig. 7
(A) CV voltammograms of CuONPs/CPE in 0.1 M PBS with different pH values (1.6, 2.3, 3.3, 4.2, 5.3, 6.2, 7.2 and 8.0) in the presence of 50.0 µM CA at potential scan rate of 0.1 Vs−1 and (B) Plot of anodic peak potential versus pH.
Fig. 8
Fig. 8
(A) CV voltammograms of CuONPs/CPE in PBS (0.1 M, pH 2.3), in the presence of 50.0 µM CA at different potential scan rates of 0.01, 0.04, 0.08, 0.1, 0.15, 0.2, 0.25 and 0.35 Vs−1 and (B) Plots of the anodic and cathodic peaks current versus potential scan rate.
Fig. 9
Fig. 9
(A) DPV voltammograms of CuONPs/CPE, in PBS (0.1 M, pH 2.3) containing 50.0 µM CA at step potentials of 1.0, 2.0, 3.0, 4.0 and 5.0 mV, and (B) Pulse amplitude of 150.0, 200.0, 250.0, 300.0 and 350.0 mV.
Fig. 10
Fig. 10
(A) DPV voltammograms of CuONPs/CPE in PBS (0.1 M, pH 2.3), in the presence of different concentration of CA (0.0, 5.0, 10.0, 15.0, 20.0, 25.0, 30.0, 35.0, 40.0, 45.0 and 50.0 µM) at potential scan rates of 0.1 Vs− 1 and (B) Calibration curve of anodic peak current versus the CA concentration.
Fig. 11
Fig. 11
Amperogram of CuONPs/CPE from successive addition of 50 µL CA (1.5 mM) and each interfering species (3.0 mM; CiA, BA, MA, AA, Glc and KCl) in 3.0 ml of PBS (0.1 M, pH 2.3), at applied potential of 0.5 V.
Fig. 12
Fig. 12
(A) CV voltammograms of three different CuONPs/CPE electrodes, (B) CV voltammograms of CuONPs/CPE through recorded of 50 cycles and (C) CV voltammograms of CuONPs/CPE were recorded over 25 days, in PBS (0.1 M, pH 2.3) containing of 50.0 µM CA at potential scan rate of 0.1 Vs− 1.
Fig. 13
Fig. 13
DPV voltammograms of CuONPs/CPE in PBS (0.1 M, pH 2.3) containing 1.0 g of honey samples, in the absence and presence of different concentration of CA (15.0, 25.0 and 50.0 µM) at potential scan rates of 0.1 Vs− 1; (A) Thyme honey and (B) Astragalus honey.
Fig. 14
Fig. 14
The standard addition curves for measuring CA in solution of Thyme (A) and Astragalus (B).
Fig. 15
Fig. 15
Retention time (RT) diagram of different substances in Astragalus honey sample.

References

    1. Leyva-Jimenez, F. J., Lozano-Sanchez, J., Borras-Linares, I., Cadiz-Gurrea, M. L. & Mahmoodi-Khaledi, E. Potential antimicrobial activity of honey phenolic compounds against gram positive and gram negative bacteria. LWT101, 236–245 (2019).
    1. Baroni, M. V., Chiabrando, G. A., Costa, C. & Wunderlin, D. A. Assessment of the floral origin of honey by SDS-page Immunoblot techniques. J. Agric. Food Chem.50 (6), 1362–1367 (2002). - PubMed
    1. Rossano, R. et al. What are the proteolytic enzymes of honey and what they do tell us? A fingerprint analysis by 2-D zymography of unifloral honeys. PLoS ONE. 7 (11), e49164 (2012). - PMC - PubMed
    1. León-Ruiz, V., Vera, S., González-Porto, A. V., San, M. P. & Andrés Analysis of water-soluble vitamins in honey by isocratic RP-HPLC. Food. Anal. Methods. 6 (2), 488–496 (2013).
    1. Amiot, M. J., Aubert, S., Gonnet, M. & Tacchini, M. Les composés phénoliques des miels: étude préliminaire Sur l’identification et La quantification par familles. Apidologie20 (2), 115–125 (1989).

LinkOut - more resources