. 2025 Jul 2;15(1):23172.
doi: 10.1038/s41598-025-05117-7.

Cell-specific expression biases in human cortex of genes associated with neurodevelopmental disorders

Affiliations

Cell-specific expression biases in human cortex of genes associated with neurodevelopmental disorders

Jeffrey B Russ et al. Sci Rep. .

Erratum in

Abstract

Up to one third of congenital brain malformations and neurodevelopmental disorders are attributable to single-gene pathogenic variants, and yet we have little understanding of the cellular pathophysiology in the nervous system that arises from these variants. To investigate cortical cell type-specific biases in gene expression associated with distinct neurodevelopmental phenotypes, we integrated phenotypic information from two cohorts of subjects with monogenic neurodevelopmental diagnoses with two human cortical single-nucleus RNA-sequencing (snRNAseq) datasets. Phenotype data was gathered from (1) a single-institution cohort of 84 neonates with pathogenic single-gene variants referred to Duke Pediatric Genetics, and (2) a cohort of 4,238 patients with neurodevelopmental disorders and pathogenic single-gene variants enrolled in the Deciphering Developmental Disorders study. Human cortical snRNAseq datasets were obtained from public repositories and included 86 samples from human cortex spanning the 2nd trimester of gestation to adulthood. We identified reproducible cell-specific expression biases for genes in which pathogenic variants are associated with speech/cognitive delay and seizures. Enriched expression of these genes in excitatory neurons or microglia highlights the unique role both cell types play in neurodevelopment. Moreover, this information illuminates distinct cortical cell types that are more likely to be impacted by pathogenic variants and may mediate their symptomatology.

Keywords: Congenital brain malformations; Human cortex; Neurodevelopmental disorders; Seizures; Single nucleus RNA sequencing; Speech and cognitive delay.


Conflict of interest statement

Declarations. Competing interests: The authors declare no competing interests.

Figures

Fig. 1
Fig. 1
Pathogenic variants associated with NDDs show cell-specific expression biases in human cortex. a Analytic pipeline schematic: Patients with pathogenic variants in genes A, B, or C were coded by the presence of NDD phenotype 1 or 2 and grouped into NDD-associated genesets. Human cortical transcriptomic data was analyzed for relative enrichment of each gene in each cortical subtype. Datasets were then merged to provide a relative expression metric for each gene within each cortical cell type and NDD geneset, plotted for all genes associated with the phenotype (red) versus all genes not associated with the phenotype (blue). b UMAP of 348,049 nuclei from Velmeshev et al., 2023 with originally assigned cell type annotations. c Mean relative expression level (top; log2 fold change in expression for given cell type compared to all other cell types) and mean percent expression (bottom; percent of given cell type expressing genes of interest) demonstrate cell-specific expression biases in human cortex. d UMAP of 153,473 nuclei from Herring, et al., 2022 with originally assigned cell type annotations. e Mean relative expression level (top) and mean percent expression (bottom) reproduce many cell-specific expression biases observed in (c). Specifically, genes associated with seizures and speech/cognitive delay demonstrate higher relative expression and higher percent expression in excitatory neurons in both datasets, and genes associated with speech/cognitive delay also demonstrate expression bias in microglia in both datasets (c, e). Red = genes associated with the phenotype; blue = genes not associated with the phenotype. NDD  neurodevelopmental disorder, ExNeu excitatory neurons, IN  inhibitory neurons, GLIALPROG glial progenitors, AST  astrocytes, OPC  oligodendrocyte precursor cells, OL   oligodendrocytes, MG   microglia; VASC endothelial cells/pericytes. Graphs illustrate mean ± s.d. Statistical differences were calculated using a Wilcoxon test with Bonferroni correction for multiple comparisons. * = p < 0.05; ** = p < 0.01; *** = p < 0.001.
Fig. 2
Fig. 2
Likelihood of neurodevelopmental phenotypes by cell-specific gene expression. Genes associated with pathogenic variants were binned as “Low cell-type expression” (light blue) or “High cell-type expression” (red) based on whether they were expressed in fewer or more than 25% of cells of a given cell type, respectively. The probability of subjects presenting with each NDD phenotype was then calculated for genes that have low or high expression in each cortical cell type. Subjects with pathogenic variants in genes that have high excitatory neuron expression are significantly less likely to have a negative phenotype and significantly more likely to have seizures or speech/cognitive delay. Subjects with variants in genes that have high microglial expression are more likely to have speech/cognitive delay, but less likely to have seizures or a negative phenotype. NDD neurodevelopmental disorder, Midline midline defects, MCDs malformations of cortical development, Callosal callosal abnormalities, HydroVent hydrocephalus/ventriculomegaly, Vascular vascular disorders, hemorrhage, or stroke, ASD autism spectrum disorder, ExNeu excitatory neurons, IN inhibitory neurons, GLIALPROG glial progenitors, AST astrocytes, OPC oligodendrocyte precursor cells, OL oligodendrocytes, MG microglia, VASC endothelial cells/pericytes. Graphs illustrate probabilities and do not include a measure of variance. Statistical differences were calculated using a Chi-squared test with Bonferroni correction for multiple comparisons. * = p < 0.05; ** = p < 0.01; *** = p < 0.001.
Fig. 3
Fig. 3
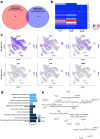
Excitatory neuron-enriched genes associated with speech/cognitive delay with or without seizures. a Excitatory-enriched genes associated with seizures make up a subset of those associated with speech/cognitive delay. b Pathogenic variants were recategorized into four new genesets: “No Speech/Cognitive Delay” (light gray), “Non-Excitatory Speech/Cognitive Delay” (dark gray), “Excitatory Speech/Cognitive Delay without Seizures” (light blue), and “Excitatory Speech/Cognitive Delay with Seizures” (dark blue). c Feature plots of representative genes from each geneset. d Individual excitatory neurons demonstrated increasing aggregate geneset expression (UCell score) with increasing differentiation (pseudotime score) only for excitatory-enriched genes associated with speech/cognitive delay with or without seizures (p < 2 × 10− 15 for all pairwise comparisons, as determined by Kolmogorov-Smirnov testing across all pairs followed by Bonferroni correction for multiple comparisons). ei Excitatory-enriched genes associated with speech/cognitive delay without seizures demonstrated higher relative gene expression in deeper cortical layers, particularly extratelencephalic neurons, whereas those associated with seizures showed higher relative expression in layer 3–5 intratelencephalic neurons (ANOVA effect by geneset p < 2 × 10− 16; ANOVA effect by cortical layer p < 2 × 10− 16; L3/5 IT across genesets p.adj = 0.008; L5 PT across genesets p.adj = 3.5 × 10− 8; L6 CT across genesets p.adj = 1.9 × 10− 6). (eii) Excitatory-enriched genes associated with speech/cognitive delay with or without seizures demonstrated similar distributions of relative gene expression across developmental stages (ANOVA effect by geneset p = 0.07; ANOVA effect by age range p < 2 × 10− 16). Graphs in ei and eii illustrate mean ± s.d. f Hypergeometric testing shows differential enrichment patterns across Herring et al., 2022 “gene trend” categories G1-G14. Non-Excitatory Cognitive/Speech Delay showed highest overlap with category G10 (uncorrected p = 0.004), Excitatory Speech/Cognitive Delay without Seizures showed highest overlap with category G13 (uncorrected p = 0.001), and Excitatory Speech/Cognitive Delay with Seizures showed highest overlap with category G5 (uncorrected p = 0.003). g GO analysis for each geneset demonstrated differential molecular pathway enrichment. Excitatory Speech/Cognitive Delay without Seizures was enriched for terms related to calcium regulation while Excitatory Speech/Cognitive Delay with Seizures was enriched for terms related to neuronal migration and trans-synaptic signaling. “Diff” differentiated neurons; N.S. not significant, IT intratelencephalic neurons, PT pyramidal tract neurons, CT corticothalamic neurons.
Fig. 4
Fig. 4
Expression correlations of excitatory-enriched genes associated with speech/cognitive delay with and without seizures. a 66 genes had biased expression in excitatory neurons and were associated with speech/cognitive delay with (black) or without (red) seizures. Pearson correlation coefficients were calculated between each gene pair. Unbiased clustering of the correlation coefficients demonstrates four major groups of genes with correlated expression patterns that do not cluster by their phenotypic association with seizures (genes in black font are interspersed with genes in red font). Instead, the four subgroups of excitatory-biased genes associated with speech/cognitive delay with or without seizures are correlated in their temporal expression across developmental pseudotime (b) and their molecular ontology (c).
Fig. 5
Fig. 5
Microglia-enriched genes associated with speech/cognitive delay. a Pathogenic variants associated with speech/cognitive delay in genes with a microglial expression bias are largely non-overlapping with those that have an excitatory neuron expression bias (46 genes, 94% of microglia-enriched genes associated with speech/cognitive delay). b, c Microglia-enriched genes associated with speech/cognitive delay could be subdivided into two genesets, “Microglia Broad” and “Microglia Narrow,” depending on whether genes were expressed in greater or less than 5% of all other non-microglia. Hypergeometric testing of microglial genesets with “gene trends” G1-G14, as defined in Herring et al., 2022 (Supplementary Table 5), demonstrated that Microglia Broad genes were significantly enriched for gene trend G10 (adjusted pval = 0.03), while Microglia Narrow genes did not show significant enrichment after correction for multiple comparisons but were most enriched for gene trend G1 (uncorrected pval = 0.02, corrected pval = 0.97; b). Feature plots (c) showing the expression of representative genes from Microglia Broad and Microglia Narrow genesets mapped to the UMAP of data from Velmeshev et al., 2023 (as shown in Fig. 1a). d, e Gene Ontology analysis of the 49 microglia-enriched genes associated with speech/cognitive delay reveals molecular pathways related to chromosome segregation during mitosis and transforming growth factor beta (TGFβ) signaling.

References

    1. Nomura, M. L. et al. Congenital hydrocephalus: gestational and neonatal outcomes. Arch. Gynecol. Obstet.282, 607–611. 10.1007/s00404-009-1254-2 (2010). - PubMed
    1. Van den Veyver, I. B. Prenatally diagnosed developmental abnormalities of the central nervous system and genetic syndromes: A practical review. Prenat Diagn.39, 666–678. 10.1002/pd.5520 (2019). - PubMed
    1. Glass, H. C., Shaw, G. M., Ma, C. & Sherr, E. H. Agenesis of the corpus callosum in California 1983–2003: a population-based study. Am. J. Med. Genet. A. 146A, 2495–2500. 10.1002/ajmg.a.32418 (2008). - PMC - PubMed
    1. Zhuang, J. et al. Prenatal diagnosis and molecular cytogenetic characterization of fetuses with central nervous system anomalies using chromosomal microarray analysis: a seven-year single-center retrospective study. Sci. Rep.14, 2271. 10.1038/s41598-024-52831-9 (2024). - PMC - PubMed
    1. Onkar, D., Onkar, P. & Mitra, K. Evaluation of fetal central nervous system anomalies by ultrasound and its anatomical Co-relation. J. Clin. Diagn. Res.8, AC05–07. 10.7860/JCDR/2014/8052.4437 (2014). - PMC - PubMed

LinkOut - more resources