. 2025 Jul 2;15(1):23257.
doi: 10.1038/s41598-025-06254-9.

Exploring the role of monocarboxylate transporter 4 in diverse KRAS mutation subtypes of colorectal Cancer

Affiliations

Exploring the role of monocarboxylate transporter 4 in diverse KRAS mutation subtypes of colorectal Cancer

Qian Gong et al. Sci Rep. .

Abstract

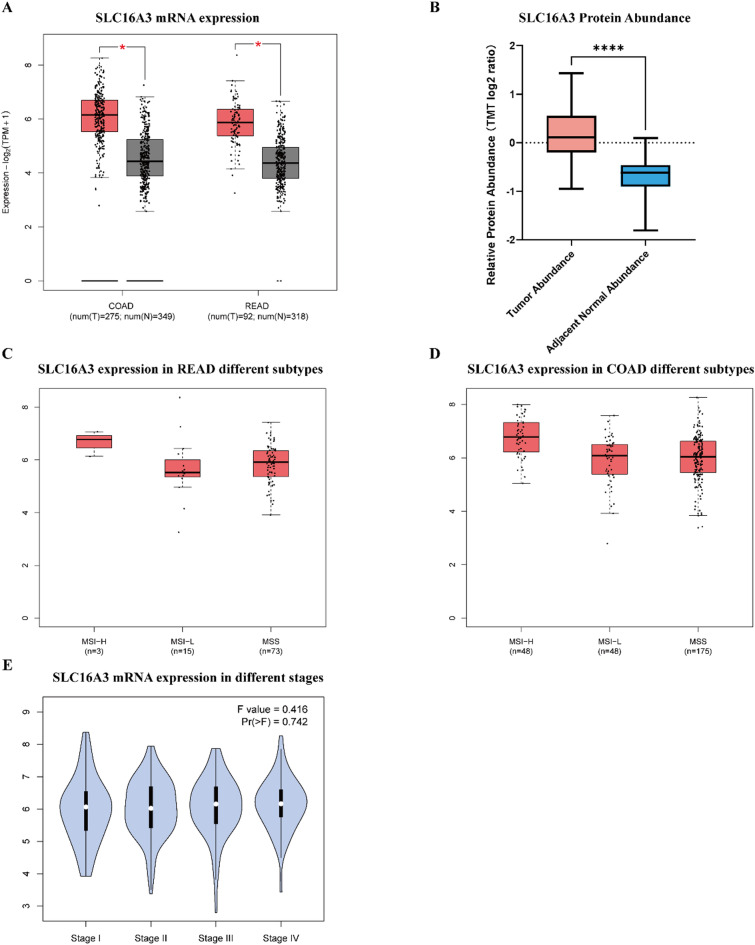
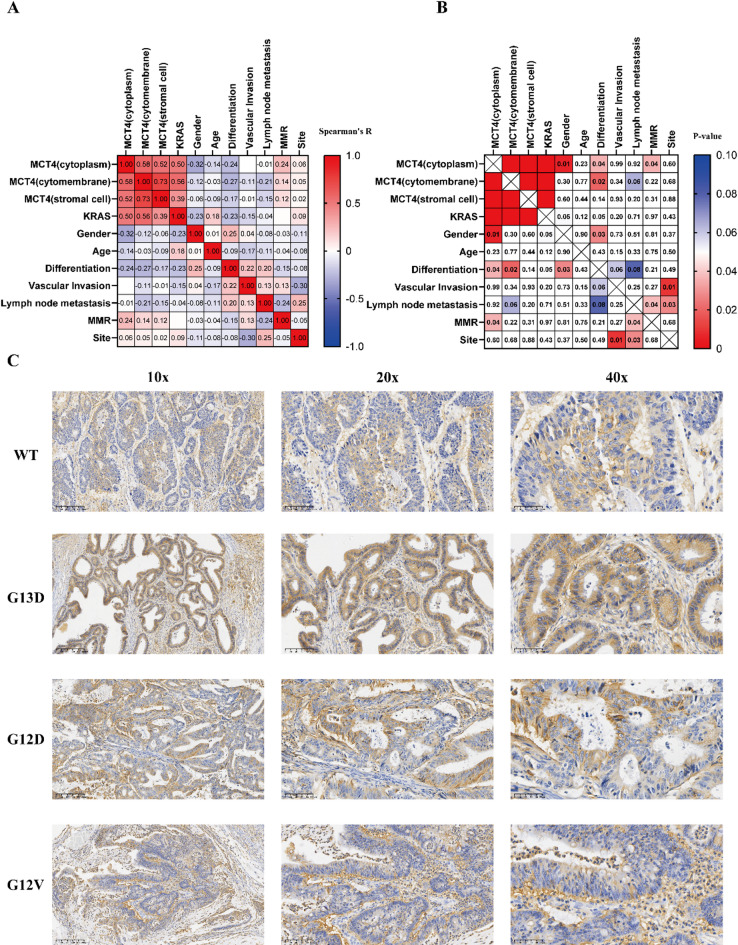
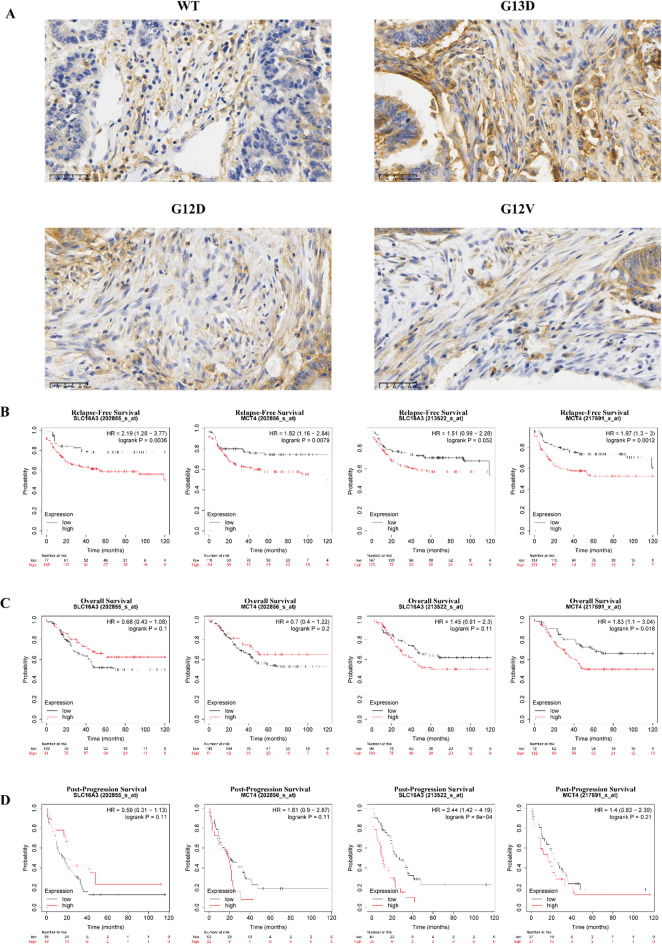
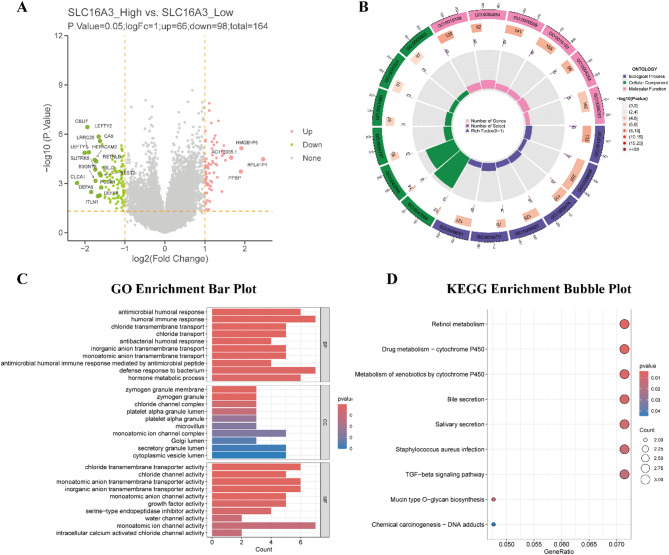
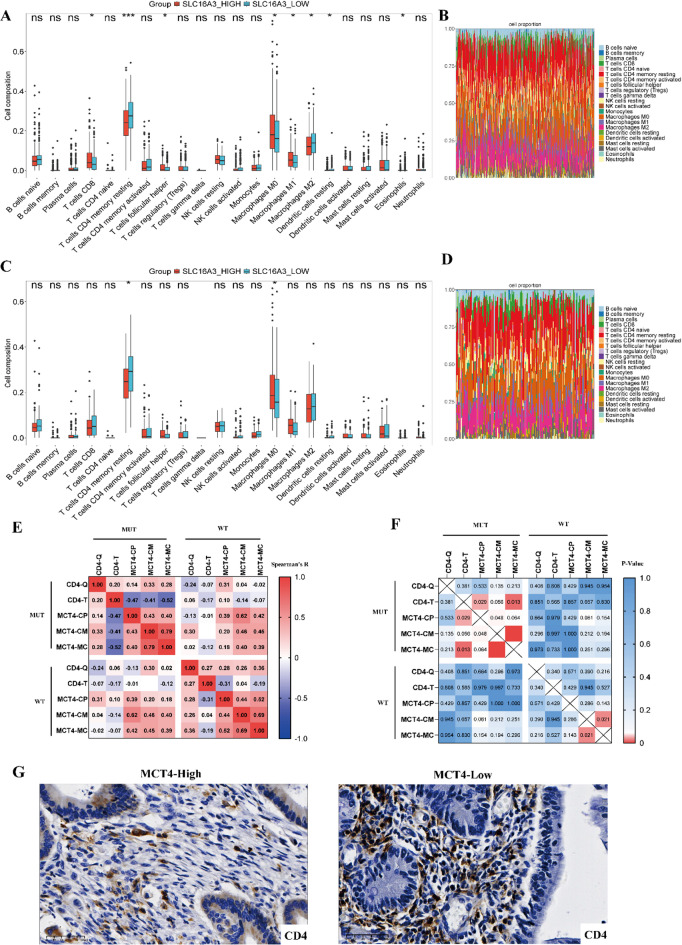
This study explored the therapeutic potential of monocarboxylate transporter 4 (MCT4/SLC16A3) in KRAS-mutant colorectal cancer (CRC). By integrating immunohistochemistry with UCSC Xena database analysis, we identified a distinct MCT4 expression pattern in KRAS-mutant CRC. Cytoplasmic MCT4 expression was positively correlated with KRAS mutation status and mismatch repair (MMR) proficiency, but negatively associated with sex and tumor differentiation. Plasma membranous MCT4 expression was also positively correlated with KRAS mutations and negatively with differentiation grade. Notably, tumors harboring KRAS codon 13 mutations, particularly G13D, showed higher MCT4 expression than those with codon 12 mutations, such as G12D. Kaplan-Meier survival analysis revealed a significant association between high SLC16A3 expression and poor prognosis. Gene Ontology (GO) and Kyoto Encyclopedia of Genes and Genomes (KEGG) pathway analyses indicated that MCT4 is mainly involved in immune regulation and metabolism-related pathways. Furthermore, CIBERSORT analysis combined with immunohistochemistry confirmed a relationship between KRAS mutations and immune cell infiltration. This is the first study to systematically characterize MCT4 expression across different KRAS-mutant CRC subtypes. Our findings suggest that MCT4 may modulate the tumor immune microenvironment in KRAS-mutant CRC and could serve as a potential target for precision therapy.

Keywords: Colorectal cancer; Immunohistochemistry; KRAS; Monocarboxylate transporter 4(MCT4); SLC16A3.


Conflict of interest statement

Declarations. Competing interests: The authors declare no competing interests.

Figures

Fig. 1
Fig. 1
Expression of SLC16A3 in colorectal cancer (CRC). (A) SLC16A3 mRNA expression levels in COAD and READ obtained from the GEPIA2 database. (B) SLC16A3 protein abundance levels in colon cancer obtained from the CPTAC database. (C-E) SLC16A3 mRNA expression levels in READ (C) and COAD (D) different gene subtypes and in CRC different stages (E).
Fig. 2
Fig. 2
Correlation between MCT4 expression and clinicopathological features in CRC. (A) Spearman correlation heatmap showing correlation coefficients between MCT4 expression (cytoplasm, plasma membrane, stroma) and clinicopathological parameters. (B) Corresponding p-value heatmap indicating statistical significance. (C) Representative immunohistochemistry images of MCT4 in CRC tissues with different KRAS genotypes (WT, G13D, G12D, G12V) at 10×, 20×, and 40× magnifications.
Fig. 3
Fig. 3
MCT4 expression in stromal cells and prognostic value of SLC16A3 in KRAS-mutant CRC. (A) Immunohistochemistry staining of MCT4 in stromal cells from KRAS-mutant and wild-type CRC tissues (40×). (B-D) Kaplan–Meier curves for relapse-free survival (RFS), overall survival (OS), and post-progression survival (PPS) based on SLC16A3 expression using four probes (202855_s_at, 202856_s_at, 213522_s_at, 217691_x_at). Hazard ratios (HR), 95% confidence intervals, and log-rank p-values are shown.
Fig. 4
Fig. 4
Differential expression and functional enrichment analysis in KRAS-mutant CRC with high vs. low SLC16A3 expression. (A) Volcano plot of differentially expressed genes (DEGs) between high and low SLC16A3 expression groups (|log2FC| > 1, p < 0.05). (B) Circular plot showing GO enrichment of DEGs across biological process, cellular component, and molecular function categories. (C) Bar plot of top GO terms enriched in DEGs. (D) KEGG pathway enrichment bubble plot showing significantly enriched pathways. Dot size indicates gene count; color represents p-value.
Fig. 5
Fig. 5
Immune infiltration analyses. Box plots show the differences in immune cell types between the high- SLC16A3 expression and low-expression groups in CRC (A) and KRAS mutant CRC (C). Distribution of 22 immune cells in CRC tissue (B) and KRAS mutant CRC tissue (D), with different colors representing different immune cells. (E-F) Relationship between CD4 and MCT4 expression in KRAS MUT and WT. (CP: cytoplasm, CM: Plasma membrane, MC: Stromal cells) (G) Immunohistochemistry showed the relationship between CD4 and MCT4(40x).

Similar articles

References

    1. Sung, H. et al. Global Cancer statistics 2020: GLOBOCAN estimates of incidence and mortality worldwide for 36 cancers in 185 countries. CA Cancer J. Clin.71, 209–249 (2021). - PubMed
    1. Dienstmann, R., Connor, K., Byrne, A. T. & Consortium, C. Precision therapy in RAS mutant colorectal Cancer. Gastroenterology158, 806–811 (2020). - PubMed
    1. Rui, Y., Wang, C., Zhou, Z., Zhong, X. & Yu, Y. K-Ras mutation and prognosis of colorectal cancer: A meta-analysis. Hepatogastroenterology62, 19–24 (2015). - PubMed
    1. Zhu, G., Pei, L., Xia, H., Tang, Q. & Bi, F. Role of oncogenic KRAS in the prognosis, diagnosis and treatment of colorectal cancer. Mol. Cancer. 20, 143 (2021). - PMC - PubMed
    1. Benson, A. B. et al. Colon cancer, version 2.2021, NCCN clinical practice guidelines in oncology. J. Natl. Compr. Canc Netw.19, 329–359 (2021). - PubMed

MeSH terms