. 2025 Jul;4(7):891-903.
doi: 10.1038/s44161-025-00679-1. Epub 2025 Jul 2.

Multimodal AI to forecast arrhythmic death in hypertrophic cardiomyopathy

Affiliations

Multimodal AI to forecast arrhythmic death in hypertrophic cardiomyopathy

Changxin Lai et al. Nat Cardiovasc Res. 2025 Jul.

Abstract

Sudden cardiac death from ventricular arrhythmias is a leading cause of mortality worldwide. Arrhythmic death prognostication is challenging in patients with hypertrophic cardiomyopathy (HCM), a setting where current clinical guidelines show low performance and inconsistent accuracy. Here, we present a deep learning approach, MAARS (Multimodal Artificial intelligence for ventricular Arrhythmia Risk Stratification), to forecast lethal arrhythmia events in patients with HCM by analyzing multimodal medical data. MAARS' transformer-based neural networks learn from electronic health records, echocardiogram and radiology reports, and contrast-enhanced cardiac magnetic resonance images, the latter being a unique feature of this model. MAARS achieves an area under the curve of 0.89 (95% confidence interval (CI) 0.79-0.94) and 0.81 (95% CI 0.69-0.93) in internal and external cohorts and outperforms current clinical guidelines by 0.27-0.35 (internal) and 0.22-0.30 (external). In contrast to clinical guidelines, it demonstrates fairness across demographic subgroups. We interpret MAARS' predictions on multiple levels to promote artificial intelligence transparency and derive risk factors warranting further investigation.


Conflict of interest statement

Competing interests: The authors declare no competing interests.

Figures

Fig. 1
Fig. 1. Schematic overview of MAARS.
MAARS has three input branches for three types of inputs: LGE-CMR images (left middle, green), clinical covariates from EHRs (left top, blue) and measurements from a CIR, which includes CMR and echocardiogram reports (left bottom, orange). The LGE-CMR images are processed to obtain the left ventricle as a region of interest and then used as input by a 3D-ViT. The EHR and CIR covariates are both structured tabular data and are used as input by dedicated FNNs. The ends of the three input branch networks are connected to a multimodal fusion module, which uses an MBT to fuse knowledge and learn to predict patient-specific SCDA risk scores (see the Methods for detailed explanations). Echo, echocardiogram; ROI, region of interest; METS, metabolic equivalents; SBP, systolic blood pressure.
Fig. 2
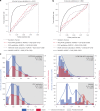
Fig. 2. Performance evaluation of MAARS and the current clinical SCDA risk assessment tools.
a, Receiver operating characteristic curves and AUROC values (data presented as mean values with 95% CIs) from the internal fivefold cross-validation on the JHH-HCM cohort (n = 553). b, Receiver operating characteristic curves and AUROC values (data presented as mean values with 95% CIs) from the external validation on the SHVI-HCM cohort (n = 286). c, Distributions of predicted SCDA risk scores, with blue bars and curves for patients not experiencing SCDA and red bars and curves for patients experiencing SCDA. Two-sample Kolmogorov–Smirnov tests were conducted to quantify the distance of the distributions for SCDA and no SCDA and to obtain the P values. The dashed vertical line indicates the optimal decision threshold for each predictor, and the shaded gray area on the right of the thresholds indicates patients predicted to have a high risk for SCDA. K–S, Kolmogorov–Smirnov statistic.
Fig. 3
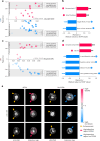
Fig. 3. Effects of adding data modality.
The box clusters from left to right on the x axis are the performances for a series of data–model combinations: the EHR branch network within MAARS using clinical covariates from EHR (EHR, FNN), the CIR branch network within MAARS using measurements from CIR (CIR, FNN), an FNN taking the concatenation of EHR and CIR as input (EHR + CIR, early fusion, FNN), MAARS operating with only EHR and CIR (EHR + CIR, mid fusion, FNN + MBT), and MAARS operating with full data modalities (EHR + CIR + CMR, MAARS). The three blue boxes (y axes on the left) in each cluster represent the AUROC (dark blue, first box from the left in each cluster), BA (light blue, second box) and AUPRC (medium blue, third box), for which higher values mean better performance. The orange boxes (y axis on the right) represent the Bs, for which lower values indicate better calibration. The box bounds represent the range between the first and third quantiles; the white center line in each box is the mean; the whiskers are the 95% CIs. All values were calculated based on the cross-validation results on the internal cohort (n = 553) using bootstrapping (Methods). The dashed lines represent the baseline metrics by random chance. All values are the calculated AUROC, BA, AUPRC and Bs.
Fig. 4
Fig. 4. Performance in different patient subgroups.
ad, The performance metrics (AUROC and BA) are shown for the multimodal AI (MAARS) and the clinical tools (ACC/AHA guidelines, ESC guidelines and HCM Risk-SCD calculator) in different sex (a, b) and age (c, d) subgroups. The bar lengths and the values in the bars are the means; the whiskers are the 95% CIs. All values were calculated based on the cross-validation results on subgroups of the internal cohort using bootstrapping (Methods).
Fig. 5
Fig. 5. Model interpretability.
a, Plot of Shapley value-based explanations on the internal validation cohort for the clinical covariates from the EHR branch input. The x axis is the mean of absolute Shapley values (quantifying the overall impact of a covariate), and the y axis is the correlation coefficient (Pearson’s r) between covariate values and Shapley values (quantifying a covariate’s correlation with SCDA propensity). Covariates with r > 0.6 or r < −0.6 are considered to have strong correlations with SCDA propensity. Positive correlations are shown in red, whereas negative correlations appear in blue. b, Model-identified EHR covariates with the highest 25% impact (rightmost on the x axis) and strong correlations with SCDA propensity. c,d, Explanations (c) and identified covariates (d) for the CIR branch. e, Attention-based interpretation of the LGE-CMR branch network for patients who experienced (left two columns) or did not experience (right two columns) SCDA. The short-axis LGE-CMR images in the first and third columns are examples of inputs to the LGE-CMR branch, and their corresponding attention maps from the network are overlying the LGE-CMR images and shown in the second and fourth columns. Regions of high attention values (red for patients experiencing SCDA, blue for patients not experiencing SCDA) suggest that the local pixel intensities have high contributions to the network decision process. The yellow arrows point to contrast enhancements in the LGE-CMR images, and the red and blue arrows point to high-attention regions. HR, heart rate; VT, ventricular tachycardia.
Extended Data Fig. 1
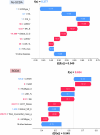
Extended Data Fig. 1. Personalized interpretation of EHR branch network predictions.
Shown are Shapley value-based interpretations for a patient who did not experience SCDA (top panel) and a patient who experienced SCDA (bottom panel). The plots are read from bottom up: the number under the x-axis is the mean risk score for the cohort (0.389); the blue and red bars are the Shapley values associated with the input covariates, representing the effect of each covariate on the output risk score; finally, with the effects from all the covariates, the model reaches its final prediction on top of the plot (value of f(x)).
Extended Data Fig. 2
Extended Data Fig. 2. Personalized interpretation of CIR branch network.
Shown are Shapley value-based interpretations for a patient who did not experience SCDA (top panel) and a patient who experienced SCDA (bottom panel). The plots are read from bottom up: the number under the x-axis is the mean risk score for the cohort (0.545); the blue and red bars are the Shapley values associated with the input covariates, representing the effect of each covariate on the output risk score; finally, with the effects from all the covariates, the model reaches its final prediction on top of the plot (value of f(x)).
Extended Data Fig. 3
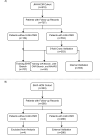
Extended Data Fig. 3. Study flowcharts.
The flowchart (a) shows the eligibility assessment of patients from the JHH-HCM cohort, a subset of which was used for cross-validation. The flowchart (b) shows the eligibility assessment of patients from the SHVI-HCM cohort for external validation.

References

    1. Fishman, G. I. et al. Sudden cardiac death prediction and prevention: report from a National Heart, Lung, and Blood Institute and Heart Rhythm Society Workshop. Circulation122, 2335–2348 (2010). - PMC - PubMed
    1. Adabag, A. S., Luepker, R. V., Roger, V. L. & Gersh, B. J. Sudden cardiac death: epidemiology and risk factors. Nat. Rev. Cardiol.7, 216–225 (2010). - PMC - PubMed
    1. John, R. M. et al. Ventricular arrhythmias and sudden cardiac death. Lancet380, 1520–1529 (2012). - PubMed
    1. Rea, T. D. & Page, R. L. Community approaches to improve resuscitation after out-of-hospital sudden cardiac arrest. Circulation121, 1134–1140 (2010). - PubMed
    1. Estes, N. A. M. 3rd Predicting and preventing sudden cardiac death. Circulation124, 651–656 (2011). - PubMed

MeSH terms

LinkOut - more resources