

Review
doi: 10.1038/s44303-025-00085-z.
Advanced preclinical functional magnetic resonance imaging of the brain
Affiliations
- PMID: 40603606
- PMCID: PMC12177068
- DOI: 10.1038/s44303-025-00085-z
Item in Clipboard
Review
Advanced preclinical functional magnetic resonance imaging of the brain
Npj Imaging.
.
Abstract
Functional magnetic resonance imaging (fMRI), exploiting the blood oxygen level-dependent (BOLD) contrast, is the most widely used technique to study brain function. Combined with tools from biotechnology, molecular biology, and genetics, preclinical fMRI offers unparalleled opportunities to experimentally test causal hypotheses that are beyond the reach of human research. Here, we review recent progress in MRI hardware development, provide recommendations for BOLD fMRI protocol optimization, and discuss recent applications.
© 2025. The Author(s).
Conflict of interest statement
Competing interests: J.K. is an employee of Bruker BioSpin GmbH & Co. KG. W.C.C. is an employee of Bruker Singapore Pte. Ltd. R.A. is an employee of Bruker Japan K.K.
Figures
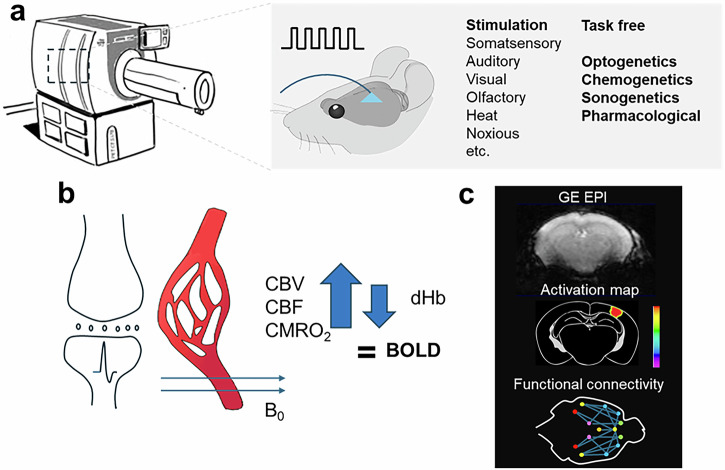
a MRI hardware geared for the physiological imaging of different animal species. Data is acquired under task-free conditions, using different types of stimulation, or using optogenetic, chemogenetic, sonogenetic, or pharmacological interventions. b In fMRI, blood oxygen level dependent (BOLD) contrast is generated when increased local neuronal activity results in an increase in cerebral blood volume (CBV), cerebral blood flow (CBF), and cerebral metabolic rate of oxygen (CMRO2). As the hemodynamic response exceeds the increase in oxygen consumption, there is a relative decrease in paramagnetic deoxyhemoglobin (dHb) concentration compared to diamagnetic oxyhemoglobin in the blood vessels. This change in dHb ultimately leads to the recordable BOLD signal. c BOLD signal is recorded using a T2*-weighted GE EPI sequence that can be transformed into maps of focal brain activity and functional connectivity. GE EPI data were acquired for educational purposes using a BioSpec Maxwell 94/17. All Bruker in vivo animal work was approved by the institutional animal care and use committee (IACUC) and local authorities and conducted under a valid study permit (Germany AZ 123456).
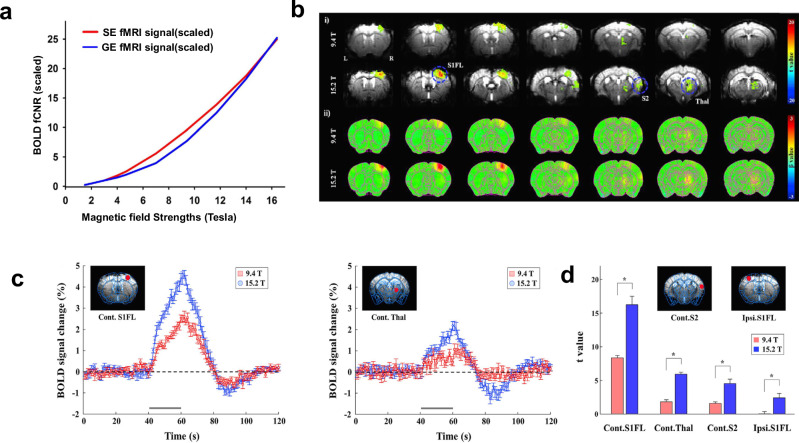
a Signal amplitude of micro-vasculature as a function of magnetic field strength for gradient echo (GE, blue) and spin echo (SE, red) EPI sequences, normalized to 3 T and scaled with B01.65. Taken with modifications from [Uludag and Blinder 2018]. b Field strength-dependent (9.4 Tesla vs. 15.2 Tesla) BOLD response to 20-s forepaw stimulation in lightly anesthetized mice. Multi-slice fMRI maps of i) one representative animal overlaid on the original EPI image with a statistical threshold (uncorrected p < 0.001, cluster size >5 voxels) and ii) group-averaged analysis without statistical thresholds (n = 7, respectively) at each magnetic field. c fMRI time courses (average of seven animals) obtained from the region-of-interest of the contralateral S1FL and thalamus were plotted for 9.4 Tesla (red) and 15.2 Tesla (blue). Error bars, SEM; gray horizontal bar, 20-s stimulus duration. d Field strength-dependent statistical t values from four different ROIs of contralateral forelimb primary somatosensory area (Cont.S1FL), thalamus (Cont.Thal), secondary somatosensory area (Cont.S2), and ipsilateral primary somatosensory area (Ipsi.S1FL). error bars, SEM; *p < 0.05 (n = 7, independent t test). Taken from [Jung 2019].
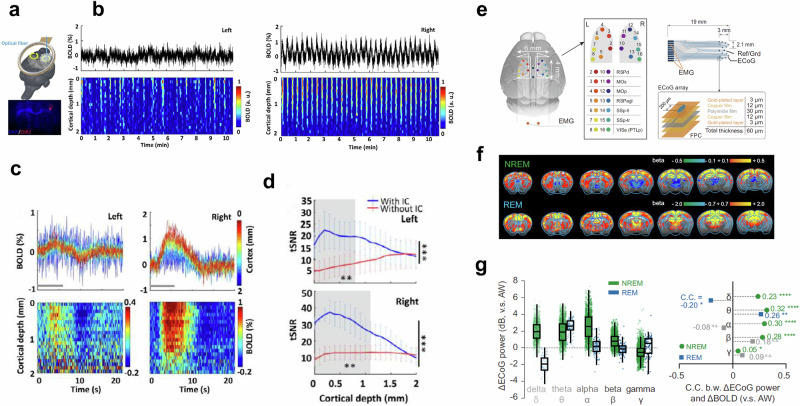
a–d Optogenetically evoked BOLD with implantable inductively coupled detector. a Schematic drawing of two inductive coils with an optical fiber inserted into the right forepaw somatosensory cortex (blue). A representative wide-field fluorescence image illustrates ChR2-mCherry expression. b Averaged time course (top) and normalized spatiotemporal map (bottom) BOLD responses induced directly by optogenetic stimulation in right forepaw somatosensory cortex (right) and projected left hemisphere (left). c BOLD percentage-change time courses (top) and maps (bottom) for each epoch in each voxel along cortical depth on both hemispheres (n = 3). Gray lines indicate light stimulation. d The comparison between both hemispheres shows significantly higher tSNR in images acquired with (blue) implanted inductive coils over images acquired without (red) implanted inductive coils (paired-sample t-test, ***p < 0.001, **p < 0.01 for the gray shadow, upper panel 0–0.8 mm, lower panel 0–1.1 mm, n = 3 rats, mean ± SD). The asterisks on the right side indicate a 3-fold sensitivity gain. Taken with modifications from [Chen 2022]. e–g fMRI using MR-compatible electrophysiology recording in un-anesthetized mice. e Design and location of MR-compatible electrocorticogram (ECoG array). Two gold wires (orange) were inserted in the nuchal region for electromyography (EMG) recording. Right panel, the diagram of a multi-electrode ECoG array and its layered construction. FPC flexible printed circuit. f The setup was used to assess brain-wide BOLD activation of non-rapid eye movement (NREM) and rapid eye movement (REM) sleep in mice using simultaneous electrophysiology. Shown are group BOLD activation maps of NREM and REM compared to awake (AW) state (FDR corrected, p < 0.05; n = 46). g Relative ECoG band-limited power in NREM and REM compared to AW state and Pearson’s correlation coefficients (C.C.). The boxes show the first and third quartiles; inner line is the median over sessions; whiskers represent minimum and maximum values (outliers removed). delta (δ), 1–4 Hz; theta (θ), 5–10 Hz; alpha (α), 11–20 Hz; beta (β), 21–40 Hz; gamma (γ), 41–100 Hz. Statistical significance was calculated by two-tailed t test. *p < 0.05; **p < 0.01; ****p < 0.0001; n.s., no significance. Taken from [Yu 2023].
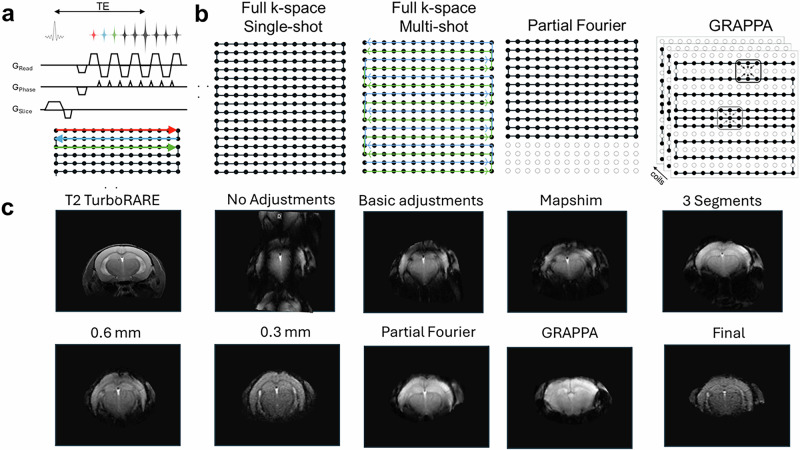
a Pulse sequence diagram for a GE EPI. Gradient (G) shapes are shown for the read, phase and slice direction. b k-space trajectories and sampling for different EPI sequences. In single-shot EPI all k-space lines are sampled after a single excitation pulse. Frequency-encoding is along horizontal axis while phase-encoding is along the vertical. In multi-shot EPI parts of k-space are sampled with each shot. Partial Fourier reduces the number of phase-encoding steps by a one-sided truncation. This accelerates EPI acquisition. GeneRalized Autocalibrating Partially Parallel Acquisitions (GRAPPA) can be used when a multi-channel coil is used for signal reception. A reduced data set in the phase encoding direction of k-space is acquired, significantly reducing the acquisition time. c Effects of different image parameters on EPI image quality. Shown are axial slices of a mouse brain, with a GE EPI basic protocol without and with adjustments (study shim, ghost correction, receiver gain with trajectory measurement) and using fieldmap-based shimming, segmentations, thinner slices, and acceleration techniques. For the final image, a single-shot EPI with 0.3 mm slices, using partial Fourier and mapshim, was combined in the acquisition protocol. A T2-weighted fast spin echo (Rapid Acquisition with Relaxation Enhancement (RARE) was acquired as an anatomical reference. Data was acquired for educational purposes using a BioSpec Maxwell 94/17. All Bruker in vivo animal work was approved by the institutional animal care and use committee (IACUC) and local authorities and conducted under a valid study permit (Germany AZ 123456).
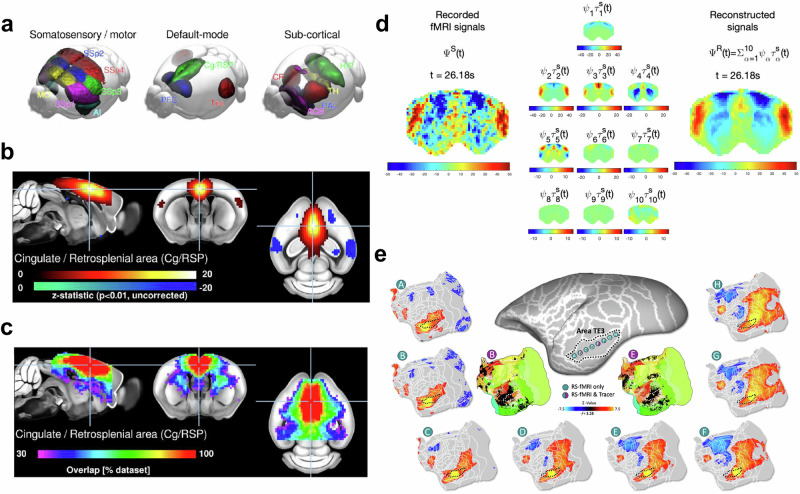
a–c Functional networks in the mouse brain. Group-level independent component analysis estimated across 98/255 “specific functional connectivity” scans reveals canonical mouse components. a All components presented a marked bilateral organization. Nine components were found to overlap principally with the isocortex including regions attributed to latero-cortical and salience network, and default-mode network by seed-based analyses, three components overlapped with the striatum, one with the hippocampal areas, and one with the thalamus. Detailed representations of the cingulate/retrosplenial area component (Cg/RSP). b One-sample t tests within datasets indicate that 100% of datasets presented significant functional connectivity (p < 0.05, uncorrected) within the Cg/RSP component. c Functional connectivity relative to Cg/RSP is found specifically in the anterior cingulate area but not in the primary somatosensory in 79% of the individual scans following dual regression. Taken from [Grandjean 2020]. d Functional connectivity in the rat brain. Principal component analysis of ultrafast fMRI signals (temporal resolution = 38 ms). (Left) fMRI signals in n = 1463 brain voxels band-pass filtered between 0.01 and 0.3 Hz recorded from a representative rat under medetomidine only. (Middle) Each of the 10 spatially defined principal modes of covariance is scaled over time by its corresponding temporal signature in scan S to illustrate the standing wave dynamics. (Right) The signals recorded in scan S are reconstructed as the linear sum of the 10 principal components multiplied by their corresponding temporal signature in scan S. To account for differences in power across components, color bar limits are set to ±4 standard deviations of the corresponding temporal signatures. Taken from [Cabral 2023]. e Voxel-wise comparison of functional brain connectivity of a marmoset (green, from marmosetbrainconnectome.org) with existing tracer-based resources (purple, from marmosetbrain.org) in the area TE3. Taken from [Schaeffer 2022].
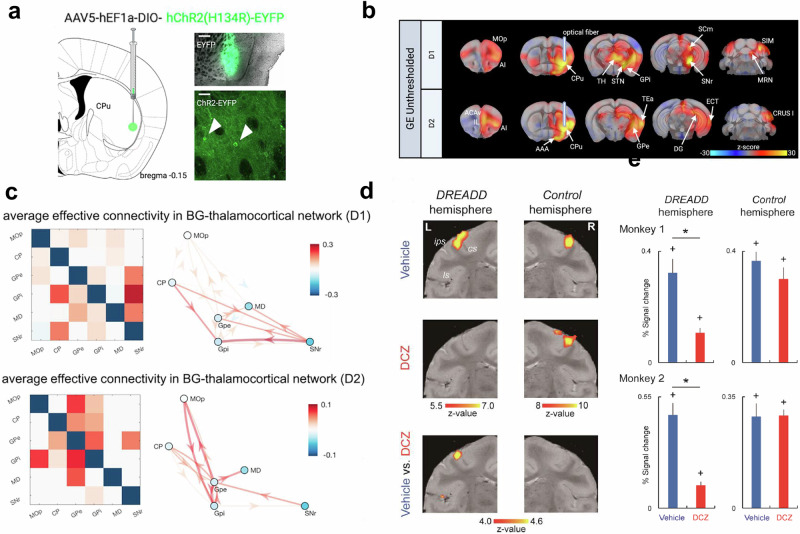
a–c Optogenetic activation of striatal cells expressing D1 (D1R) and D2 (D2R) dopamine receptors in the mouse. a A virus carrying an excitatory opsin was injected into the right ventrolateral caudate putamen of D1- and D2-Cre mice. Viral expression was confirmed histologically. b Unthresholded generalized linear model z-stat activation maps of D1R and D2R cell stimulation. c Average connectivity pattern in the basal ganglia (BG)-thalamocortical network during D1R cell stimulation and during D2R cell stimulation. Striatal D1R/D2R stimulation evokes distinct activity within the (BG)-thalamocortical network and differentially engages cerebellar and prefrontal regions. Primary motor cortex (MOp), caudate putamen (CP), external globus pallidus (GPe), internal globus pallidus (GPi), mediodorsal nucleus of thalamus (MD), substantia nigra (SNr). Taken from [Grimm 2021]. d, e Chemogenetic-induced silencing in the macaque brain leads to attenuation of the sensory-evoked BOLD signal in the unilateral hand index finger region. d Primary somatosensory cortex activation in monkey 1 evoked by cutaneous tactile stimulation of the index finger of each hand contralateral (left) and ipsilateral (right) to the designer receptor exclusively activated by designer drug (DREADD)-expressing hemisphere. Activation maps of the primary somatosensory cortex for vehicle and deschloroclozapine (DCZ), and the difference between them. e Percent signal change calculated for primary somatosensory cortex ROIs in the contralateral hemisphere to the stimulated hand for each monkey. Results for DREADD-expressing (left) and the opposite (right) hemispheres are depicted. Blue and red columns depict the results in vehicle and DCZ conditions, respectively. Chemogenetic inhibition also led to impaired fine grasping with the contralateral hand. Error bars, SEM. *p < 0.001, unpaired t test, corrected for multiple comparisons. +p < 0.001, paired t test for difference from baseline, corrected for multiple comparisons. Taken from [Hirabayashi 2021].
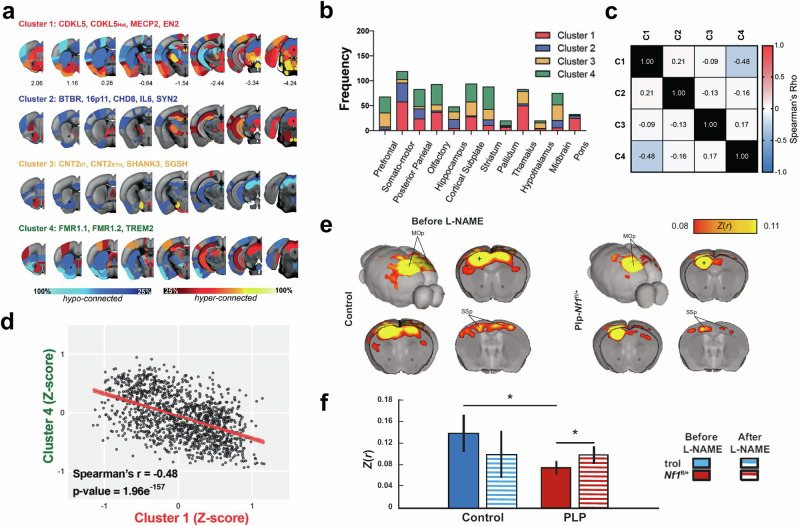
a–d Functional connectivity deficits in mouse models of autism. The mapping reveals a spectrum of four functional connectivity subtypes. a Rendering of regional connectivity deficits in the four clusters at the node level, revealing a heterogeneous set of brain areas with prominent over- and under-connectivity. Data are visualized in Allen Mouse reference space. b Number of connections (displayed as stacked frequencies) that exhibited abnormalities at the parent level. c Correlation matrix between all clusters, considering all 545 edges. d A significant negative correlation was found between Cluster 1 and Cluster 4. Spearman’s rho = −0.48, p = 1.96e-157. Taken from [Zerbi 2021]. e, f Therapeutic rescue of reduced functional connectivity in a mouse model of neurofibromatosis type 1. e Group average correlation maps between control and mice with oligodendrocyte-specific Nf1 deletion (Plp-Nf1fl/+) demonstrate reduced interhemispheric connectivity in Plp-Nf1fl/+ mice. Z(r) Fisher’s Z-transformed r, MOp primary motor cortex, SSp primary somatosensory cortex. f Rescue of connectivity in Plp-Nf1fl/+ mice by inhibition of nitric oxide synthase. Correlation of seed-to-seed analysis in the primary motor cortex (denoted as a plus sign in the maps shown in e, plotted for each group before and after L-arginine methyl ester (L-NAME) treatment. Taken from Asleh.
References
Publication types
LinkOut - more resources
Full Text Sources