. 2025 Jul 2;15(1):23228.
doi: 10.1038/s41598-025-97929-w.

DASNet a dual branch multi level attention sheep counting network

Affiliations

DASNet a dual branch multi level attention sheep counting network

Yini Chen et al. Sci Rep. .

Abstract

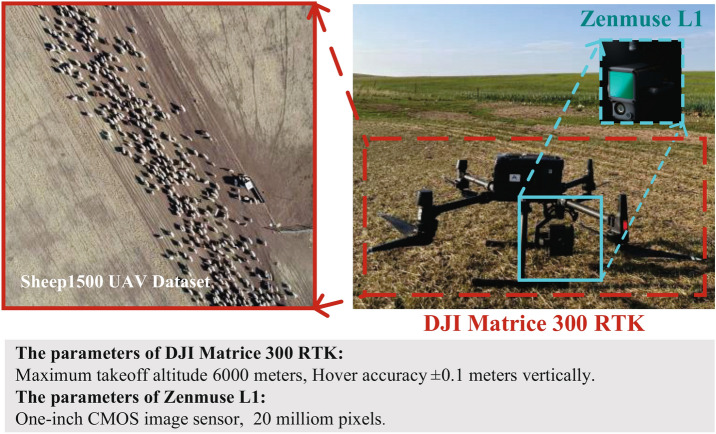
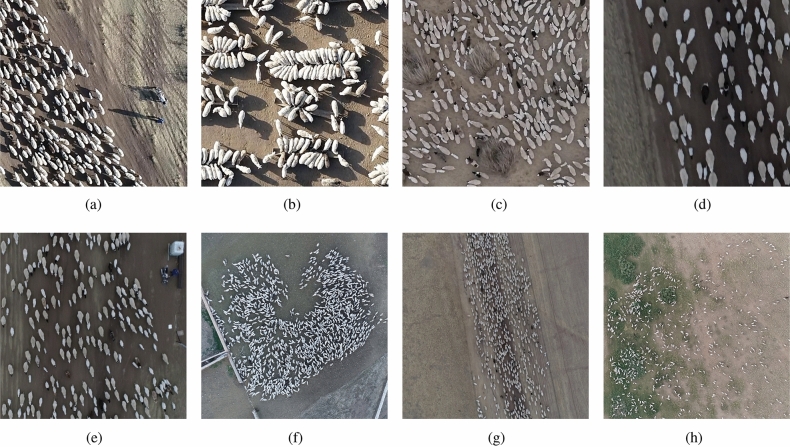
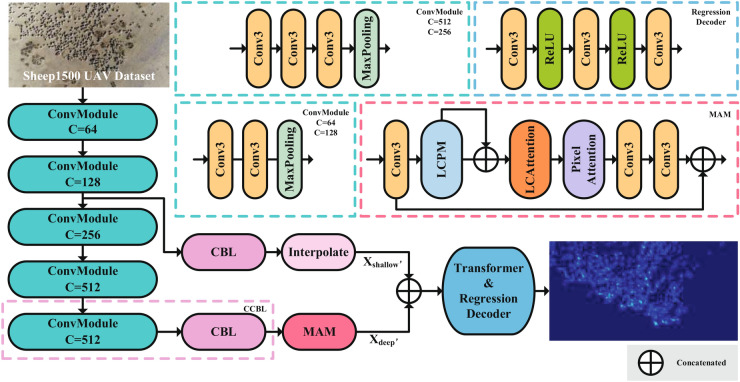
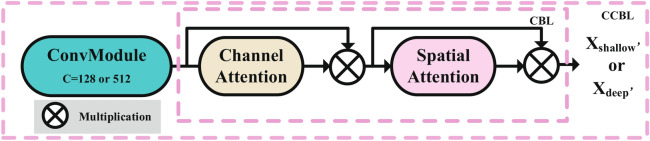
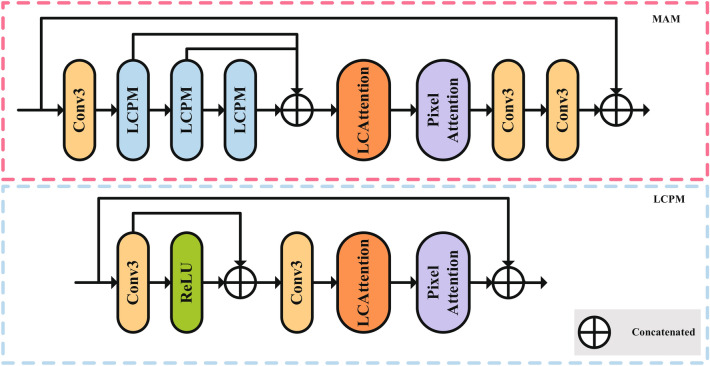
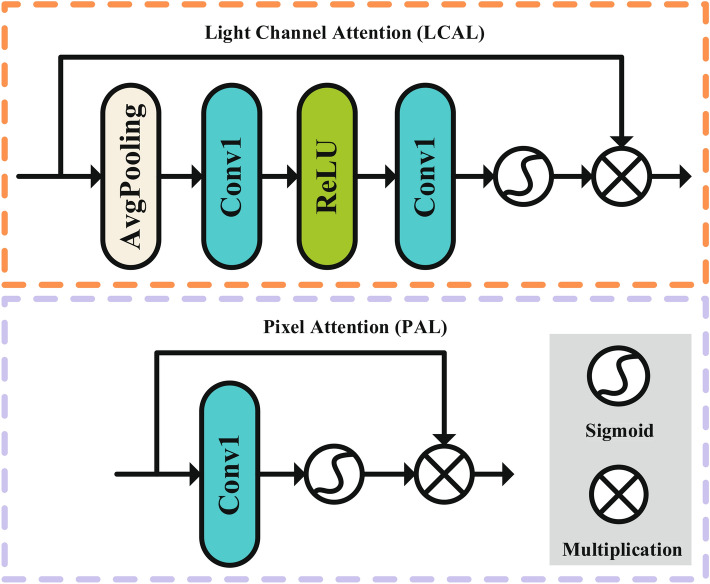
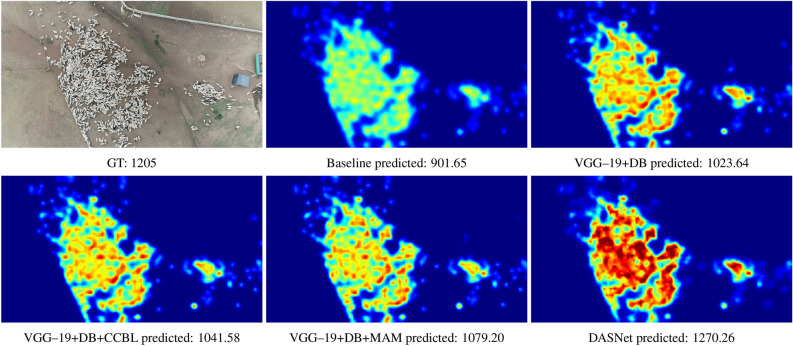
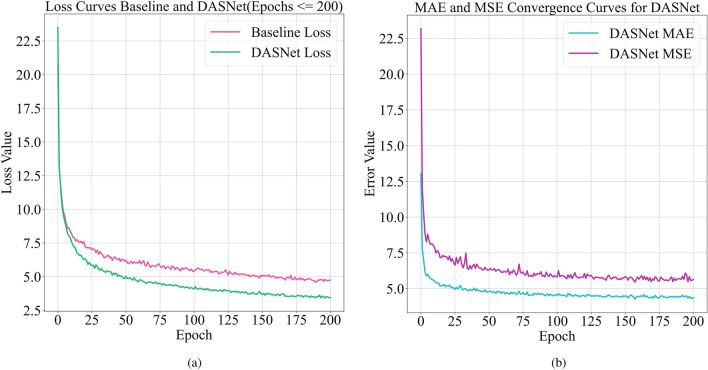
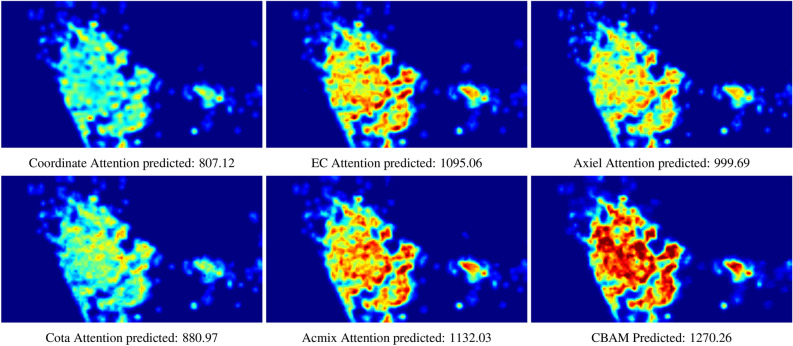
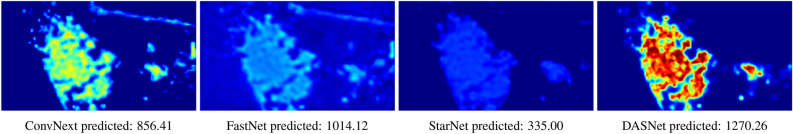
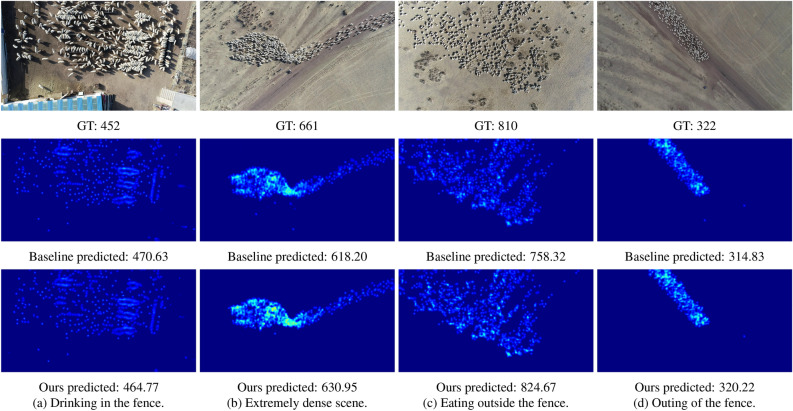
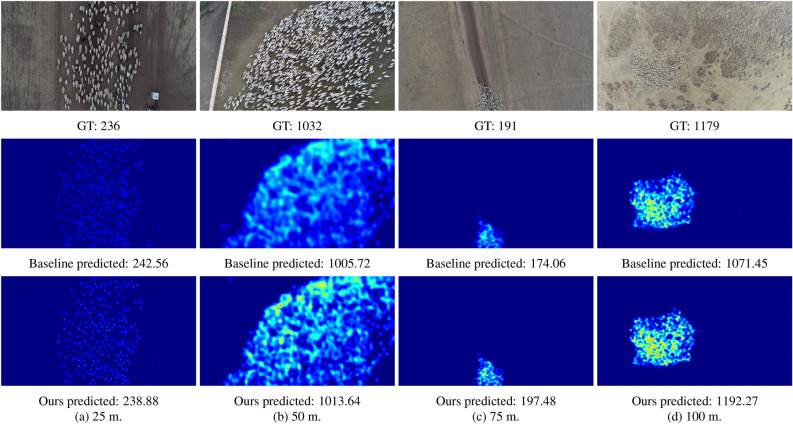
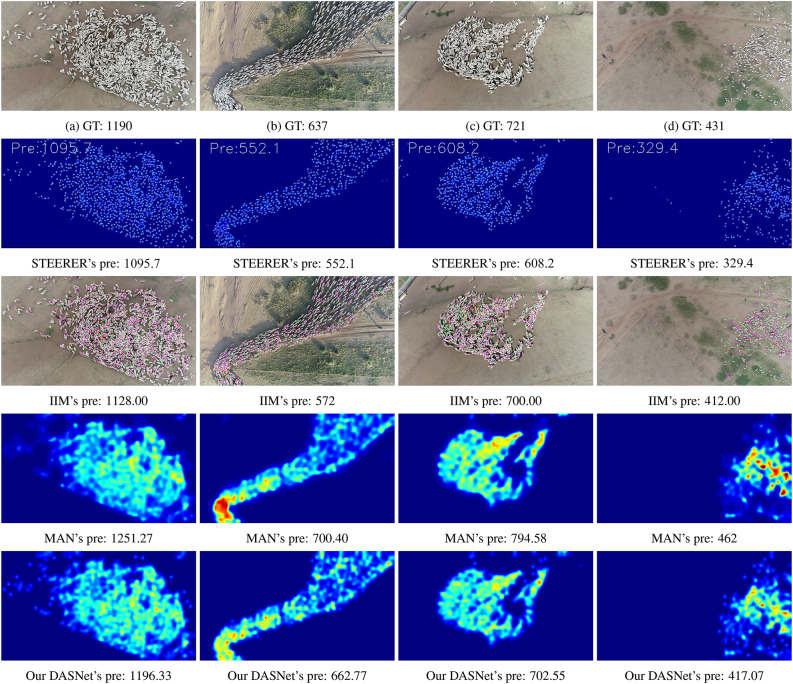
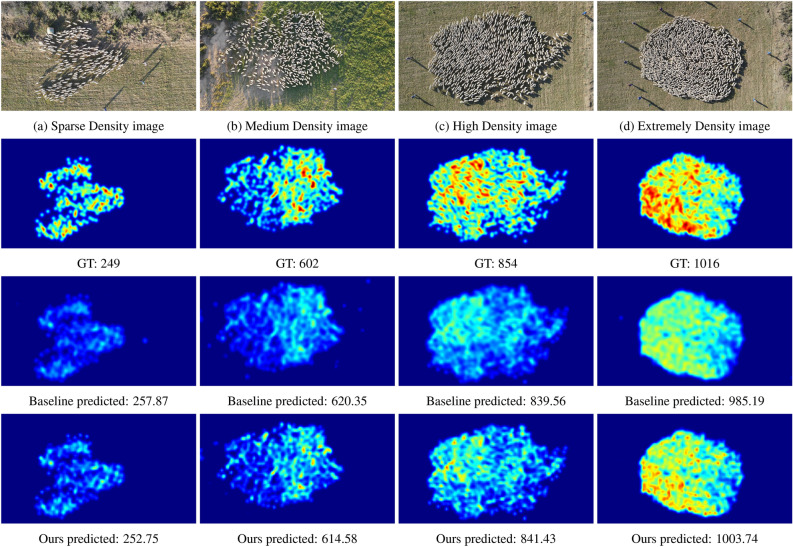
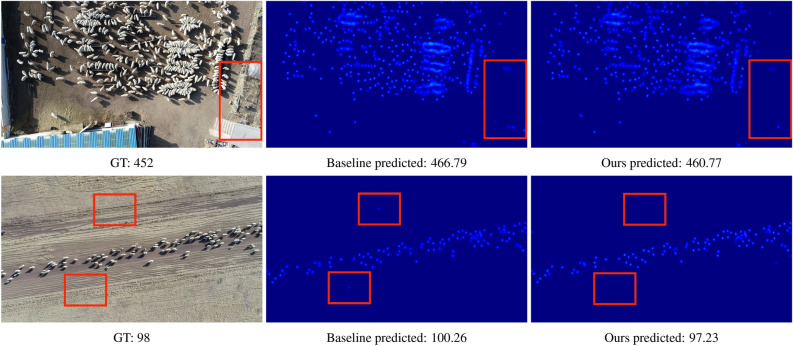
Grassland sheep counting is essential for both animal husbandry and ecological balance. Accurate population statistics help optimize livestock management and sustain grassland ecosystems. However, traditional counting methods are time-consuming and costly, especially for dense sheep herds. Computer vision offers a cost-effective and labor-efficient alternative, but existing methods still face challenges. Object detection-based counting often leads to overcounts or missed detections, while instance segmentation requires extensive annotation efforts. To better align with the practical task of counting sheep on grasslands, we collected the Sheep1500 UAV Dataset using drones in real-world settings. The varying flight altitudes, diverse scenes, and different density levels captured by the drones endow our dataset with a high degree of diversity. To address the challenge of inaccurate counting caused by background object interference in this dataset, we propose a dual-branch multi-level attention network based on density map regression. DASNet is built on a modified VGG-19 architecture, where a dual-branch structure is employed to integrate both shallow and deep features. A Conv Convolutional Block Attention Layer (CCBL) is incorporated into the network to more effectively focus on sheep regions, alongside a Multi-Level Attention Module (MAM) in the deep feature branch. The MAM, consisting of three Light Channel and Pixel Attention Modules (LCPM), is designed to refine feature representation at both the channel and pixel levels, improving the accuracy of density map generation for sheep counting. In addition, a residual structure connects each module, facilitating feature fusion across different levels and offering increased flexibility in handling diverse information. The LCPM leverages the advantages of attention mechanisms to more effectively extract multi-scale global features of the sheep regions, thereby helping the network to reduce the loss of deep feature information. Experiments conducted on our Sheep1500 UAV Dataset have demonstrated that DASNet significantly outperforms the baseline MAN network, with a Mean Absolute Error (MAE) of 3.95 and a Mean Squared Error (MSE) of 4.87, compared to the baseline's MAE of 5.39 and MSE of 6.50. DASNet is shown to be effective in handling challenging scenarios, such as dense flocks and background noise, due to its dual-branch feature enhancement and global multi-level feature fusion. DASNet has shown promising results in accuracy and computational efficiency, making it an ideal solution for practical sheep counting in precision agriculture.


Conflict of interest statement

Competing interests: The authors declare no competing interests.

Figures

Fig. 1
Fig. 1
The DJI Matrice 300 RTK drone and Camera parameters. The scene in the image is from the Sheep1500 UAV Dataset.
Fig. 2
Fig. 2
The above figure is from our own Sheep1500 UAV Dataset and presents sample images captured at different altitudes and in various scenes. (a) Scene with people and cars. (b) Drinking water scene. (c) Scene with haystacks. (d) Dark sheep and background. (e) 25 m. (f) 50 m. (g) 75 m. (h) 100 m.
Fig. 3
Fig. 3
The structure of DASNet consists of a feature extraction module located before the Regression Decoder. Our constructed module MAM is applied exclusively in the deep feature branch. The input images are from the Sheep1500 UAV Dataset.
Fig. 4
Fig. 4
The basic structure of CCBL: the CBAM module with Conv. CBAM consist of a Channel Attention Layer (CAL) and a Spatial Attention Layer (SAL).
Fig. 5
Fig. 5
The structure of the MAM and the structure of the group module LCPM.
Fig. 6
Fig. 6
The structure of the LCAL and the structure of the group module PAL.
Fig. 7
Fig. 7
We selected an image from the Sheep1500 UAV Dataset and presented the visualization results of each part of the ablation study.
Fig. 8
Fig. 8
Loss convergence line chart and DASNet’s MAE & MSE convergence line chart. (a) The Loss of the Baseline and our network. (b) The MAE and MSE of DASNet.
Fig. 9
Fig. 9
We selected an image from the Sheep1500 UAV Dataset and presented the different visualization effects of various attention mechanisms in our network architecture.
Fig. 10
Fig. 10
We selected an image from the Sheep1500 UAV Dataset and presented the different visualization effects of various Backbone in our network architecture.
Fig. 11
Fig. 11
The figure presents the visualization results of the Sheep1500 UAV Dataset in different scenarios. We selected different test images to display the visual results. Each column respectively represents the original image with the real number of sheep, the number of Baseline predictions, and the number of DASNet predictions.
Fig. 12
Fig. 12
The above figure presents the comparison results of the Sheep1500 UAV Dataset at different scales. Each column respectively represents the original image with the real number of sheep, the number of Baseline predict and the number of DASNet predictions.
Fig. 13
Fig. 13
The above figure presents the comparison results of the Sheep1500 UAV Dataset across different models. Each row displays the visualization results of different networks. It should be specifically noted that in the STEERER visualization results, the red dots represent the GT, and the Gaussian density map below the dots indicates the prediction results. In the IIM network visualization results, the pink dots represent the prediction results, while the green and red dots indicate the GT.
Fig. 14
Fig. 14
Visualization of density map for Public Datasets and sheep counts in different density. We selected different test images to display the visual results. Each column respectively represents the original image with the real number of sheep, the number of Baseline predict and the number of DASNet predictions.
Fig. 15
Fig. 15
We selected several images from the Sheep1500 UAV Dataset to verify the effectiveness of DASNet in removing background noise. Each row respectively represents the ground truth, the number of sheep predicted by the baseline network, and the number of sheep predicted by DASNet. The areas outlined in red and blue show the effect before and after the network improvement.

Similar articles

References

    1. Ming-Zhou, L. et al. Review on the intelligent technology for animal husbandry information monitoring. Sci. Agric. Sin.45, 2939. 10.3864/j.issn.0578-1752.2012.14.017 (2012).
    1. Chen, Y., Li, S., Liu, H., Tao, P. & Chen, Y. Application of intelligent technology in animal husbandry and aquaculture industry. In 2019 14th International Conference on Computer Science & Education (ICCSE) 335–339 (2019).
    1. Sarwar, F., Griffin, A., Rehman, S. U. & Pasang, T. Detecting sheep in uav images. Comput. Electron. Agric.187, 106219 (2021).
    1. Aquilani, C., Confessore, A., Bozzi, R., Sirtori, F. & Pugliese, C. Precision livestock farming technologies in pasture-based livestock systems. Animal16, 100429 (2022). - PubMed
    1. Handcock, R. N. et al. Monitoring animal behaviour and environmental interactions using wireless sensor networks, gps collars and satellite remote sensing. Sensors9, 3586–3603 (2009). - PMC - PubMed

LinkOut - more resources