. 2025 Jul 2;8(1):986.
doi: 10.1038/s42003-025-08417-w.

Differential brain activation and network connectivity in social interactions presence and absence of physical contact

Affiliations

Differential brain activation and network connectivity in social interactions presence and absence of physical contact

Jinhe Zhai et al. Commun Biol. .

Abstract

Comparative studies of social interaction in the presence of physical contact (SIPPC) and social interaction in absence of physical contact (SIAPC) enhance our understanding of the neurophysiological mechanisms underlying these activities. We analyzed comparatively the effects of SIPPC and SIAPC on c-fos expression across 100 brain regions in mice, and found that SIPPC activated a broader range of brain regions, particularly those associated with emotion and reward. Subsequent observations of brain activity coordination and network construction highlighted the critical roles of the infralimbic cortex (IL), lateral septal nucleus intermediate part (LSI), and agranular insular cortex ventral part (AIV) in SIPPC. Additionally, we demonstrated through chemogenetic techniques that inhibiting the activity of AIV, LSI brain regions, or AIV-LSI circuit significantly reduces the tactile contact behavior of mice during SIPPC. To sum up, our findings elucidate the similarities and differences in brain activity and network connectivity between SIPPC and SIAPC, while identifying specific brain regions and neural circuit that may mediate tactile contact in social interaction.


Conflict of interest statement

Competing interests: The authors declare no competing interests. Ethics: All animal procedures were approved by the Ethics Committee of Harbin Medical University (approval number-HMUIRB2023039).

Figures
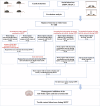
Fig. 1
Fig. 1. Procedures for this study.
Note: the schematic diagram of the mouse cage in this figure, as well as this element in other parts of the manuscript, is sourced from Scidraw (ID:10.5281/zenodo.5496326).
Fig. 2
Fig. 2. Correlation analysis of tactile sensitivity and social duration in SIPPC and SIAPC.
A, B Schematic diagram of the SIPPC and SIAPC paradigm. C Analysis of correlation between cotton swab dynamic stimulation response rate and duration of tactile contact in SIPPC. D Analysis of correlation between cotton swab dynamic stimulation response rate and duration of social  approach in SIAPC. E Analysis of correlation between paintbrush dynamic stimulation response rate and duration of tactile contact in SIPPC. F Analysis of correlation between paintbrush dynamic stimulation response rate and duration of social  approach in SIAPC. G Analysis of correlation between whisker deflection rate and duration of tactile contact in SIPPC. H Analysis of correlation between whisker deflection rate and duration of social approach in SIAPC (n = 27–32 mice).
Fig. 3
Fig. 3. Brain regions exhibiting significant activation differences between SIPPC, SIAPC, and the control group.
A Difference in the proportion of c-fos-positive cells in the brain between SIPPC and SIAPC. B Difference in the proportion of c-fos-positive cells in the brain between SIPPC and single-housed group. C Difference in the proportion of c-fos-positive cells in the brain between SIAPC and single-housed group. *PFDR < 0.05, **PFDR < 0.01, ***PFDR < 0.001. (n = 5 mice per group, brain regions were divided into major anatomical partitions, as shown on the left side of the figure).
Fig. 4
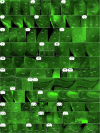
Fig. 4. Brain regions exhibiting significant activation differences between SIPPC, SIAPC, and the control group.
From left to right are the SIPPC, SIAPC, and single-housed group. Full names represented by abbreviations for all brain areas are shown in Table S1, and pictures of immunofluorescence staining of other brain regions are shown in the Supplementary Fig. 3.
Fig. 5
Fig. 5. Venn diagram of the relationship between activated brain areas in different groups.
Differences in the coordination of activity between SIPPC and SIAPC.
Fig. 6
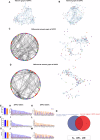
Fig. 6. Differences in coordinated brain activity during SIPPC and SIAPC.
A List of certain regions where the mean r value of the SIPPC group is higher than that of the SIAPC group. B List of certain regions where the mean r value of the SIPPC group is lower than that of the SIAPC group. C Venn diagram of the relationship between regions of increased activation and regions of increased coordination in the SIPPC group. *P < 0.05; ** P < 0.01; ***P < 0.001.
Fig. 7
Fig. 7. Analysis of brain functional networks involved in SIPPC and SIAPC.
A Functional connectivity network in the brain during SIPPC. B Functional connectivity network in the brain during SIAPC. C Differential network of SIPPC. D Differential network of SIAPC. E Comparison of the mean differences in brain network degree centrality between the two groups. F Comparison of the mean differences in betweenness centrality between the two groups. G Comparison of the mean differences in node efficiency of the diencephalon network between the two groups. H Brain regions with higher degree centrality in the SIPPC group than in the SIAPC group. I Brain regions with higher betweenness centrality in the SIPPC group than in the SIAPC group. J Brain regions with higher node efficiency in the SIPPC group than in the SIAPC group. K Brain regions with lower degree centrality in the SIPPC group than in the SIAPC group. L Brain regions with lower betweenness centrality of the SIPPC group than in the SIAPC group. M Brain regions with lower node efficiency of the SIPPC group than the SIAPC group. N Venn diagram illustrating the relationship between regions exhibiting enhanced activation and coordination in the SIPPC, alongside key brain regions associated with the SIPPC network. Error bars, standard error of the mean.
Fig. 8
Fig. 8. In vivo fiber-optic calcium imaging records the activation differences in the key brain regions and circuit between SIPPC and SIAPC.
A–D Representative images of viral expression in brain regions. E Illustration of calcium imaging recording in IL response to SIPPC (left) and SIAPC (right). F Heatmap showing Ca2+ responses elicited by SIPPC (left) and SIAPC (right) in IL. G Illustration of calcium imaging recording in AIV response to SIPPC (left) and SIAPC (right). H Heatmap showing Ca2+ responses elicited by SIPPC (left) and SIAPC (right) in AIV. I Illustration of calcium imaging recording in LSI response to SIPPC (left) and SIAPC (right). J Heatmap showing Ca2+ responses elicited by SIPPC (left) and SIAPC (right) in LSI. K Illustration of calcium imaging recording in AIV–LSI circuit response to SIPPC (left) and SIAPC (right). L Heatmap showing Ca2+ responses elicited by SIPPC (left) and SIAPC (right) in AIV–LSI circuit. M Differences in calcium signal peaks of IL neurons induced by distinct behaviors. N Differences in calcium signal peaks of AIV neurons induced by distinct behaviors. O Differences in calcium signal peaks of LSI neurons induced by distinct behaviors. P Differences in calcium signal peaks of AIV–LSI circuit induced by distinct behaviors. n = 3 mice per group. Scale bar, 100 μm. *P < 0.05, **P < 0.01, ***P < 0.001, ****P < 0.0001. Error bars, standard error of the mean.
Fig. 9
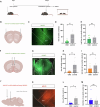
Fig. 9. Chemogenetic inhibition of AIV/LSI or AIV–LSI circuit reduces the tactile contact behaviors during SIPPC.
A Experimental protocols for evaluating the impact of inhibiting AIV/LSI brain regions or the AIV–LSI circuit on social behavior in SIPPC. B Schematic of bilateral virus infection in AIV. C Representative images of viral placements in AIV. D Period of tactile contact during SIPPC. E Period of non-tactile contact during SIPPC (n = 6 mice per group). F Schematic of bilateral virus infection in LSI. G Representative images of viral placements in LSI. H Period of tactile contact during SIPPC. I Period of non-tactile contact during SIPPC (n = 8 mice per group). J Schematic of bilateral virus infection in AIV/LSI. K Representative images of viral placements in AIV. L Period of tactile contact during SIPPC. M Period of non-tactile contact during SIPPC (n = 7 mice per group). Scale Bar, 100 μm. Error bars, standard error of the mean.

Similar articles

References

    1. O Miguel, H. et al. Touch processing and social behavior in ASD. Zenodo10.1007/s10803-017-3163-8 (2017). - PubMed
    1. Mello, M., Fusaro, M., Aglioti, S. M. & Minio-Paluello, I. Exploring social touch in autistic and non-autistic adults via a self-report body-painting task: the role of sex, social context and body area. Zenodo10.1177/13623613231218314 (2024). - PubMed
    1. Ahmadi, B. B. M., Afarinesh, M. R., Jafaripour, L. & Sheibani, V. Alteration in social interaction and tactile discrimination of juvenile autistic-like rats following tactile stimulation and whisker deprivation. Zenodo10.1002/brb3.2993 (2023). - PMC - PubMed
    1. Pan, L. et al. A short period of early life oxytocin treatment rescues social behavior dysfunction via suppression of hippocampal hyperactivity in male mice. Zenodo10.1038/s41380-022-01692-7 (2022). - PMC - PubMed
    1. Ma, Y. K. et al. Lack of social touch alters anxiety-like and social behaviors in male mice. Zenodo10.1080/10253890.2022.2047174 (2022). - PubMed

Substances

LinkOut - more resources