. 2025 Jul 2;15(1):23434.
doi: 10.1038/s41598-025-05881-6.

Loss of endothelial ZEB2 in mice attenuates steatosis early during metabolic dysfunction-associated steatotic liver disease

Affiliations

Loss of endothelial ZEB2 in mice attenuates steatosis early during metabolic dysfunction-associated steatotic liver disease

Wouter Dheedene et al. Sci Rep. .

Abstract

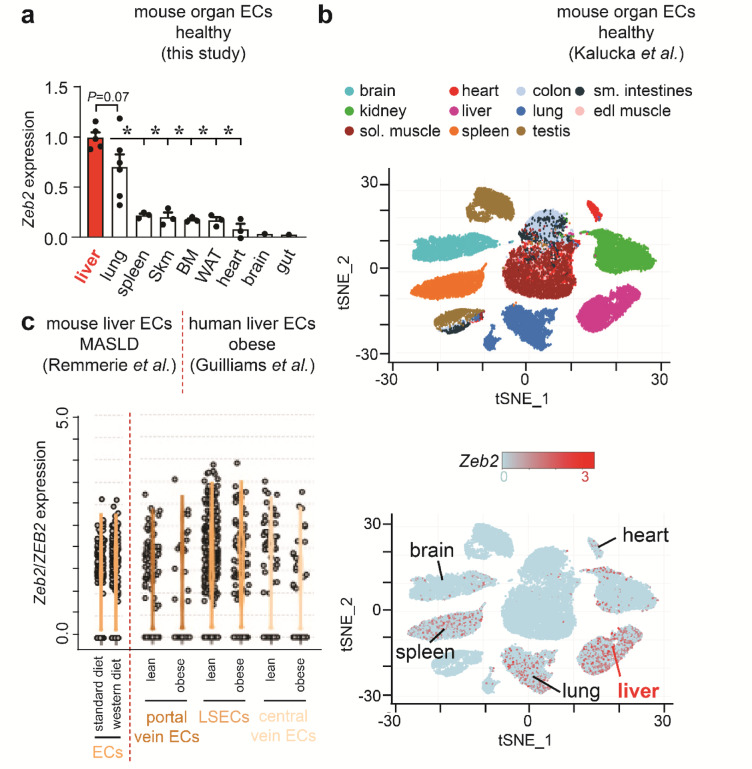
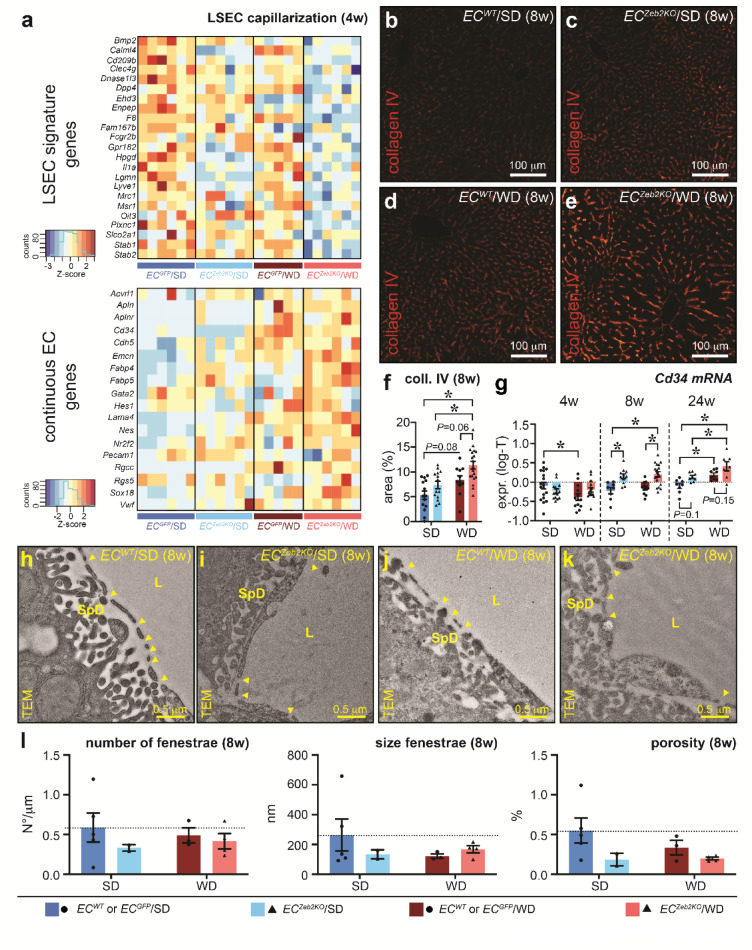
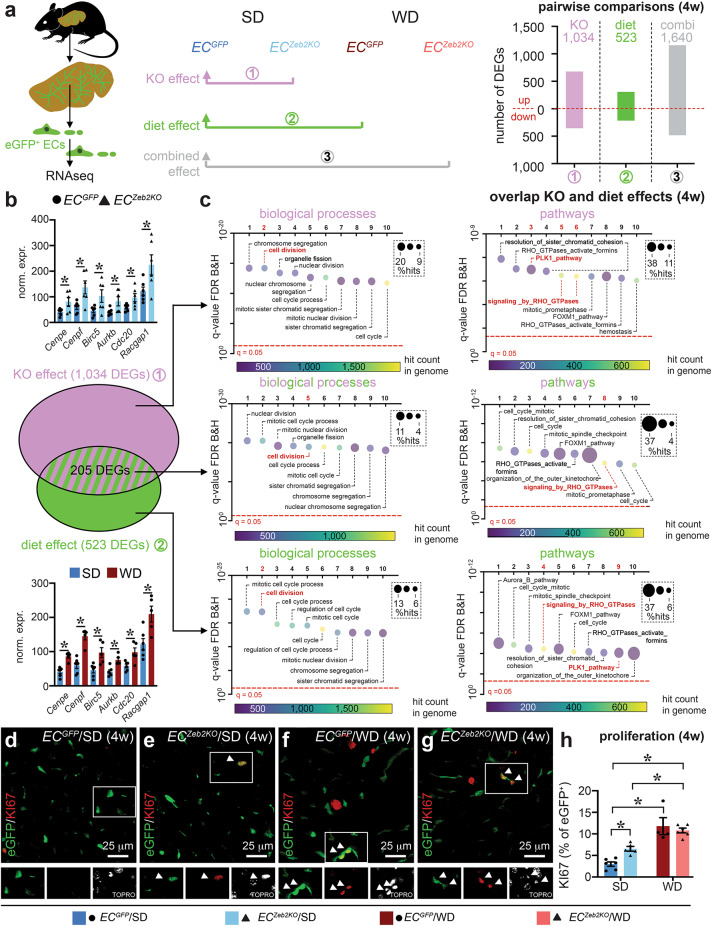
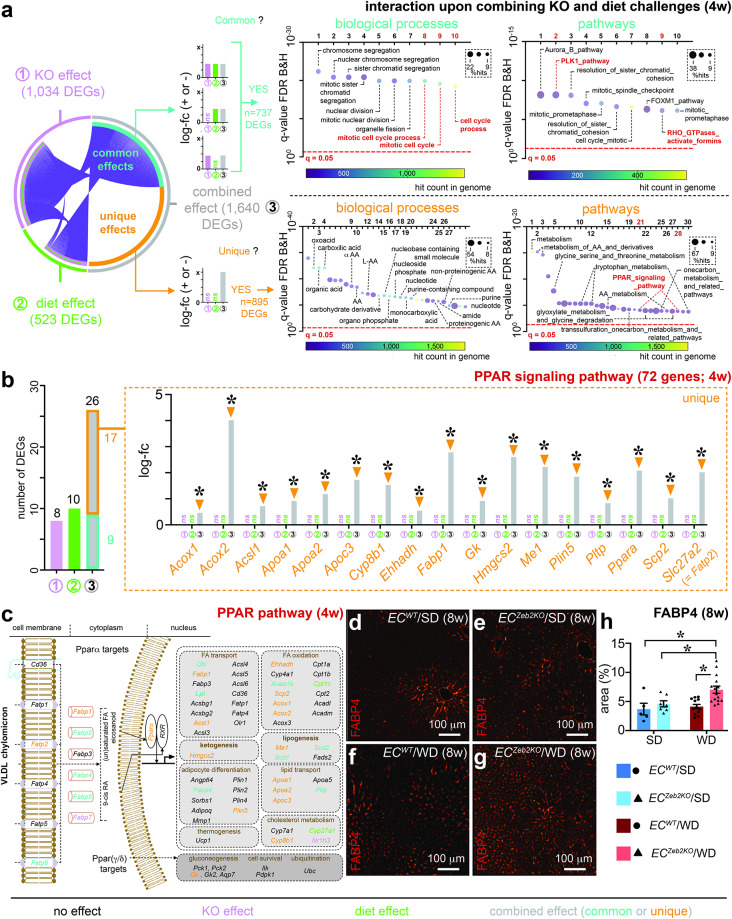
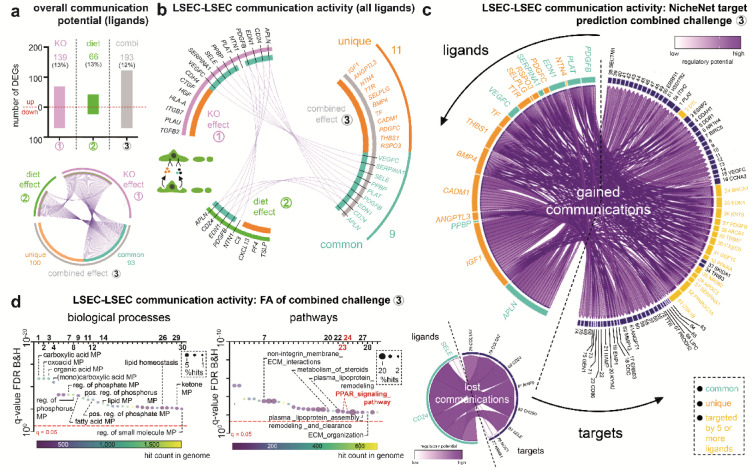
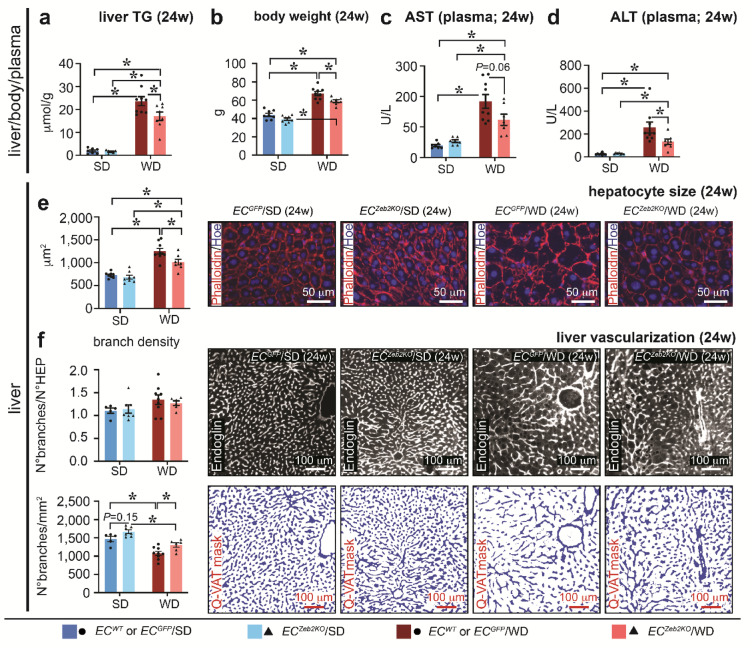
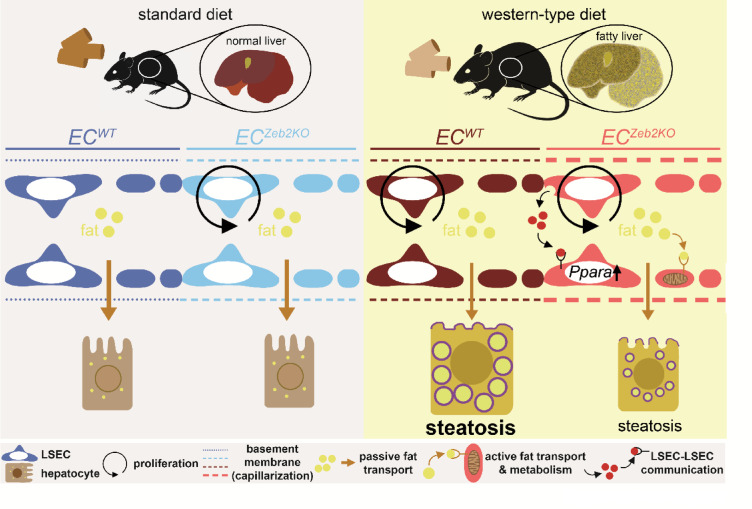
Metabolic dysfunction-associated steatotic liver disease (MASLD), formerly known as non-alcoholic fatty liver disease, features liver sinusoidal endothelial cell (LSEC) alterations with ill-defined driving factors. Zinc-Finger E-Box-binding Homeobox (ZEB)2 in LSECs preserves their specialized features, prevents capillarization and protects against liver fibrosis. To investigate a potential protective role against steatosis, the initial MASLD stage, we fed EC-specific Zeb2 knockout (ECZeb2KO) mice a western-type diet (WD). In healthy and steatotic wild-type livers, Zeb2 was ubiquitously and similarly expressed across blood-vascular EC types. LSEC RNA sequencing revealed ZEB2 deficiency-triggered expression changes greatly overlapping with those evoked by WD-feeding. Endothelial ZEB2-loss and WD-feeding interacted to boost capillarization and fat metabolism, shown by increased expression of continuous EC markers and peroxisome proliferator-activated receptor (PPAR)α signaling components, respectively. Altered communication among LSECs after combined endothelial ZEB2-loss and WD-exposure revealed similar functional repercussions. Endothelial ZEB2-loss eventually corrected WD-induced liver hypo-vascularization while ameliorating hepatic damage and steatosis. Thus, endothelial ZEB2-loss amplifies WD-induced LSEC fat metabolism and capillarization, while decreasing steatosis, in part through altered LSEC-LSEC communication. The disease-promoting role of endothelial ZEB2 in early MASLD as opposed to its protective role in fibrosis underscores a context-dependent effect in liver disease.

Keywords: Capillarization; Liver sinusoidal endothelial cells; Metabolic dysfunction-associated steatotic liver disease; Peroxisome Proliferator-Activated receptor alpha; Zinc-finger E-Box-binding Homeobox 2.


Conflict of interest statement

Declarations. Competing interests: The authors declare no competing interests.

Figures

Fig. 1
Fig. 1
Zeb2 is ubiquitously expressed in blood vascular endothelium of healthy and fatty livers. (a) Zeb2 mRNA expression in endothelial cells (ECs) isolated by FACS from ECGFP organs (n = 1–6). Skm: skeletal muscle; BM: bone marrow; WAT: white adipose tissue. (b) t-distributed Stochastic Neighbor Embedding (tSNE) plots extracted from Kalucka et al. showing the EC fraction of different organs of healthy adult mice (top) and their corresponding Zeb2 mRNA expression (bottom). (c) Violin plots extracted from the scRNAseq dataset of the CD45-negative fraction from Remmerie et al. (left) showing Zeb2 mRNA expression in liver ECs from mice exposed to standard (SD; n = 1) or western-type diet (WD, representing a pool of 2 mice, exposed to diet for 24 or 36 weeks) and extracted from Guilliams et al. (right) showing ZEB2 mRNA expression in liver EC populations from lean and obese humans. LSECs: liver sinusoidal ECs; sol.: soleus; edl: extensor digitorum longus; sm.: small. Quantitative data are expressed as mean ± s.e.m; *P < 0.05 vs. indicated condition by one-way ANOVA with Tukey post-hoc test.
Fig. 2
Fig. 2
ECZeb2KO amplifies WD-induced LSEC capillarization early during MASLD. (a) Heatmaps with genes in alphabetical order showing color-coded z-scores of normalized RNAseq data of liver sinusoidal EC (LSEC) signature genes (top) and continuous EC genes (bottom) in LSECs sorted from mouse livers belonging to the indicated condition after 4 weeks (w) of standard (SD) or western-type diet (WD). (bf) Liver cross-sections of ECWT (b,d) or ECZeb2KO (c,e) mice after 8w of SD (b,c) or WD (d,e) stained for collagen (coll.)-type IV (red) and corresponding quantification (f) of collagen type IV expression presented as area % (n = 10 ECWT/4 ECGFP/14 ECZeb2KO for SD; n = 11 ECWT/0 ECGFP/19 ECZeb2KO for WD). (g) mRNA expression (presented as log-transformed or ‘log-T’ data) of capillarization marker Cd34 in whole livers from ECWT/ECGFP or ECZeb2KO mice after 4w (n = 4 ECWT/14 ECGFP/14 ECZeb2KO for SD; n = 0 ECWT/13 ECGFP/18 ECZeb2KO for WD), 8w (n = 5 ECWT/3 ECGFP/11 ECZeb2KO for SD; n = 11 ECWT/0 ECGFP/18 ECZeb2KO for WD) and 24w (n = 3 ECWT/5 ECGFP/8 ECZeb2KO for SD; n = 4 ECWT/4 ECGFP/7 ECZeb2KO for WD) of SD or WD. (hl) Representative transmission electron microscopy (TEM) images showing fenestrae (indicated by yellow arrowheads) in sinusoids of ECWT (h,j) or ECZeb2KO (i,k) mice after 8w of SD (h,i) or WD (j,k) and corresponding quantification of the average number of fenestrae (l, left), size of fenestrae (l, middle) and porosity (l, right; n = 1 ECWT/4 ECGFP/2 ECZeb2KO for SD; n = 1 ECWT/2 ECGFP/4 ECZeb2KO for WD). SpD: Space of Disse; L: lumen. Quantitative data are expressed as mean ± s.e.m. *: P < 0.05 vs. indicated condition by two-way ANOVA with Tukey post-hoc test. Pictures in (be) were taken with an EC Plan-Neofluar 10x/0.30 M27 objective on a Zeiss Axio Imager Z1 equipped with an AxiocamMRc5 and Axiovision software. Pictures in (hk) were taken with a JEOL JEM1400 microscope.
Fig. 3
Fig. 3
ECZeb2KO and WD-exposure both induce LSEC proliferation early during MASLD. (a) Schematic diagram of the RNAseq set-up (left), overview of (3) pairwise comparisons (middle) and quantification of the number of differentially expressed genes (DEGs) per comparison (right) at 4 weeks (w) of standard diet (SD) or western-type diet (WD). A red dotted line separates the up-and downregulated number of DEGs (total number is indicated on top of bars). Combi: combined challenge. (b) Venn diagram (middle) showing overlap (205 DEGs with expression changes in the same direction) between DEGs from the knockout (KO; comparison 1 in purple) and the diet effect (comparison 2 in green) and expression of representative DEGs (normalized data; corresponding to functional terms highlighted in red in panel (c); n = 5–6) extracted from comparison 1 (top) and 2 (bottom). (c) Functional annotation analysis on the combined up- and downregulated DEGs. Bubble plots represent the top 10 functional terms (biological processes on the left, pathways on the right) ranked according to false discovery rate (FDR) related to comparison 1 (top), comparison 2 (bottom) and the overlap between comparison 1 and 2 (middle). Significance level in (c) indicated by red dotted lines. All quantitative data are also shown in Supplementary Table 1. (d-h) Liver cross-sections of ECGFP (d,f) or ECZeb2KO (e,g) mice after 4w of SD (d,e) or WD (f,g) co-stained for eGFP (green) and KI67 (red) and corresponding quantification (h) of proliferating cells (indicated by white arrowheads) expressed as % KI67+ cells (n = 4–6). Single-color images of the delineated inset are shown below each panel. Quantitative data are expressed as mean ± s.e.m; Panel (b): *: FDR (false discovery rate) < 0.05 vs. indicated condition by differential gene expression analysis with applying negative binomial general linear model approach and Benjamini-Hochberg multiple testing correction. Panel (h) *: P < 0.05 by two-way ANOVA with Tukey post-hoc test. Pictures in (d–g) were taken with a Plan-Apochromat 40x/1.3 Oil DIC M27 objective on a Zeiss LSM 700 AxioObserver Z1 equipped with an LSM T-PMT detector and ZEN software.
Fig. 4
Fig. 4
ECZeb2KO and WD-exposure interact to affect endothelial lipid metabolism. (a) Circos plot (left) showing overlap (‘common’, i.e., genes with expression changes in the same direction; turquoise) or not (‘unique’; orange) between DEGs from comparison 1 or 2 (single challenges: purple or green) and comparison 3 (combined challenge: gray). Schematic expression patterns for common or unique genes across single and combined challenges are shown next to the circos plot. Functional terms derived from the combined up- and downregulated DEGs (full list: see Supplementary Table 1 for common (top) or unique (bottom) DEGs are plotted as bubble plots representing top 10 or 30 biological processes (middle) and pathways (right) ranked according to false discovery rate (FDR). Pathways of interest are highlighted in red. Significance level in bubble plots is indicated by red dotted lines. (b) Quantitative analysis of DEGs from the functional term ‘PPAR_signaling_pathway’ showing number of genes that emerged as differentially expressed from comparison 1, 2 or 3 (left) and expression changes (expressed as log-fc) for DEGs with a ‘unique’ profile (indicated by arrowheads; right). *P < 0.05 vs. no challenge. Statistical analyses were performed according to pairwise comparisons related to single or combined challenges as indicated. Ns: not significant. (c) Schematic representation (bottom-left) shows cellular localization and function of all 72 PPAR signaling pathway genes color-coded according to their DEG status (black: not differentially expressed; purple or green: DEG from comparison 1 or 2, respectively; orange or turquoise: unique or common DEG from comparison 3). (dh) Liver cross-sections of ECWT (d,f) or ECZeb2KO (e,g) mice after 8 weeks (w) of SD (d,e) or WD (f,g) stained for FABP4 (red) and corresponding quantification (h) of FABP4 expression plotted as area % (n = 5–15). Quantitative data are expressed as mean ± s.e.m. *: P < 0.05 vs. indicated condition by two-way ANOVA with Tukey post-hoc test. Pictures in (dg) were taken with an EC Plan-Neofluar 10x/0.30 M27 objective on a Zeiss Axio Imager Z1 equipped with an AxiocamMRc5 and Axiovision software. Data in all panels, except for (dh) correspond to 4w of diet exposure. VLDL: very low-density lipoprotein, RA: retinoic acid, FA: fatty acid.
Fig. 5
Fig. 5
ECZeb2KO and WD-exposure interact in altering LSEC-LSEC communication during MASLD. (a) Diagram showing quantification of the number of differentially expressed genes (DEGs) encoding highly likely secreted proteins per comparison (top). A red line separates the up-and downregulated number of DEGs (total number is indicated on top of bars). Combi: combined challenge; SD: standard diet; WD: western-type diet. The bottom panel shows a circos plot representing overlap (turquoise; 93 DEGs representing common genes) or not (‘unique’; orange; 100 DEGs) between DEGs from comparison 1 or 2 (single challenges in purple and green, respectively) and comparison 3 (combined challenge in gray). (b) Circos plot based on the RNAseq dataset generated in the current paper summarizing communication activity based on LSEC ligands communicating with LSECs extracted by NicheNet and representing overlap (turquoise; 9 ligands representing common genes in the combined challenge compared to the single challenges) or not (orange; 11 unique ligands) between upregulated ligands from comparison 1 or 2 (single challenges in purple and green, respectively) and comparison 3 (combined challenge in gray). (c) NicheNet plots showing predicted targets downstream of (unique in orange or common in turquoise) ligands that were altered upon the combined knockout and diet challenge. The large plot corresponds to ligands (n = 18) upregulated by the combined challenge (i.e., gained communications), the small plot corresponds to ligands (n = 2) downregulated by the combined challenge (i.e., lost communications). Targets that are connected to at least 5 ligands are highlighted in yellow. Target numbers correspond to those shown in Supplementary Fig.S8. (d) Bubble plots representing the top 30 functional terms (biological processes on the left, pathways on the right) ranked according to false discovery rate (FDR) related to all (common and unique) ligands + associated target genes from panel (c). A full list of top 30 functional terms is shown in Supplementary Table 2. Significance levels are indicated by red dotted lines. MP: metabolic process.
Fig. 6
Fig. 6
ECZeb2KO attenuates WD-induced liver damage, steatosis and hypo-vascularization. (a–d) Quantification of liver triglyceride levels (a; n = 2 ECWT/5 ECGFP/6 ECZeb2KO for SD; n = 4 ECWT/5 ECGFP/7 ECZeb2KO for WD), body weight (b; n = 3 ECWT/5 ECGFP/8 ECZeb2KO for SD; n = 4 ECWT/5 ECGFP/7 ECZeb2KO for WD), plasma liver enzyme levels (c: aspartate transaminase (AST, left; n = 2 ECWT/5 ECGFP/7 ECZeb2KO for SD; n = 4 ECWT/5 ECGFP/7 ECZeb2KO for WD) and; d: alanine transaminase (ALT, right; n = 3 ECWT/5 ECGFP/7 ECZeb2KO for SD; n = 4 ECWT/5 ECGFP/7 ECZeb2KO for WD) of mice from the indicated conditions after 24 weeks (w) of standard diet (SD) or western-type diet (WD). (e) Diagram showing quantification of hepatocyte size after 24w of SD or WD (left). The right inset panels show images of liver cross-sections stained with Rhodamine-Phalloidin to label cell contours for all 4 conditions (n = 3 ECWT/5 ECGFP/8 ECZeb2KO for SD; n = 4 ECWT/5 ECGFP/7 ECZeb2KO for WD). Nuclei are counterstained with Hoechst (blue). (f) Quantification of liver vascular branch density (expressed as branch/hepatocyte ratio (top left) or number/area in mm2 (bottom left)) after 24w of SD or WD (n = 3 ECWT/2 ECGFP/7 ECZeb2KO for SD; n = 4 ECWT/5 ECGFP/6 ECZeb2KO for WD). The inset panels on the right show representative images of ENDOGLIN-stained cross-sections (white; top) and corresponding vascular masks (blue; bottom) generated by Q-VAT (Quantitative Vascular Analysis Tool) software for all 4 conditions. Quantitative data are expressed as mean ± s.e.m; *P < 0.05 vs. indicated condition by two-way ANOVA with Tukey post-hoc test. Statistical testing for ALT was performed on the log-transformed data. Pictures in e were taken with an EC Plan-Neofluar 20x/0.50 M27 objective on a Zeiss Axio Imager Z1 equipped with an AxiocamMRc5 and Axiovision software. Pictures in f were taken with a Plan Apo 20x (NA 0.75) objective on a Nikon Eclipse Ni-E with Marzhauser Slide Express 2 equipped with a Hamatsu Orca Flash 4.0 camera and NIS Elements software.
Fig. 7
Fig. 7
Graphical summary. Mice deficient for ZEB2 specifically in their endothelial cells (ECZeb2KO), and their wild-type control littermates (ECWT), were randomized to standard or western-type diet (WD), the former to look at normal conditions, the latter to mimic the fatty liver stage of metabolic dysfunction-associated steatotic liver disease. Pairwise comparisons of these four conditions revealed that exposure to WD caused genotype-dependent or independent changes in liver sinusoidal endothelial cells (LSECs), more specifically in capillarization, proliferation, and also expression profiles including Ppara, the latter uniquely induced by combined ECZeb2KO and WD challenge. The most prominent change in the absence of endothelial ZEB2 was the induction of gene expression related to active lipid transport and metabolism in LSECs governed by LSEC-to-LSEC PPARα-dependent signaling, hypothetically resulting in reduced fat transfer to hepatocytes and less steatosis.

Similar articles

References

    1. Aird, W. C. Phenotypic heterogeneity of the endothelium: II. Representative vascular beds. Circ. Res.100, 174–190. 10.1161/01.RES.0000255690.03436.ae (2007). - PubMed
    1. de Haan, W. et al. Unraveling the transcriptional determinants of liver sinusoidal endothelial cell specialization. Am. J. Physiol. Gastrointest. Liver Physiol.318, G803–G815. 10.1152/ajpgi.00215.2019 (2020). - PMC - PubMed
    1. Hammoutene, A. & Rautou, P. E. Role of liver sinusoidal endothelial cells in non-alcoholic fatty liver disease. J. Hepatol.70, 1278–1291. 10.1016/j.jhep.2019.02.012 (2019). - PubMed
    1. Shahani, T. et al. Human liver sinusoidal endothelial cells but not hepatocytes contain factor VIII. J. Thromb. Haemost. 12, 36–42. 10.1111/jth.12412 (2014). - PubMed
    1. Sorensen, K. K. et al. The scavenger endothelial cell: a new player in homeostasis and immunity. Am. J. Physiol. Regul. Integr. Comp. Physiol.303, R1217–1230. 10.1152/ajpregu.00686.2011 (2012). - PubMed

MeSH terms

Substances

Grants and funding