. 2025 Jul 2;15(1):23191.
doi: 10.1038/s41598-025-04845-0.

Ionizing radiation triggers the release of mitochondrial DNA into the cytosol as a signal of mitochondrial damage

Affiliations

Ionizing radiation triggers the release of mitochondrial DNA into the cytosol as a signal of mitochondrial damage

Tsutomu Shimura et al. Sci Rep. .

Abstract

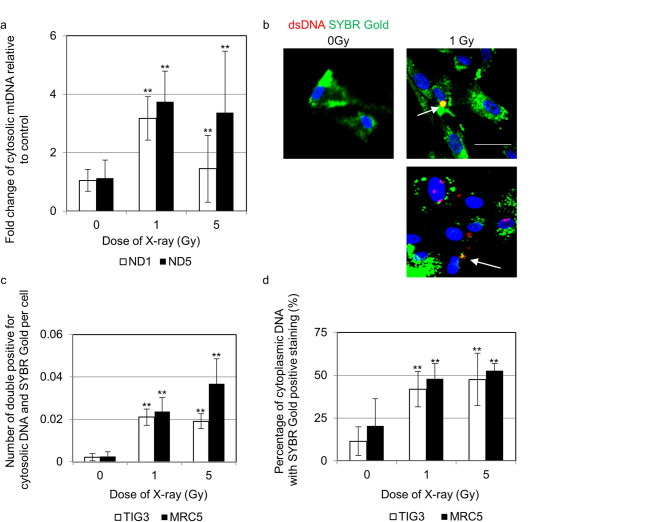
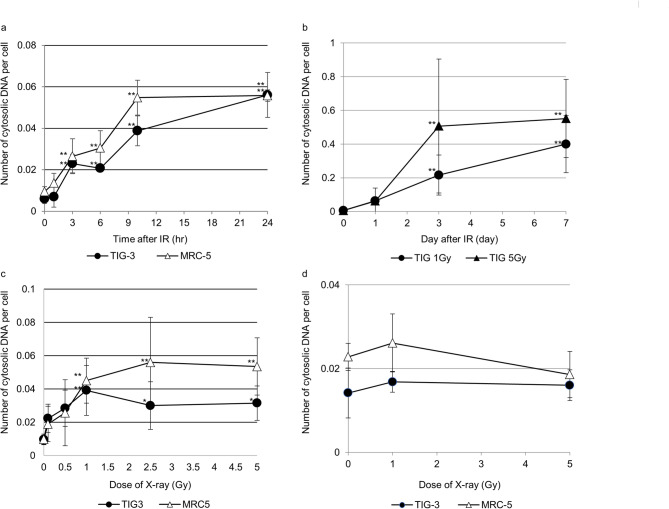
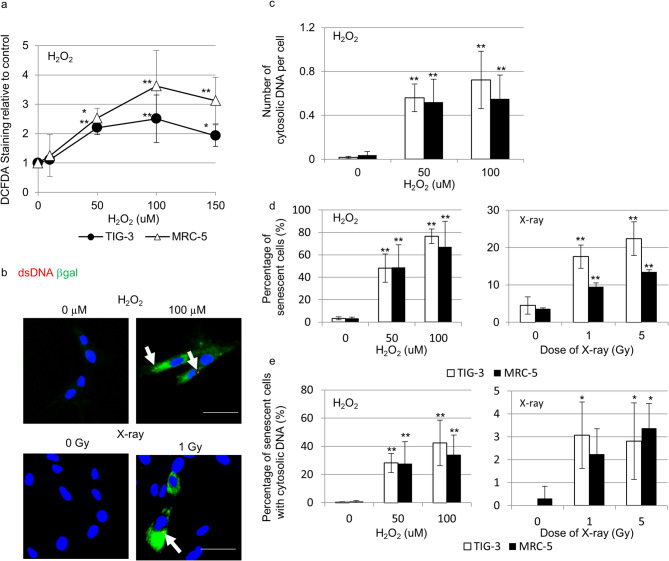
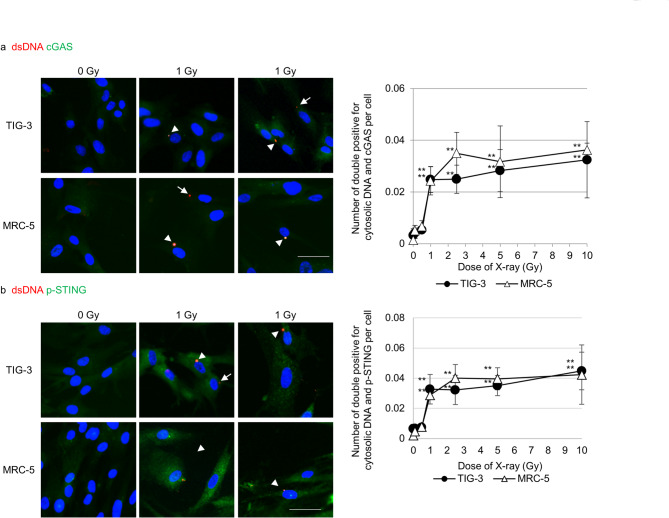
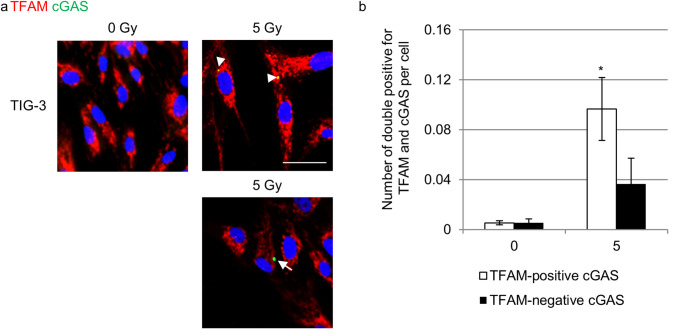
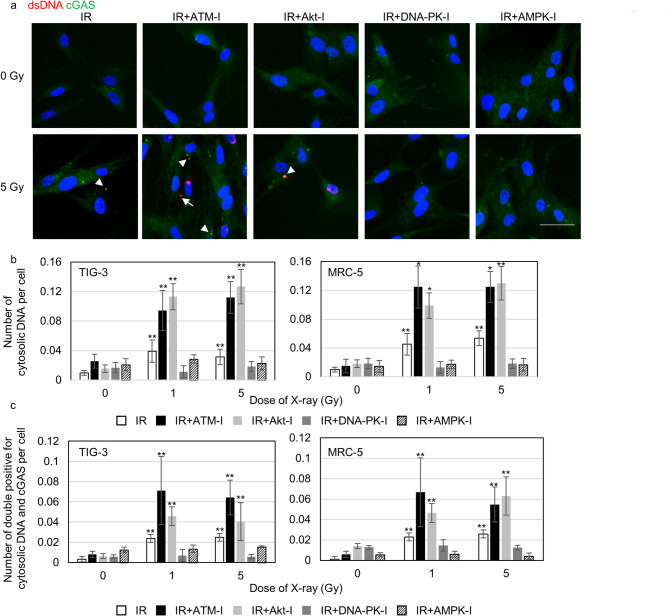
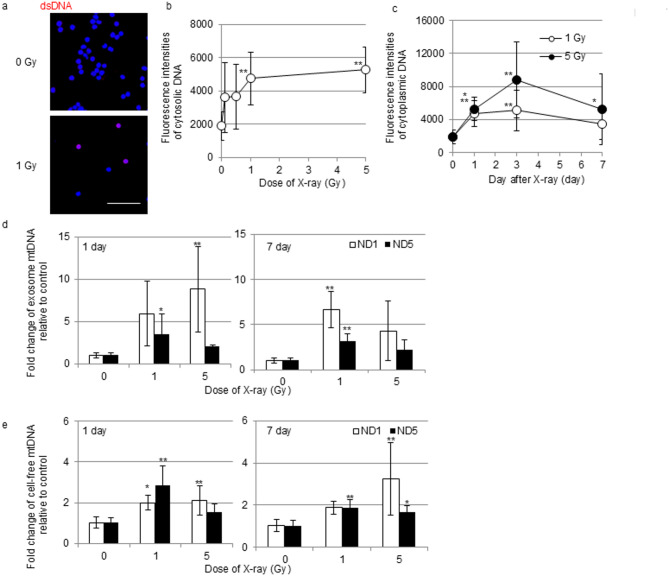
Inflammatory responses are crucial for repairing radiation-induced tissue damage. Excessive tissue remodeling in response to severe tissue injury causes chronic inflammation associated with various diseases including cardiovascular disease and cancer. Fibroblasts are major components of the stroma and play key roles in tissue remodeling. However, causes of inflammatory response activation remain unclear. This study focused on cytosolic mitochondrial DNA (mtDNA) release and its role in inflammation following irradiation. Cytosolic mtDNA leakage increased 3 h after irradiation of normal human fibroblasts and persisted for at least 7 days. H2O2 treatment of fibroblasts increased reactive oxygen species (ROS) levels, the number of cytosolic DNA per cell, and the number of senescent cells, indicating that ROS trigger cytosolic DNA release in association with cellular senescence. The cytosolic mtDNA was then recognized by the DNA sensor cyclic GMP-AMP synthase (cGAS), activating the cGAS/stimulator of interferon genes (STING) signaling pathway. DNA-PK and AMPK inhibitors prevented cytosolic mtDNA release and its colocalization with cGAS following irradiation. Cytosolic and extracellular mtDNA release was also induced in mouse upon whole-body irradiation. Our results demonstrated that mitochondrial damage signals spread throughout the body via exosomes or as cell-free DNA. Released mtDNA act as danger signals that trigger inflammation.

Keywords: Cytosolic DNA; Exosome; Mitochondrial DNA; Radiation; cGAS.


Conflict of interest statement

Competing interests: The authors declare no competing interests.

Figures

Fig. 1
Fig. 1
mtDNA release in the cytoplasm following irradiation. (a) Cytosolic mtDNA levels were measured via qPCR using primers for mitochondrial genes (ND1 and ND5). DNA was isolated from the cytosolic fraction of cells 24 h after irradiation. The asterisk indicates a significant increase in the amount of cytosolic mtDNA compared with that of nonirradiated control cells. (b) Images of cytosolic DNA staining (red), SYBR Gold staining (green), and nuclear staining (blue) of nonirradiated control and irradiated (1 Gy) TIG-3 cells. The arrow indicates the colocalization of cytosolic DNA with SYBR Gold. Scale bar is 50 μm. (c) The amount of cytosolic DNA stained with SYBR Gold per cell is shown. The asterisk indicates a significant difference from that of nonirradiated control cells (*p < 0.05, **p < 0.01). (d) The ratio of SYBR Gold-stained cytosolic DNA to total cytosolic DNA is shown. The asterisk indicates a significant difference from nonirradiated control cells (*p < 0.05, **p < 0.01).
Fig. 2
Fig. 2
Time course and dose response of radiation-induced cytosolic DNA release. (a) The amount of cytosolic DNA per cell at the indicated time after exposure to radiation. (b) Long-term persistence of cytosolic DNA after irradiation. (c) Dose response of cytosolic DNA release 24 h after irradiation. (d) Effects of low serum concentrations on radiation-induced cytoplasmic DNA release. The asterisk indicates a significant change in the amount of cytosolic DNA compared with nonirradiated control cells (*p < 0.05, **p < 0.01).
Fig. 3
Fig. 3
ROS-mediated cytosolic DNA release and cellular senescence. (a) ROS levels were measured by DCFDA staining of cells treated with H2O2 at the indicated concentrations. The fluorescence intensities of DCFDA were normalized to the control values. The asterisk indicates a significant increase in ROS levels compared with nonirradiated control cells(*p < 0.05, **p < 0.01). (b) Images of β-gal staining (green), cytosolic DNA staining (red) and nuclear staining (blue) following H2O2 treatment or 1-Gy-irradiation of TIG-3 cells. Scale bar is 50 μm. (c) Induction of cytosolic DNA release following H2O2 treatment. The asterisk indicates a significant increase in the amount of cytosolic DNA compared with nonirradiated control cells (*p < 0.05, **p < 0.01). (d) Induction of cellular senescence by H2O2 treatment and X-ray irradiation. The asterisk indicates a significant increase in the percentage of senescent cells compared with nonirradiated control cells. (e) Association between cytosolic DNA and cellular senescence. The asterisk indicates a significant increase in the number of senescent cells harboring cytosolic DNA compared with nonirradiated control cells (*p < 0.05, **p < 0.01).
Fig. 4
Fig. 4
Activation of cGAS/STING signaling by radiation-induced cytosolic DNA. (a) Images of cytosolic DNA (red), cGAS (green), and nuclear (blue) staining of nonirradiated control and 1-Gy-irradiated TIG-3 cells. The arrow and arrowhead indicate cGAS-negative and cGAS-positive cytosolic DNA, respectively. Scale bar is 50 μm. (b) Images of cytosolic DNA (red) and phosphorylated STING (green) staining of nonirradiated control and 1-Gy-irradiated TIG-3 cells. The arrow and arrowhead indicate phosphorylated-STING-negative and phosphorylated-STING-potitive cytosolic DNA, respectively. Scale bar is 50 μm. The number of cells positive for both cytosolic DNA and cGAS or for both cytosolic DNA and phosphorylated STING is shown in the right graphs. The asterisk indicates a significant difference between nonirradiated and irradiated cells in each inhibitor group (*p < 0.05, **p < 0.01).
Fig. 5
Fig. 5
Co-localization of TFAM and cGAS in irradiated cells. (a) Images of TFAM (red), cGAS (green), and nuclear (blue) staining of nonirradiated control and 5-Gy-irradiated TIG-3 cells. The arrow and arrowhead indicate TFAM-negative and TFAM-positive cGAS, respectively. Scale bar is 50 μm. (b) The number of cells positive for both TFAM and cGAS is shown in the right graphs. The asterisk indicates a significant increase in in the number o cGAS in irradiated cells compared to nonirradiated cells (*p < 0.05, **p < 0.01).
Fig. 6
Fig. 6
Suppression of radiation-induced colocalization of cytosolic DNA with cGAS by inhibiting DNA-PK or AMPK. (a) Images of cytosolic DNA (red), cGAS (green) and nuclear (blue) staining in the indicated TIG-3 cell samples. Cells were treated with the indicated inhibitors for 2 h before irradiation. Scale bar is 50 μm. (b) The amount of cytosolic DNA per cell is shown in the graph. The asterisk indicates a significant difference between nonirradiated and irradiated cells in each inhibitor group (*p < 0.05, **p < 0.01). (c) The number of cells positive for both cytosolic DNA and cGAS is shown in the graph. The asterisk indicates a significant difference between nonirradiated and irradiated cells in each inhibitor group (*p < 0.05, **p < 0.01).
Fig. 7
Fig. 7
Induction of cytosolic DNA release in mice. (a) Images of cytosolic DNA staining (red) in mouse lymphocytes. Scale bar is 50 μm. (b) Fluorescence intensity of cytosolic DNA staining 1 day following irradiation at the indicated doses. (c) Fluorescence intensity of cytosolic DNA staining at 1, 3, and 7 days post-irradiation. The asterisk indicates a significant increase in the fluorescence intensity of irradiated cells compared with that of nonirradiated control cells (*p < 0.05, **p < 0.01). Exosome mtDNA levels (d) and cell-free mtDNA levels (e) were measured via qPCR using primers for mitochondrial genes (ND1 and ND5). DNA was isolated from non-irradiated and irradiated mouse plasma on day 1 and day 7. The asterisk indicates a significant increase in the amount of exosomal mtDNA or cell-free mtDNA compared with that of nonirradiated control cells.

Similar articles

References

    1. Chovatiya, R. & Medzhitov, R. Stress, inflammation, and defense of homeostasis. Mol. Cell. 54, 281–288. 10.1016/j.molcel.2014.03.030 (2014). - PMC - PubMed
    1. Darby, I. A., Laverdet, B., Bonté, F. & Desmoulière, A. Fibroblasts and myofibroblasts in wound healing. Clin. Cosmet. Invest. Dermatology. 7, 301–311. 10.2147/ccid.s50046 (2014). - PMC - PubMed
    1. Kalluri, R. The biology and function of fibroblasts in cancer. Nat. Rev. Cancer. 16, 582–598. 10.1038/nrc.2016.73 (2016). - PubMed
    1. Shimura, T. et al. Radiation-Induced myofibroblasts promote tumor growth via mitochondrial ROS-Activated TGFβ signaling. Mol. cancer Research: MCR. 16, 1676–1686. 10.1158/1541-7786.mcr-18-0321 (2018). - PubMed
    1. Van Linthout, S., Miteva, K. & Tschöpe, C. Crosstalk between fibroblasts and inflammatory cells. Cardiovascular. Res.102, 258–269. 10.1093/cvr/cvu062 (2014). - PubMed

MeSH terms