

Metagenomics and transcriptomics analysis of aspartame's impact on gut microbiota and glioblastoma progression in a mouse model
- PMID: 40604039
- PMCID: PMC12223035
- DOI: 10.1038/s41598-025-06193-5
Metagenomics and transcriptomics analysis of aspartame's impact on gut microbiota and glioblastoma progression in a mouse model
Abstract
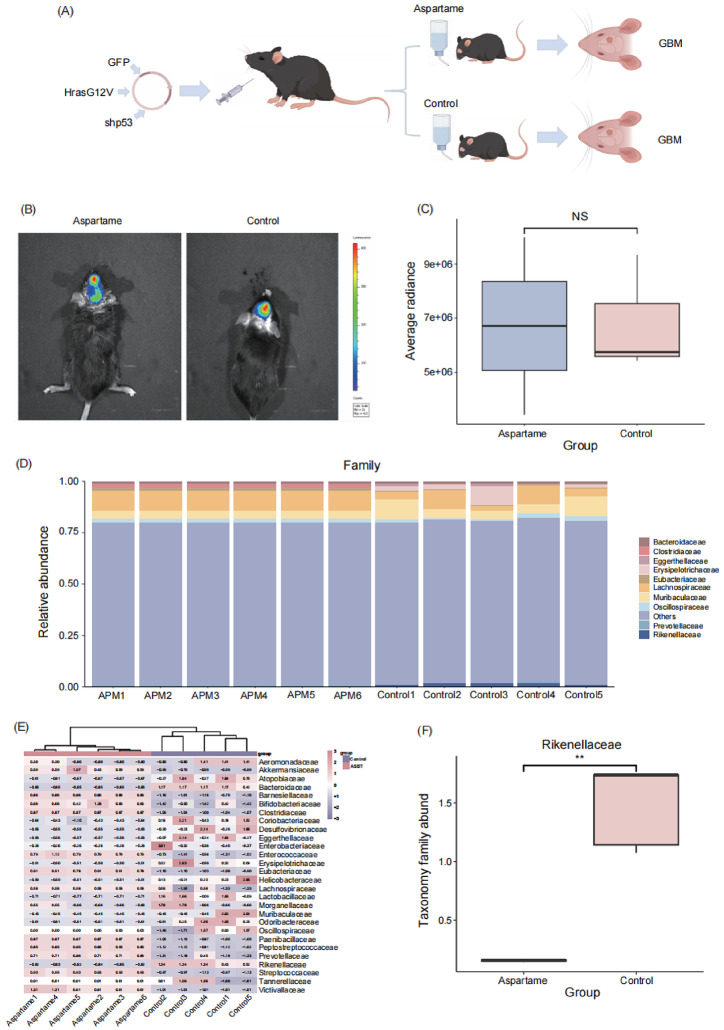
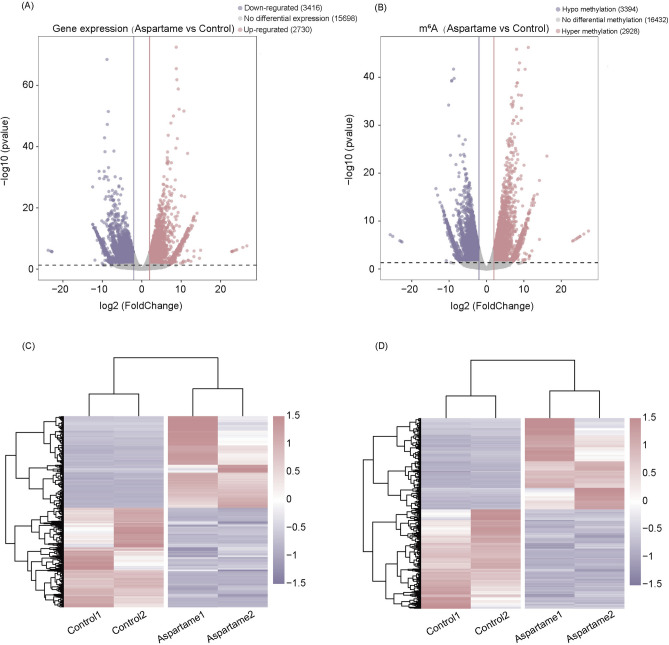
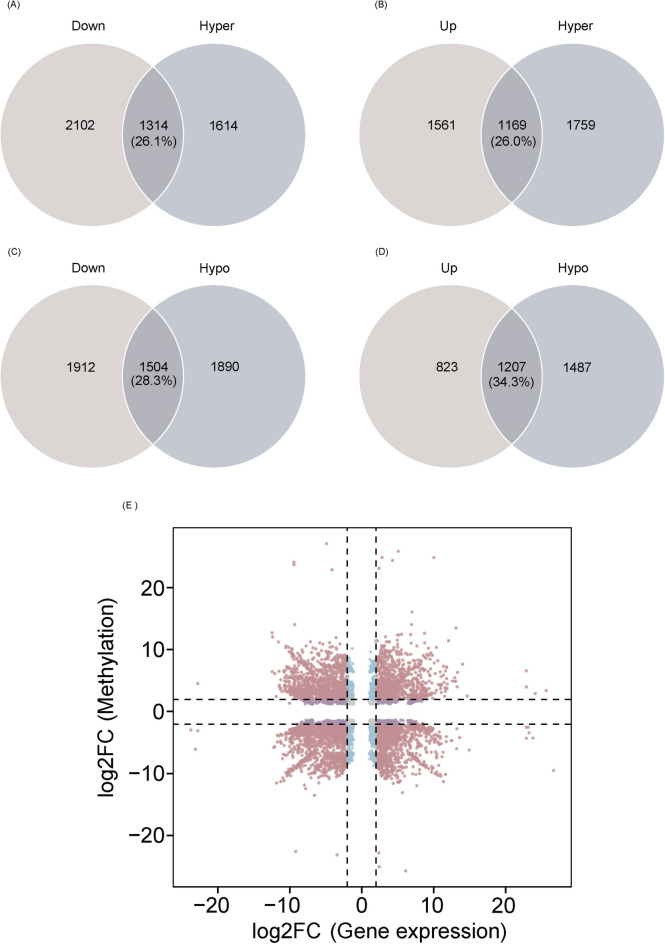
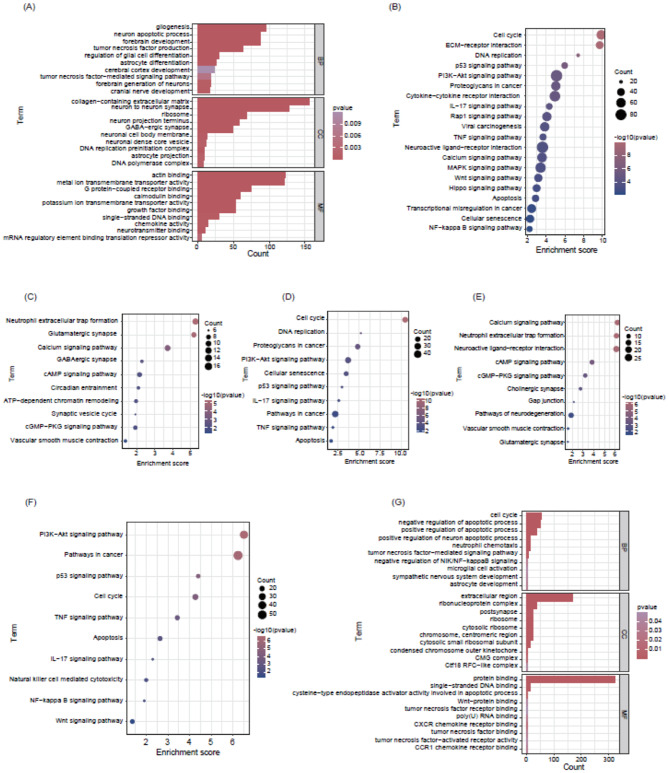
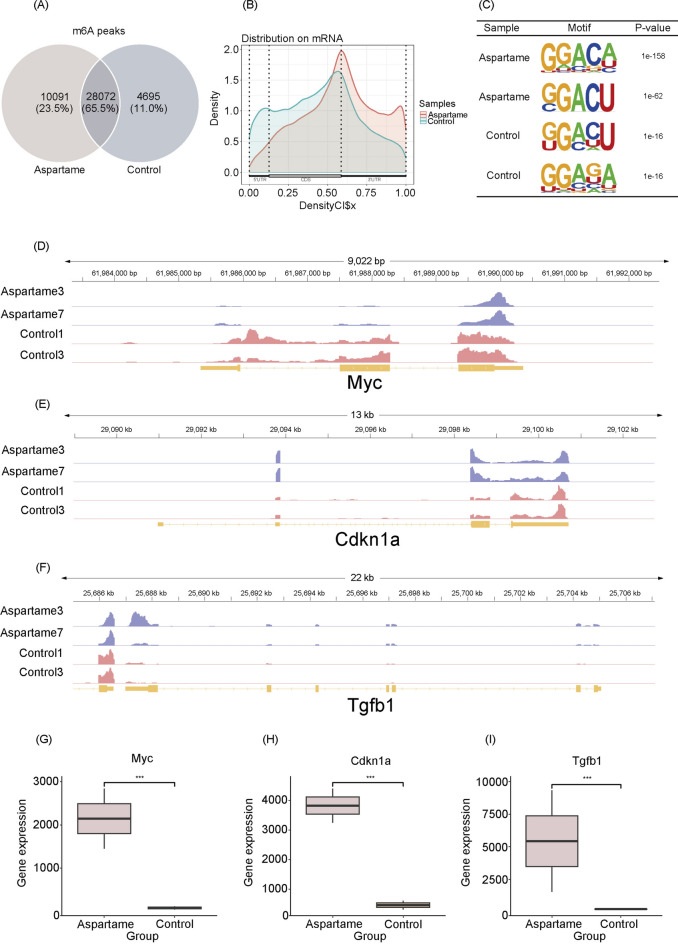
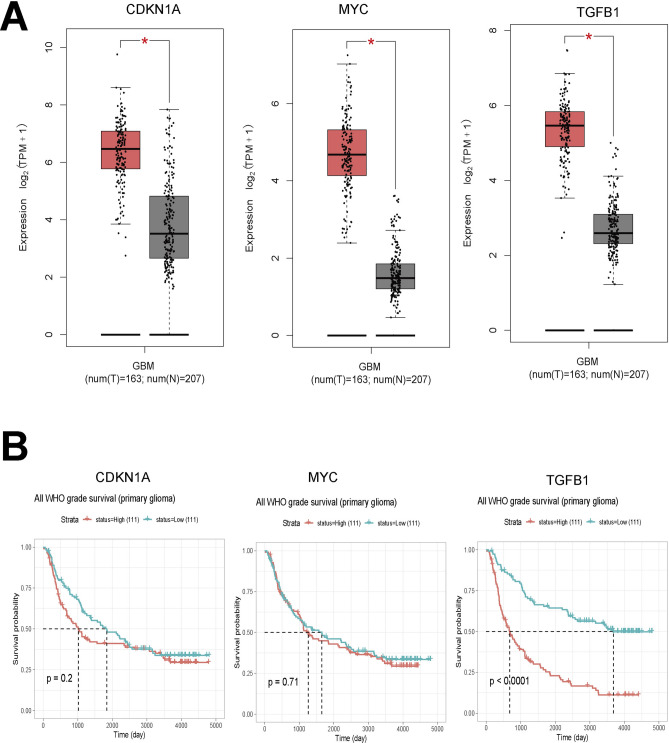
Aspartame, a widely used artificial sweetener, has been extensively studied for its potential health effects. Emerging evidence suggests that aspartame intake may directly impact the composition and function of the intestinal microbiota, which could subsequently influence the risk, progression, and treatment of glioblastoma multiforme (GBM) within the tumor microenvironment. However, it remains unclear whether aspartame intake affects intestinal flora, gene expression, and epigenetic regulation during tumor progression. To address these gaps in knowledge, we conducted a comprehensive metagenomics and transcriptomics analysis of aspartame's impact on gut microbiota and glioblastoma progression in a mouse model. Using a well-established mouse model and a rigorous metagenomics and transcriptomics approach, our results demonstrated that although the aspartame diet did not significantly affect tumor growth, it induced changes in the composition of the gut microbiota, particularly a decrease in the relative abundance of the Rikenellaceae family. Additionally, key N6-methyladenosine (m6A)-regulated genes, such as cyclin-dependent kinase inhibitor 1A (CDKN1A), MYC (myelocytomatosis) oncogene, and transforming growth factor-β (TGFB1), were significantly upregulated in GBM tumors exposed to aspartame. Notably, the expression of TGFB1 (transforming growth factor-β) suggested a critical role in the progression of GBM mediated by aspartame-induced m6A modifications. Our integrative analysis offered novel perspectives on the intricate interplay between dietary aspartame intake, gut microbiota, and tumor biology.
Keywords: Aspartame; Glioblastoma; Metagenomics; N6-methyladenosine; RNA.
© 2025. The Author(s).
Conflict of interest statement
Declarations. Competing interests: The authors declare no competing interests. Ethics approval and consent to participate: This study was reviewed and approved by the Institutional Review Board of Guangxi Medical University (Ethics: 202307007). All methods were carried out in accordance with the relevant guidelines and regulations, and in compliance with the ARRIVE guidelines ( https://arriveguidelines.org ).
Figures
Similar articles
-
Integrated analysis of single-cell RNA-seq and spatial transcriptomics to identify the lactylation-related protein TUBB2A as a potential biomarker for glioblastoma in cancer cells by machine learning.Front Immunol. 2025 Jun 26;16:1601533. doi: 10.3389/fimmu.2025.1601533. eCollection 2025. Front Immunol. 2025. PMID: 40642071 Free PMC article.
-
Aspartame and Its Potential Neurocognitive Effects in Humans.Nutr Rev. 2025 Jul 3:nuaf103. doi: 10.1093/nutrit/nuaf103. Online ahead of print. Nutr Rev. 2025. PMID: 40608001
-
Treatment options for progression or recurrence of glioblastoma: a network meta-analysis.Cochrane Database Syst Rev. 2021 May 4;5(1):CD013579. doi: 10.1002/14651858.CD013579.pub2. Cochrane Database Syst Rev. 2021. PMID: 34559423 Free PMC article.
-
PPAR-γ agonists reactivate the ALDOC-NR2F1 axis to enhance sensitivity to temozolomide and suppress glioblastoma progression.Cell Commun Signal. 2024 May 13;22(1):266. doi: 10.1186/s12964-024-01645-3. Cell Commun Signal. 2024. PMID: 38741139 Free PMC article.
-
Cost-effectiveness of using prognostic information to select women with breast cancer for adjuvant systemic therapy.Health Technol Assess. 2006 Sep;10(34):iii-iv, ix-xi, 1-204. doi: 10.3310/hta10340. Health Technol Assess. 2006. PMID: 16959170
References
-
- Butchko, H. H. et al. Aspartame: Review of safety. Regul. Toxicol. Pharmacol.35(2 Pt 2), S1–S93. 10.1006/rtph.2002.1542 (2002). - PubMed
-
- Magnuson, B. A. et al. Aspartame: A safety evaluation based on current use levels, regulations, and toxicological and epidemiological studies. Crit. Rev. Toxicol.37(8), 629–727. 10.1006/rtph.2002.1542 (2007). - PubMed
-
- Soffritti, M. et al. Aspartame induces lymphomas and leukaemias in ratsa L’aspartame induce linfomi e leucemie nei ratti. Eur. J. Oncol.10(2), 107–116 (2005).
MeSH terms
Substances
Grants and funding
- GNK2023ZX06/Guangxi Academy of Agricultural Science and Technology Development Project
- GK-AA22117015-3/the Guangxi Major Science and Technology Program
- GNK2021YT117/Guangxi Academy of Agricultural Sciences Basic Research Project
- 2019E016/Guangdong 3D Orthopedics Biomimetic Translational Medicine Engineering Technology Research Center
LinkOut - more resources
Full Text Sources
Medical
Miscellaneous
