. 2025 Jul 2;15(1):23330.
doi: 10.1038/s41598-025-06705-3.

DNA-protein cross-links emerge as major contributors to chemotherapeutic cytotoxicity at physiological equitoxic doses

Affiliations

DNA-protein cross-links emerge as major contributors to chemotherapeutic cytotoxicity at physiological equitoxic doses

Mahmoud I Shoulkamy et al. Sci Rep. .

Abstract

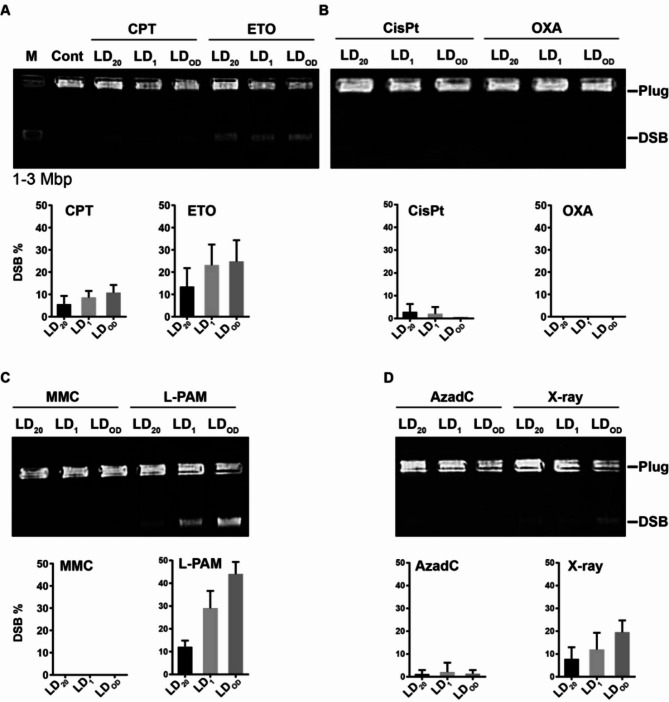
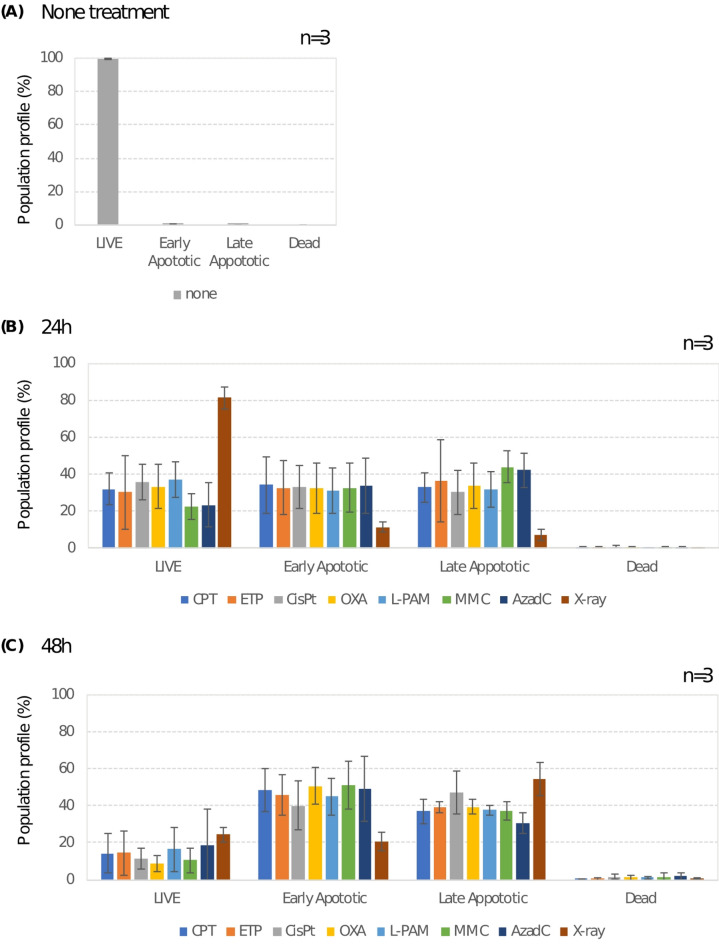
Chemotherapeutic drugs induce DNA damage, including double-strand breaks (DSBs), interstrand cross-links (ICLs), and DNA-protein cross-links (DPCs), to inhibit cancer cell proliferation. Understanding the relative contributions of these damages is essential for optimizing therapeutic strategies. To achieve physiologically relevant conditions, we determined the LD20 for four classes of chemotherapeutic agents and treated HeLa cells accordingly. Topoisomerase inhibitors (CPT, ETO) primarily induced DSBs and DPCs, whereas platinum-based agents (CisPt, OXA) predominantly caused DPCs and ICLs. The DNMT inhibitor AzadC was strongly associated with DPC formation. Although both L-PAM and MMC are bifunctional alkylating agents, their cytotoxic mechanisms differed; L-PAM induced DSBs, DPCs, and ICLs, while MMC primarily caused ICLs. DPCs were consistently detected across all drug treatments except MMC, with a half-life of 4.7 to 8.4 h, suggesting their prolonged impact on cytotoxicity. To assess apoptosis induction, we performed Annexin-V assays, which revealed significant apoptotic responses in all treated cells. CPT exhibited the highest proportion of early apoptotic cells (~ 80%) at 24 h, with all drug treatments shifting from early to late apoptosis over time. By 48 h, late apoptotic fractions exceeded 60% in CPT-, ETO-, and AzadC-treated cells. These findings highlight the critical role of DPCs in chemotherapeutic cytotoxicity and suggest that targeting apoptotic pathways could enhance cancer treatment efficacy.

Keywords: Cancer therapies; Chemotherapeutic drugs; Cytotoxicity; DNA damage; Equitoxic dose.


Conflict of interest statement

Declarations. Competing interests: The authors declare no competing interests.

Figures

Fig. 1
Fig. 1
Sensitivity of HeLa cells to chemotherapeutic drugs. (A) Cellular survival plots showing the response of HeLa cells to various chemo drugs and X-ray irradiation. (B) LD values of chemo drugs and X-ray irradiation. HeLa cells were treated with the indicated doses of drugs for 2 h (except for AzadC, which was treated for 24 h), washed twice with fresh medium and cultured for 7 days to form colonies. X-ray irradiated cells were similarly processed for survival analysis. Surviving colonies were then stained, counted, and the survival fractions for treated relative to untreated cells were calculated to construct the survival curves. Data points represent the means of at least three independent experiments, with error bars indicating the standard deviation.
Fig. 2
Fig. 2
Measurement of DSB induction in HeLa cells after treatment with chemo drugs. HeLa cells were treated with the indicated doses (LD20, LD1 and LDOD) for each of CPT and ETO (A), CisPt and OXA (B), MMC and L-PAM (C), and AzadC and X-ray (D). Cells were collected immediately after treatment, lysed, impeded in plug molds, and processed for DSB analysis using SFGE (upper panels) as described in materials and methods. The fraction of DNA released from the plug relative to total DNA (i.e., released and retained DNA) was used as a measure of DSBs (lower bands in the agarose gels). The DSBs percentages were calculated to quantify and demonstrate the dose dependent profiles (lower panels). X-ray irradiated cells served as positive controls for the induction of DSBs. Error bars represent the average value of three to four independent experiments plus or minus the standard deviation (SD).
Fig. 3
Fig. 3
Assessment of DNA damage induced by chemo drugs at LD20. (A) The fractions of DSB induction measured by SFGE after treatment with LD20 doses for drugs and X-ray as described in the materials and methods. (B) DPC induction in HeLa cells after treatment with chemo drugs. Genomic DNA was isolated from the drug-treated cells immediately after treatment and DPCs was quantified by using FITC-labeling method. (C) The association of ICLs with drug toxicity was evaluated by the unique sensitivity of FANC cells complementation group A (FANCA) and C (FANCC) relative to FANCD2rev, which served as a parental WT for the efficient repair of ICLs. Corresponding survival curves over a broader range of drug doses are provided in (Supplementary Fig. 2). Statistical analyses were performed using GraphPad Prism 6.0 software. Group differences were evaluated using the ANOVA test. Error bars represent the average value of three to four independent experiments plus or minus the standard deviation (SD). Significance levels are indicated by *P ≤ 0.05, **P ≤ 0.01, ***P ≤ 0.001, and ****P ≤ 0.0001.
Fig. 4
Fig. 4
Genetic analysis of the repair of DNA damage induced by chemo drugs at LD20. AA8 cells with functional repair mechanisms and those deficient in NER (XPD and XPF), NHEJ (DNA-PKcs), and HR (RAD51D and XRCC3) were treated with the LD20 doses of chemo drugs for 2 h (except for AzadC, which was treated for 24 h), washed twice with fresh medium, and allowed to form colonies for 7 days. We used the following drugs: (A) Topoisomerase inhibitors-Camptothecin (CPT) and Etoposide (VP-16); (B) Platinum agents-Cisplatin (cisPt) and Oxaliplatin (L-OHP); (C) Alkylating agents-Melphalan (L-PAM) and Mitomycin C (MMC); (D) DNMT inhibitor- 2′-deoxy-5-azacytidine (AzadC). The colonies were stained, counted, and surviving fractions were calculated for preparing the survival curves (Supplementary Fig. 4) and the DNA repair efficiencies at the LD20 were used for comparison of AA8 cells with deficient repair cells. Statistical analyses were performed using GraphPad Prism 6.0 software. Group differences were evaluated using the ANOVA test. Error bars represent the average value of three to four independent experiments plus or minus the standard deviation (SD). Significance levels are indicated by *P ≤ 0.05, **P ≤ 0.01, ***P ≤ 0.001, and ****P ≤ 0.0001.
Fig. 5
Fig. 5
Comparison of DSBs and DPCs removal kinetics in HeLa cells treated with LD20 of CPT, ETO, and L-PAM. HeLa cells were exposed to LD20 doses of the indicated drugs for 2 h and then collected at the specified time points. We used the following drugs: (A) CPT-treated cells, (B) ETO-treated cells (C) L-PAM-treated cells. For DSBs analysis, cells were lysed and assayed using SFGE. For DPCs analysis, cells were assayed using the FITC-labeling method. The remaining damage (DSBs or DPCs) after drug treatment was calculated relative to the initial amount of damage induced immediately after drug treatment, and half-lives were estimated accordingly. Error bars represent the mean of three independent experiments ± standard error of the mean.
Fig. 6
Fig. 6
Evaluation of apoptosis in HeLa cells treated with anticancer agents. Using the muse cell analyzer, an Annexin V experiment was performed to assess how anticancer drugs affected HeLa cells. HeLa cells were treated with the LD_OD (lethal dose for ≤ 0.1% survival) concentrations of seven anticancer drugs: camptothecin (10 µM), etoposide (25 µM), cisplatin (20 µM), oxaliplatin (60 µM), melphalan (25 µM), mitomycin C (1 µM), and 2′-deoxy-5-azacytidine (5 µM) for 24 h (B) and 48 h (C). (A) Represents untreated cells (no drug treatment). Based on Annexin V and propidium iodide (PI) staining, the percentage of live, early, late, dead, and dead cells was calculated to determine apoptosis. Statistical analysis was performed on triplicate experiments (n = 3), and data were expressed as mean ± SD.

References

    1. Helleday, T., Petermann, E., Lundin, C., Hodgson, B. & Sharma, R. A. DNA repair pathways as targets for cancer therapy. Nat. Rev. Cancer. 8, 193–204 (2008). - PubMed
    1. McHugh, P. J., Spanswick, V. J. & Hartley, J. A. Repair of DNA interstrand cross-links: molecular mechanisms and clinical relevance. Lancet Oncol.2, 483–490 (2001). - PubMed
    1. Deans, A. J. & West, S. C. DNA interstrand cross-link repair and cancer. Nat. Rev. Cancer. 11, 467–480 (2011). - PMC - PubMed
    1. Kim, H. & D’Andrea, A. D. Regulation of DNA cross-link repair by the Fanconi anemia/brca pathway. Genes Dev.26, 1393–1408 (2012). - PMC - PubMed
    1. Nakano, T. et al. Homologous recombination but not nucleotide excision repair plays a pivotal role in tolerance of DNA-protein cross-links in mammalian cells. J. Biol. Chem.284, 27065–27076 (2009). - PMC - PubMed

LinkOut - more resources