. 2025 Jul 2;15(1):23127.
doi: 10.1038/s41598-025-08709-5.

Emerging skeletal growth responses of Siderastrea siderea corals to multidecadal anthropogenic impacts in Martinique, Caribbean Sea

Affiliations

Emerging skeletal growth responses of Siderastrea siderea corals to multidecadal anthropogenic impacts in Martinique, Caribbean Sea

Gabriel O Cardoso et al. Sci Rep. .

Abstract

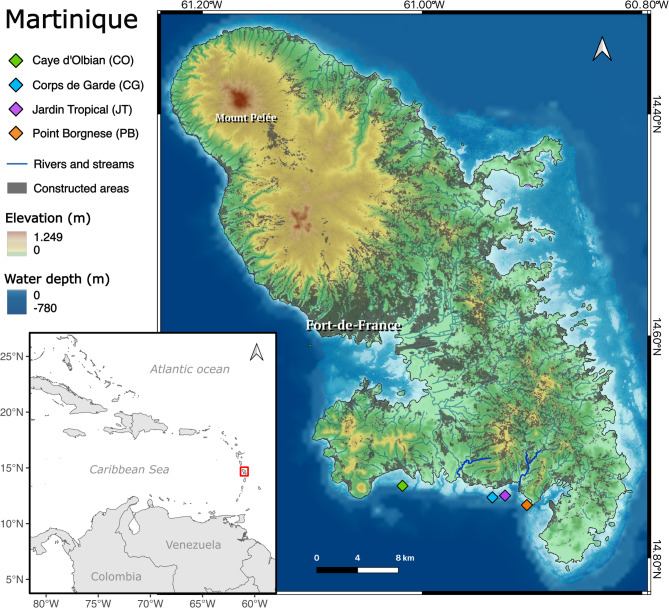
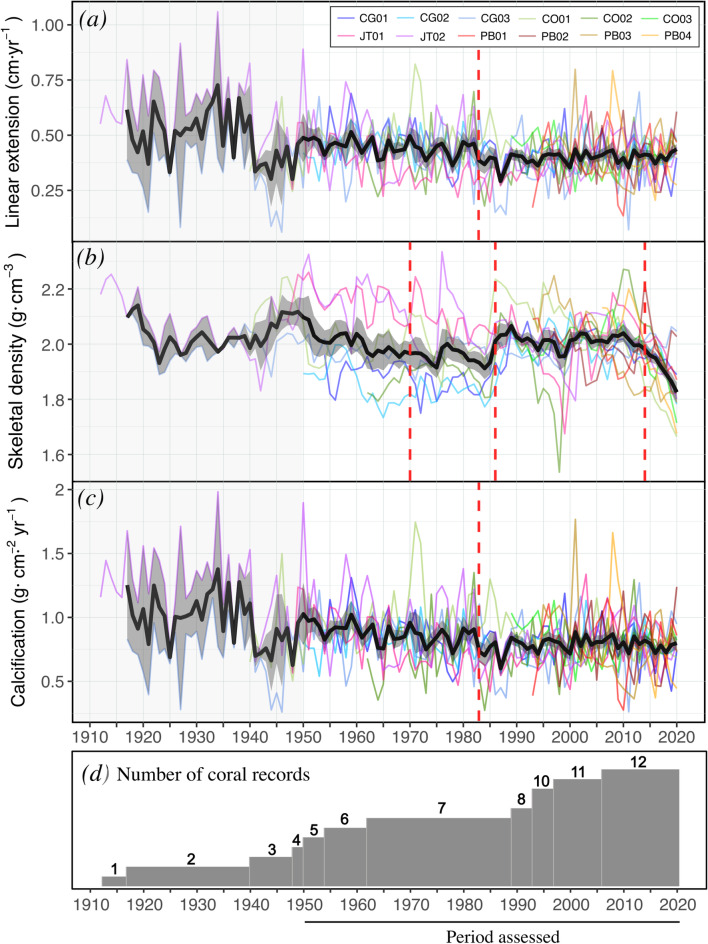
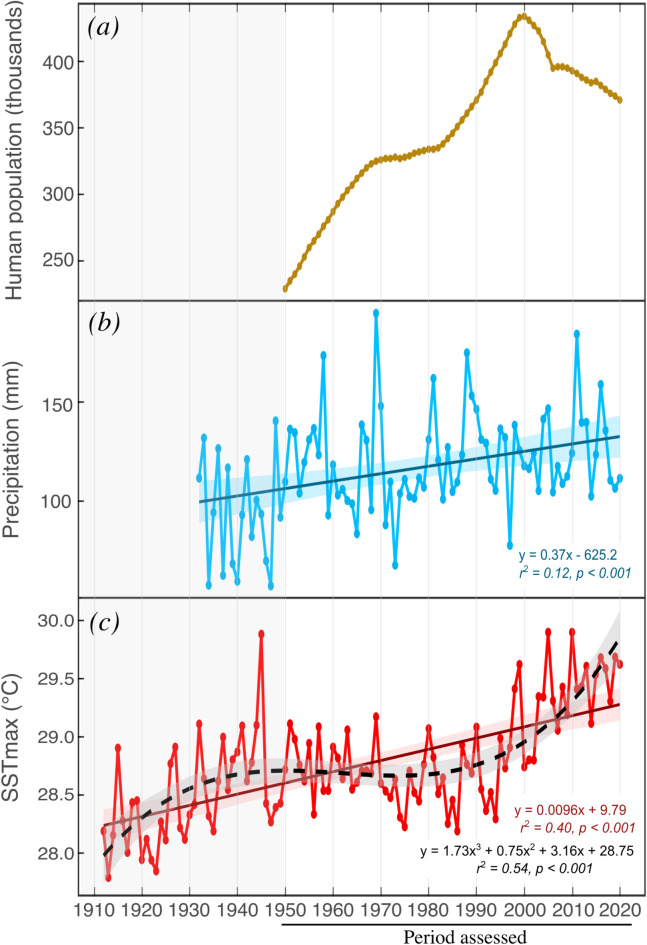
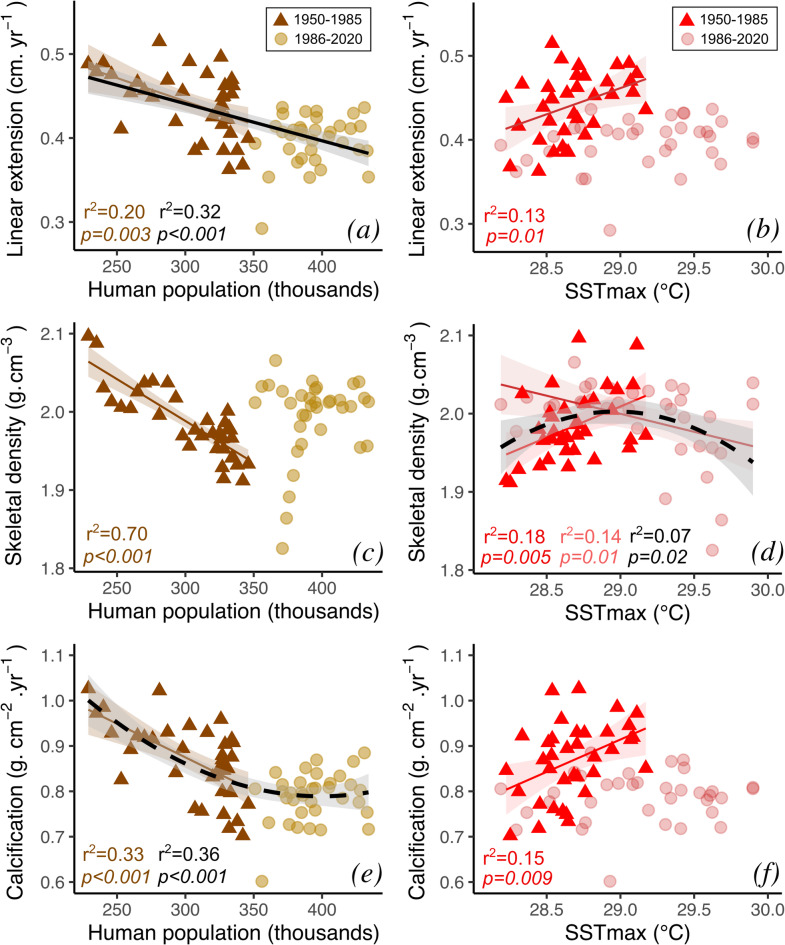
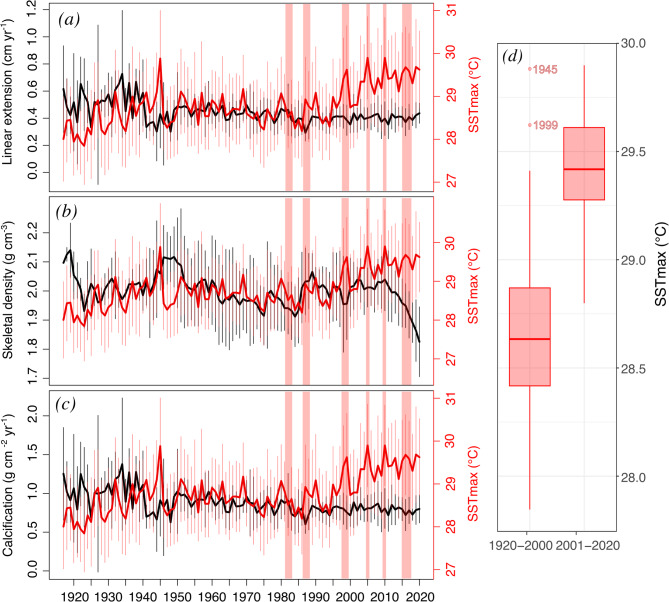
Anthropogenic stressors on Caribbean reefs have shifted coral dominance toward stress-tolerant species such as Siderastrea siderea, increasing their importance for reef construction. However, the sublethal responses of these corals to past stressors remain understudied, limiting our understanding of their long-term acclimatization capacity. Here, we reconstructed the annual skeletal growth rates (1912-2020) of twelve S. siderea coral colonies from Martinique (Caribbean Sea) and examined their relationships with changes in human population, sea surface temperature (SST), precipitation, river discharge, and agricultural indicators between 1950 and 2020. Long-term growth rate declines observed since the 1950s were initially associated with human population, a proxy for local stress. Warming SST enhanced coral skeletal growth between 1950 and 1985, suggesting optimal temperatures for calcification during this interval. However, skeletal density exhibited a multidecadal (1950-2020) parabolic response, indicating a surpassing of this thermal optimum in recent decades. This parabolic response included persistent skeletal density declines from 2010 to 2020, possibly related to cumulative thermal stress or the interaction with ocean acidification effects. Our findings suggest a limited acclimatization capacity of long-lived S. siderea corals to cumulative pressures in Martinique and highlight their vulnerability to the compounding effects of local stressors and climate change.

Keywords: Caribbean sea; Climate change; Coral reefs; Local stressors; Sclerochronology; Sublethal effects.


Conflict of interest statement

Declarations. Competing interests: The authors declare no competing interests.

Figures

Fig. 1
Fig. 1
Map of Martinique, Caribbean Sea. Location of collection sites is shown in coloured diamonds. Elevation, water depth, constructed areas (Geoservices 2022, https://geoservices.ign.fr/), and rivers and streams are shown. Major rivers (in terms of volume) discharging in the south are highlighted with bold, dark blue: Oman River and Rivière-Pilote River (from left to right).
Fig. 2
Fig. 2
Normalized annual records (1917–2020) of (a) linear extension rate, (b) skeletal density, and (c) calcification rate for coral cores collected in Corps de Garde (CG01-03), Caye d’Olbian (CO01-03), Jardin Tropical (JT01-02), and Pointe Borgnèse (PB01-04). The coloured lines represent individual core records, the black bold lines represent the master chronology, and the envelopes represent the associated standard error. Vertical dashed red lines highlight the timings of significant regime shifts in the mean values. (d) The bar chart in the bottom panel shows the number of coral cores available. The period from 1950 to 2020 encompasses the timeframe used to explore growth responses to variations in environmental conditions.
Fig. 3
Fig. 3
Annual series of (a) human population (1950–2020), (b) precipitation (1932–2020), and (c) monthly mean maximum sea surface temperature (SSTmax; 1912–2020). Linear trend analyses represented by solid lines show significant increases in precipitation (r2 = 0.06, p = 0.01) and SSTmax (r2 = 0.40, p < 0.001, n = 108). A third-degree polynomial (r2 = 0.54, p < 0.001, n = 108) is also included for SSTmax, represented by the black dashed line. The envelopes show the associated standard error.
Fig. 4
Fig. 4
Scatter plots based on log-transformed annual time series of growth parameters and human population (a,c,e) and monthly mean maximum sea surface temperature (SSTmax; b,d,f). Triangles and circles represent the periods 1950 to 1985 and 1986 to 2020, respectively. Regression lines with 95% confidence intervals, and the corresponding coefficients of determination and p-values are indicated only when statistical significance (p < 0.05) exists. The coloured lines correspond to either 1950 to 1985 or 1986 to 2020, and the black bold lines correspond to 1950 to 2020. The type of regression is represented by the solid (linear) and dashed (polynomial) lines.
Fig. 5
Fig. 5
Master chronologies of linear extension rates (a), skeletal density (b), calcification rates (c), and sea surface temperature maximum (SSTmax) from 1917–2020. The vertical lines indicate the standard deviation. The vertical red bars represent mass bleaching events documented in the wider Caribbean (Glynn, 1991; Eakin et al., 2010, 2022; Muñiz-Castillo et al., 2019). Boxplots (d) show the SSTmax values from two periods: 1920–2000 and 2001–2020.

Similar articles

References

    1. Hughes, T. P. et al. Coral reefs in the anthropocene. Nature546, 82–90 (2017). - PubMed
    1. Woodhead, A. J. et al. Coral reef ecosystem services in the anthropocene. Funct. Ecol.33, 1023–1034 (2019).
    1. Perry, C. T. Alvarez-Filip, L. Changing geo‐ecological functions of coral reefs in the anthropocene. Funct. Ecol.33, 976–988 (2018).
    1. Cornwall, C. E. et al. Global declines in coral reef calcium carbonate production under ocean acidification and warming. Proc. Natl. Acad. Sci. U S A118 (2021). - PMC - PubMed
    1. Donovan, M. K. et al. Local conditions magnify coral loss after marine heatwaves. Science372, 977–980 (2021). - PubMed

LinkOut - more resources